
Power BI Finance & Accounting Dashboard Examples
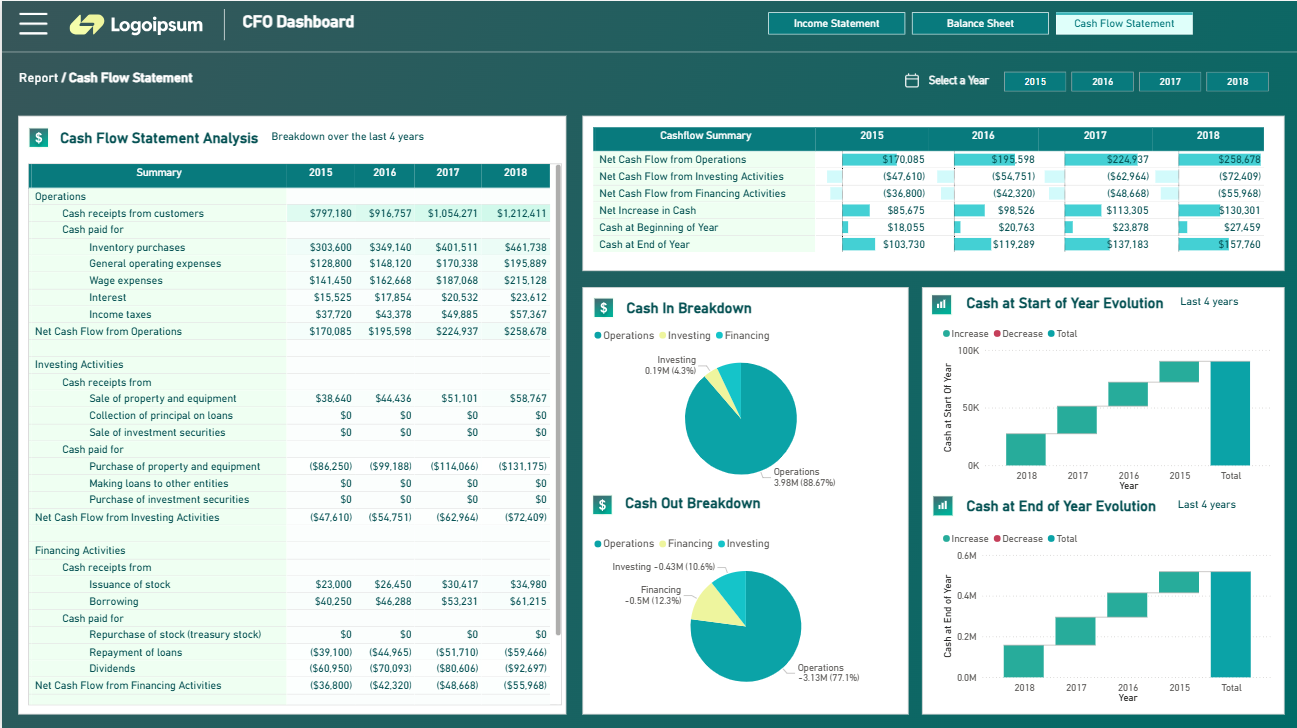
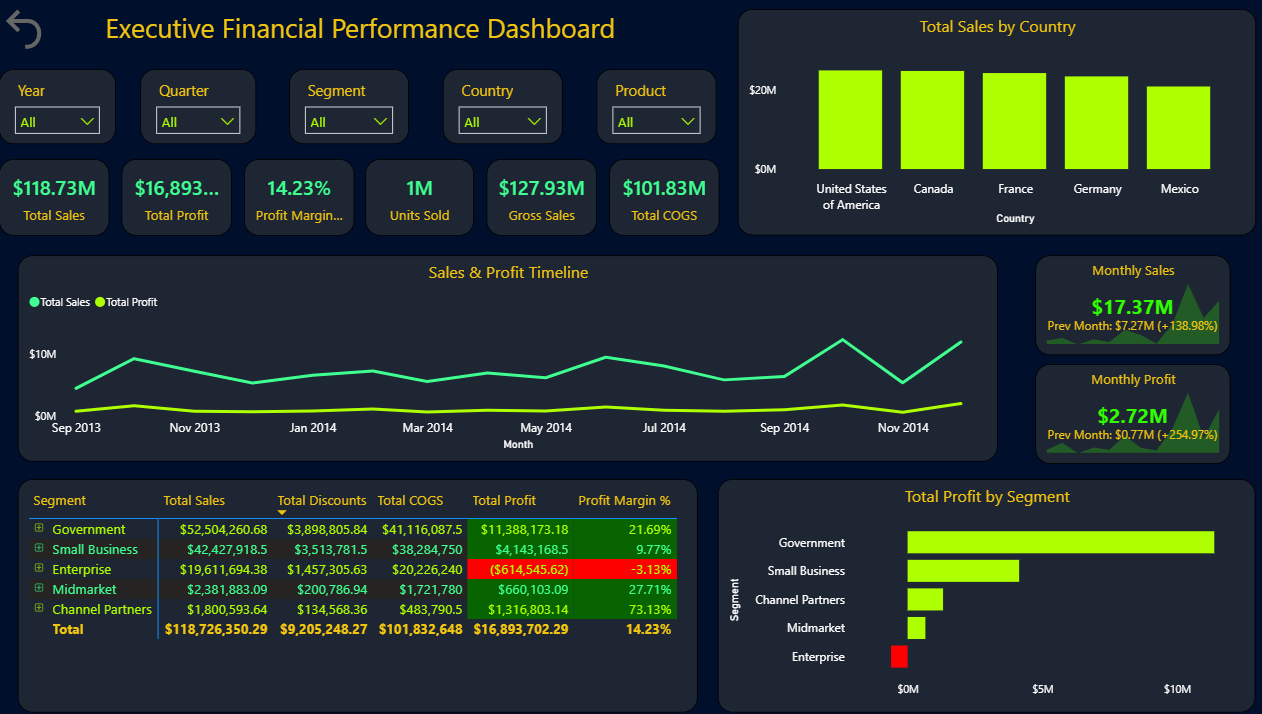
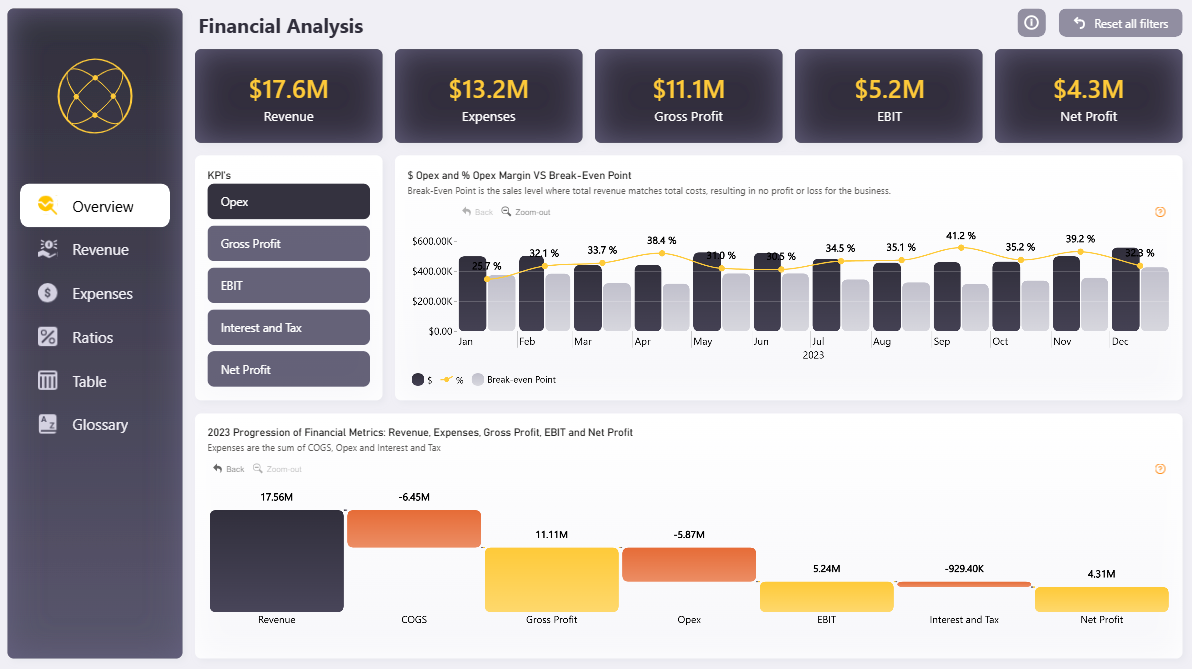
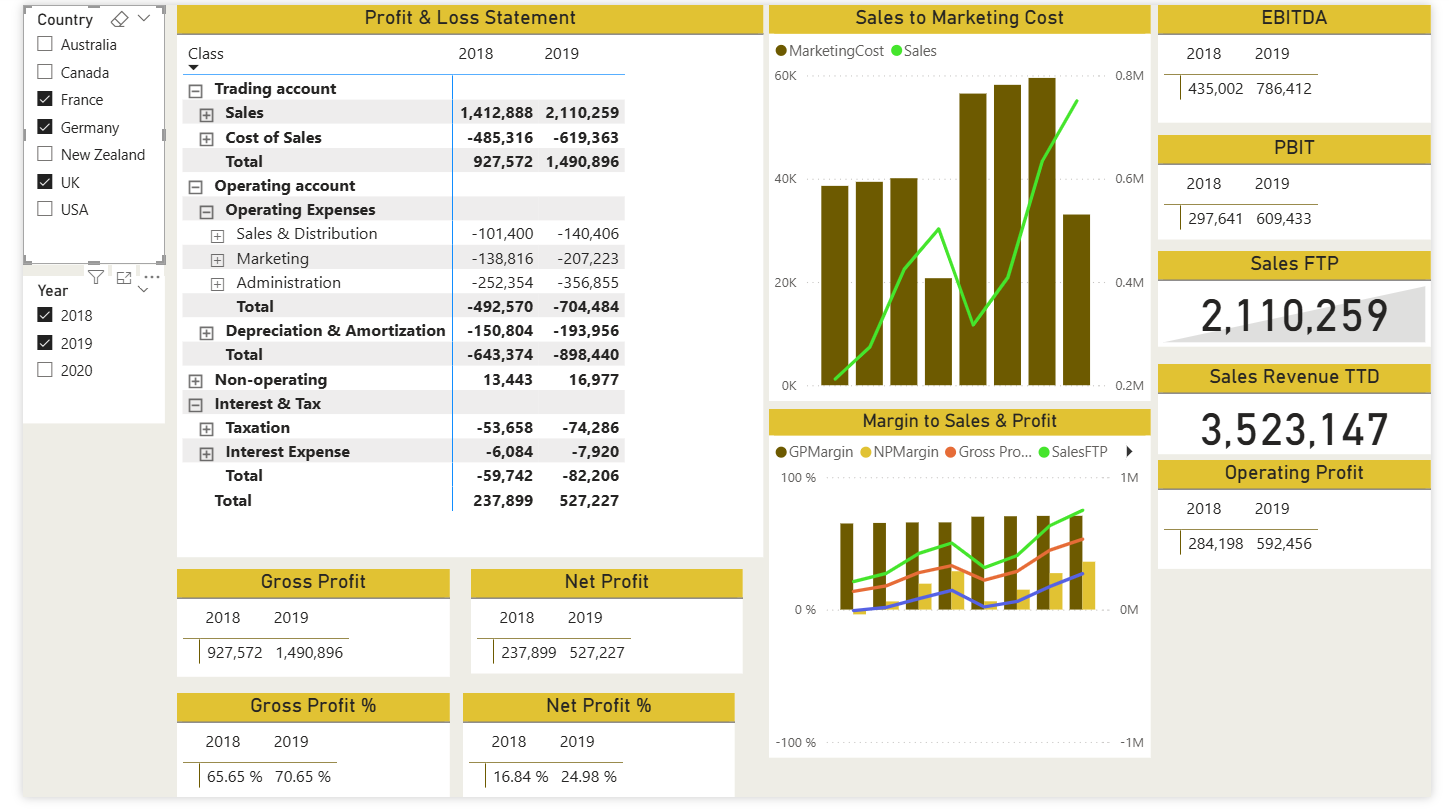
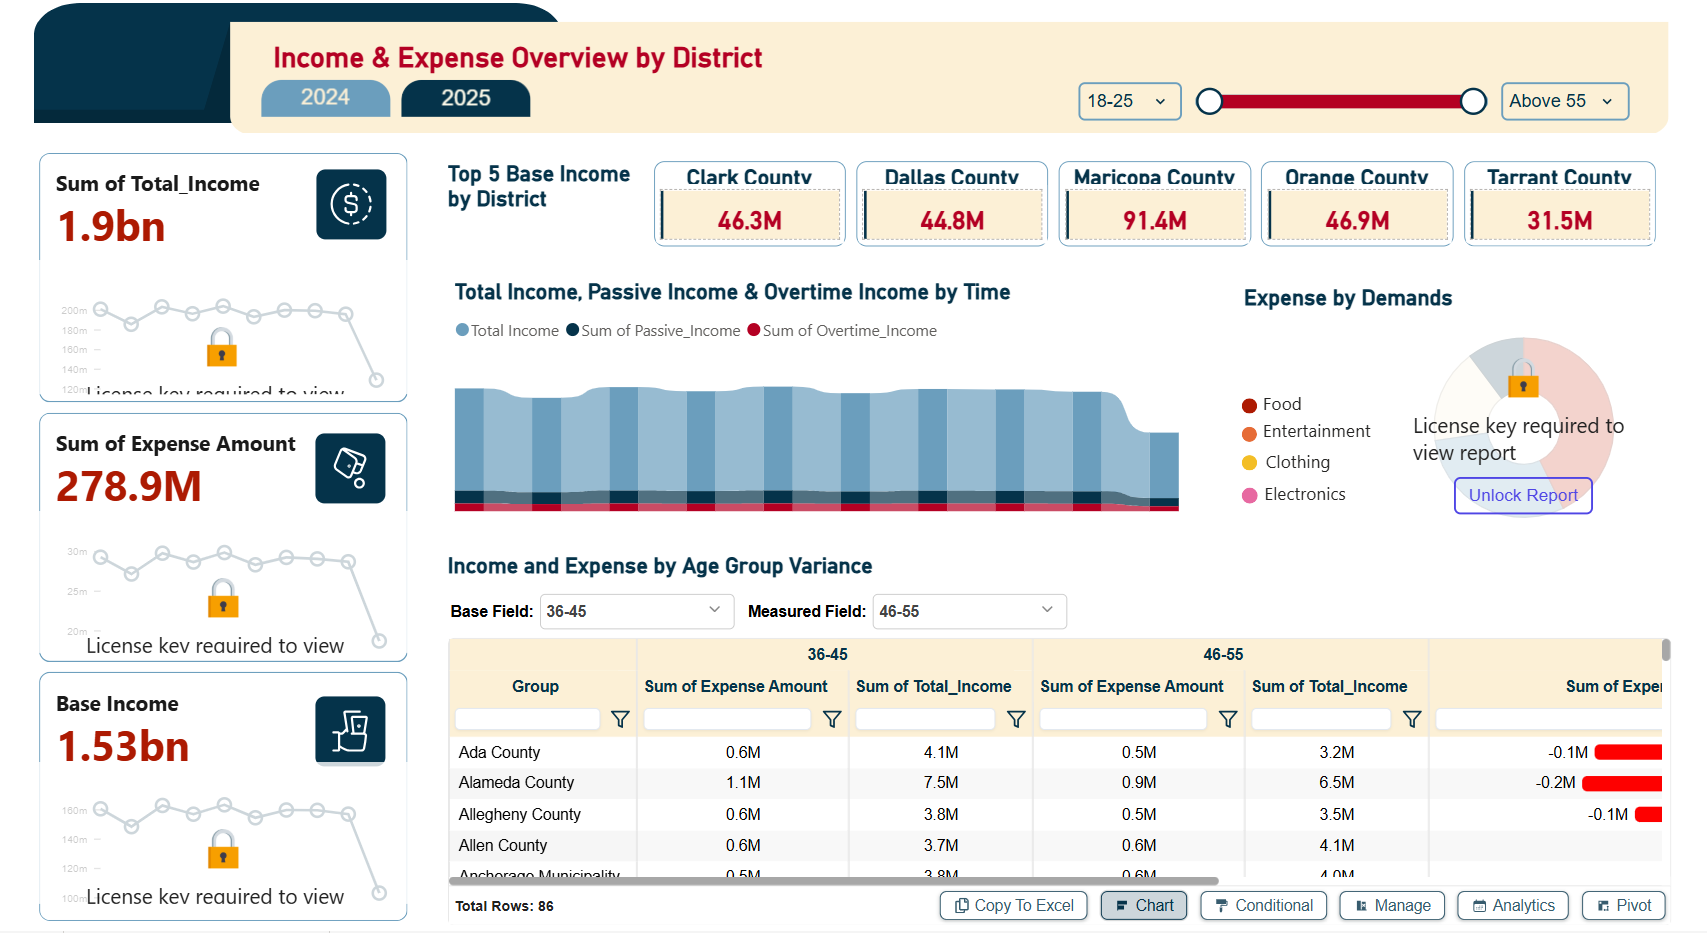
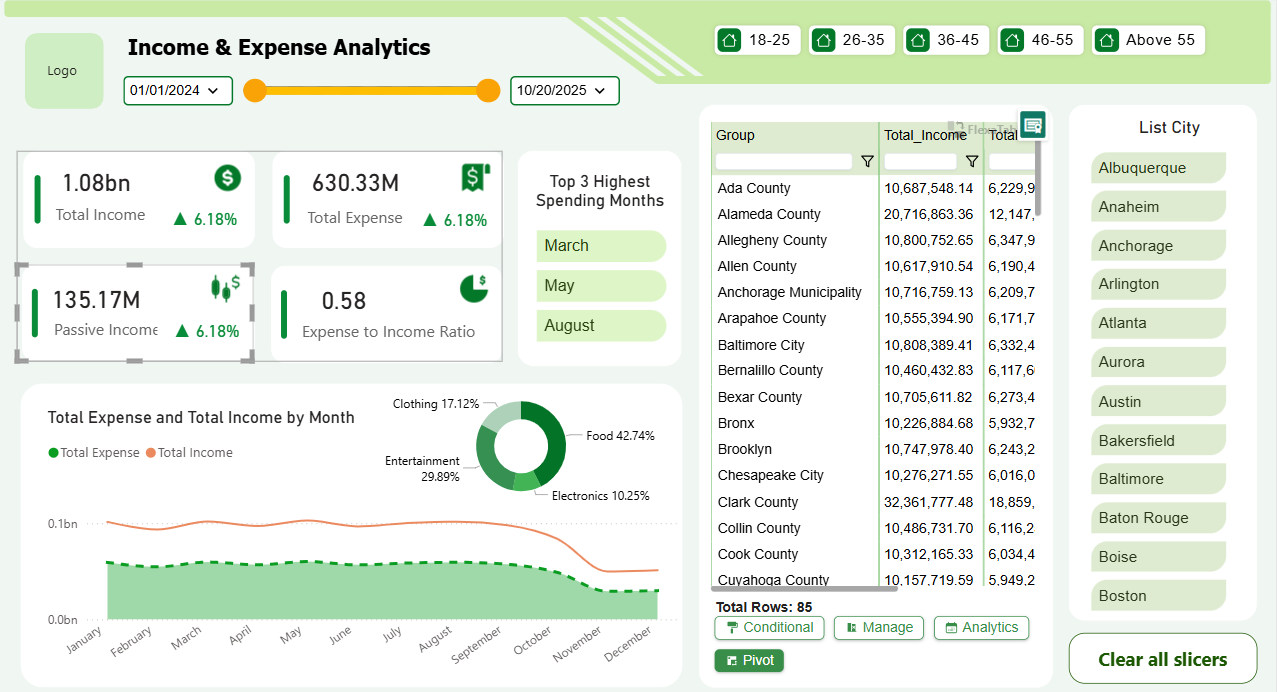
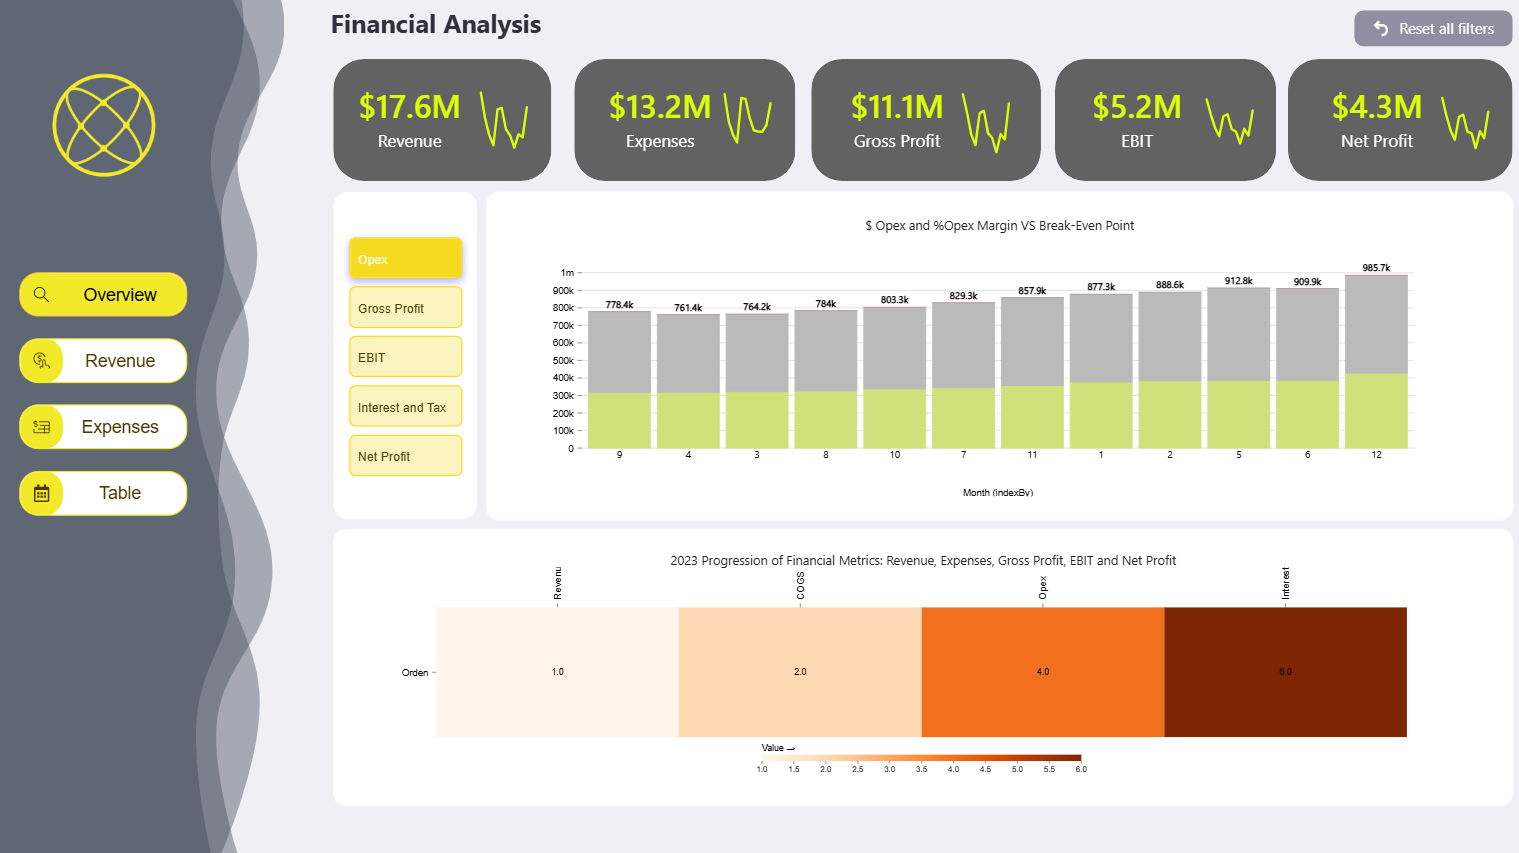
Financial reporting in Power BI has one hard part: layout. Income statements need strict row ordering, subtotals, and variance columns that plain matrix visuals fight against. The templates below solve that — P&L statements, budget-vs-actual variance reports, cash flow views and expense breakdowns built with patterns that survive contact with real general-ledger data.
Pair them with Flexa Tables if you need pixel-accurate financial statements; every template here works standalone in vanilla Power BI too.
16 templates in Finance & Accounting
Browse all templates →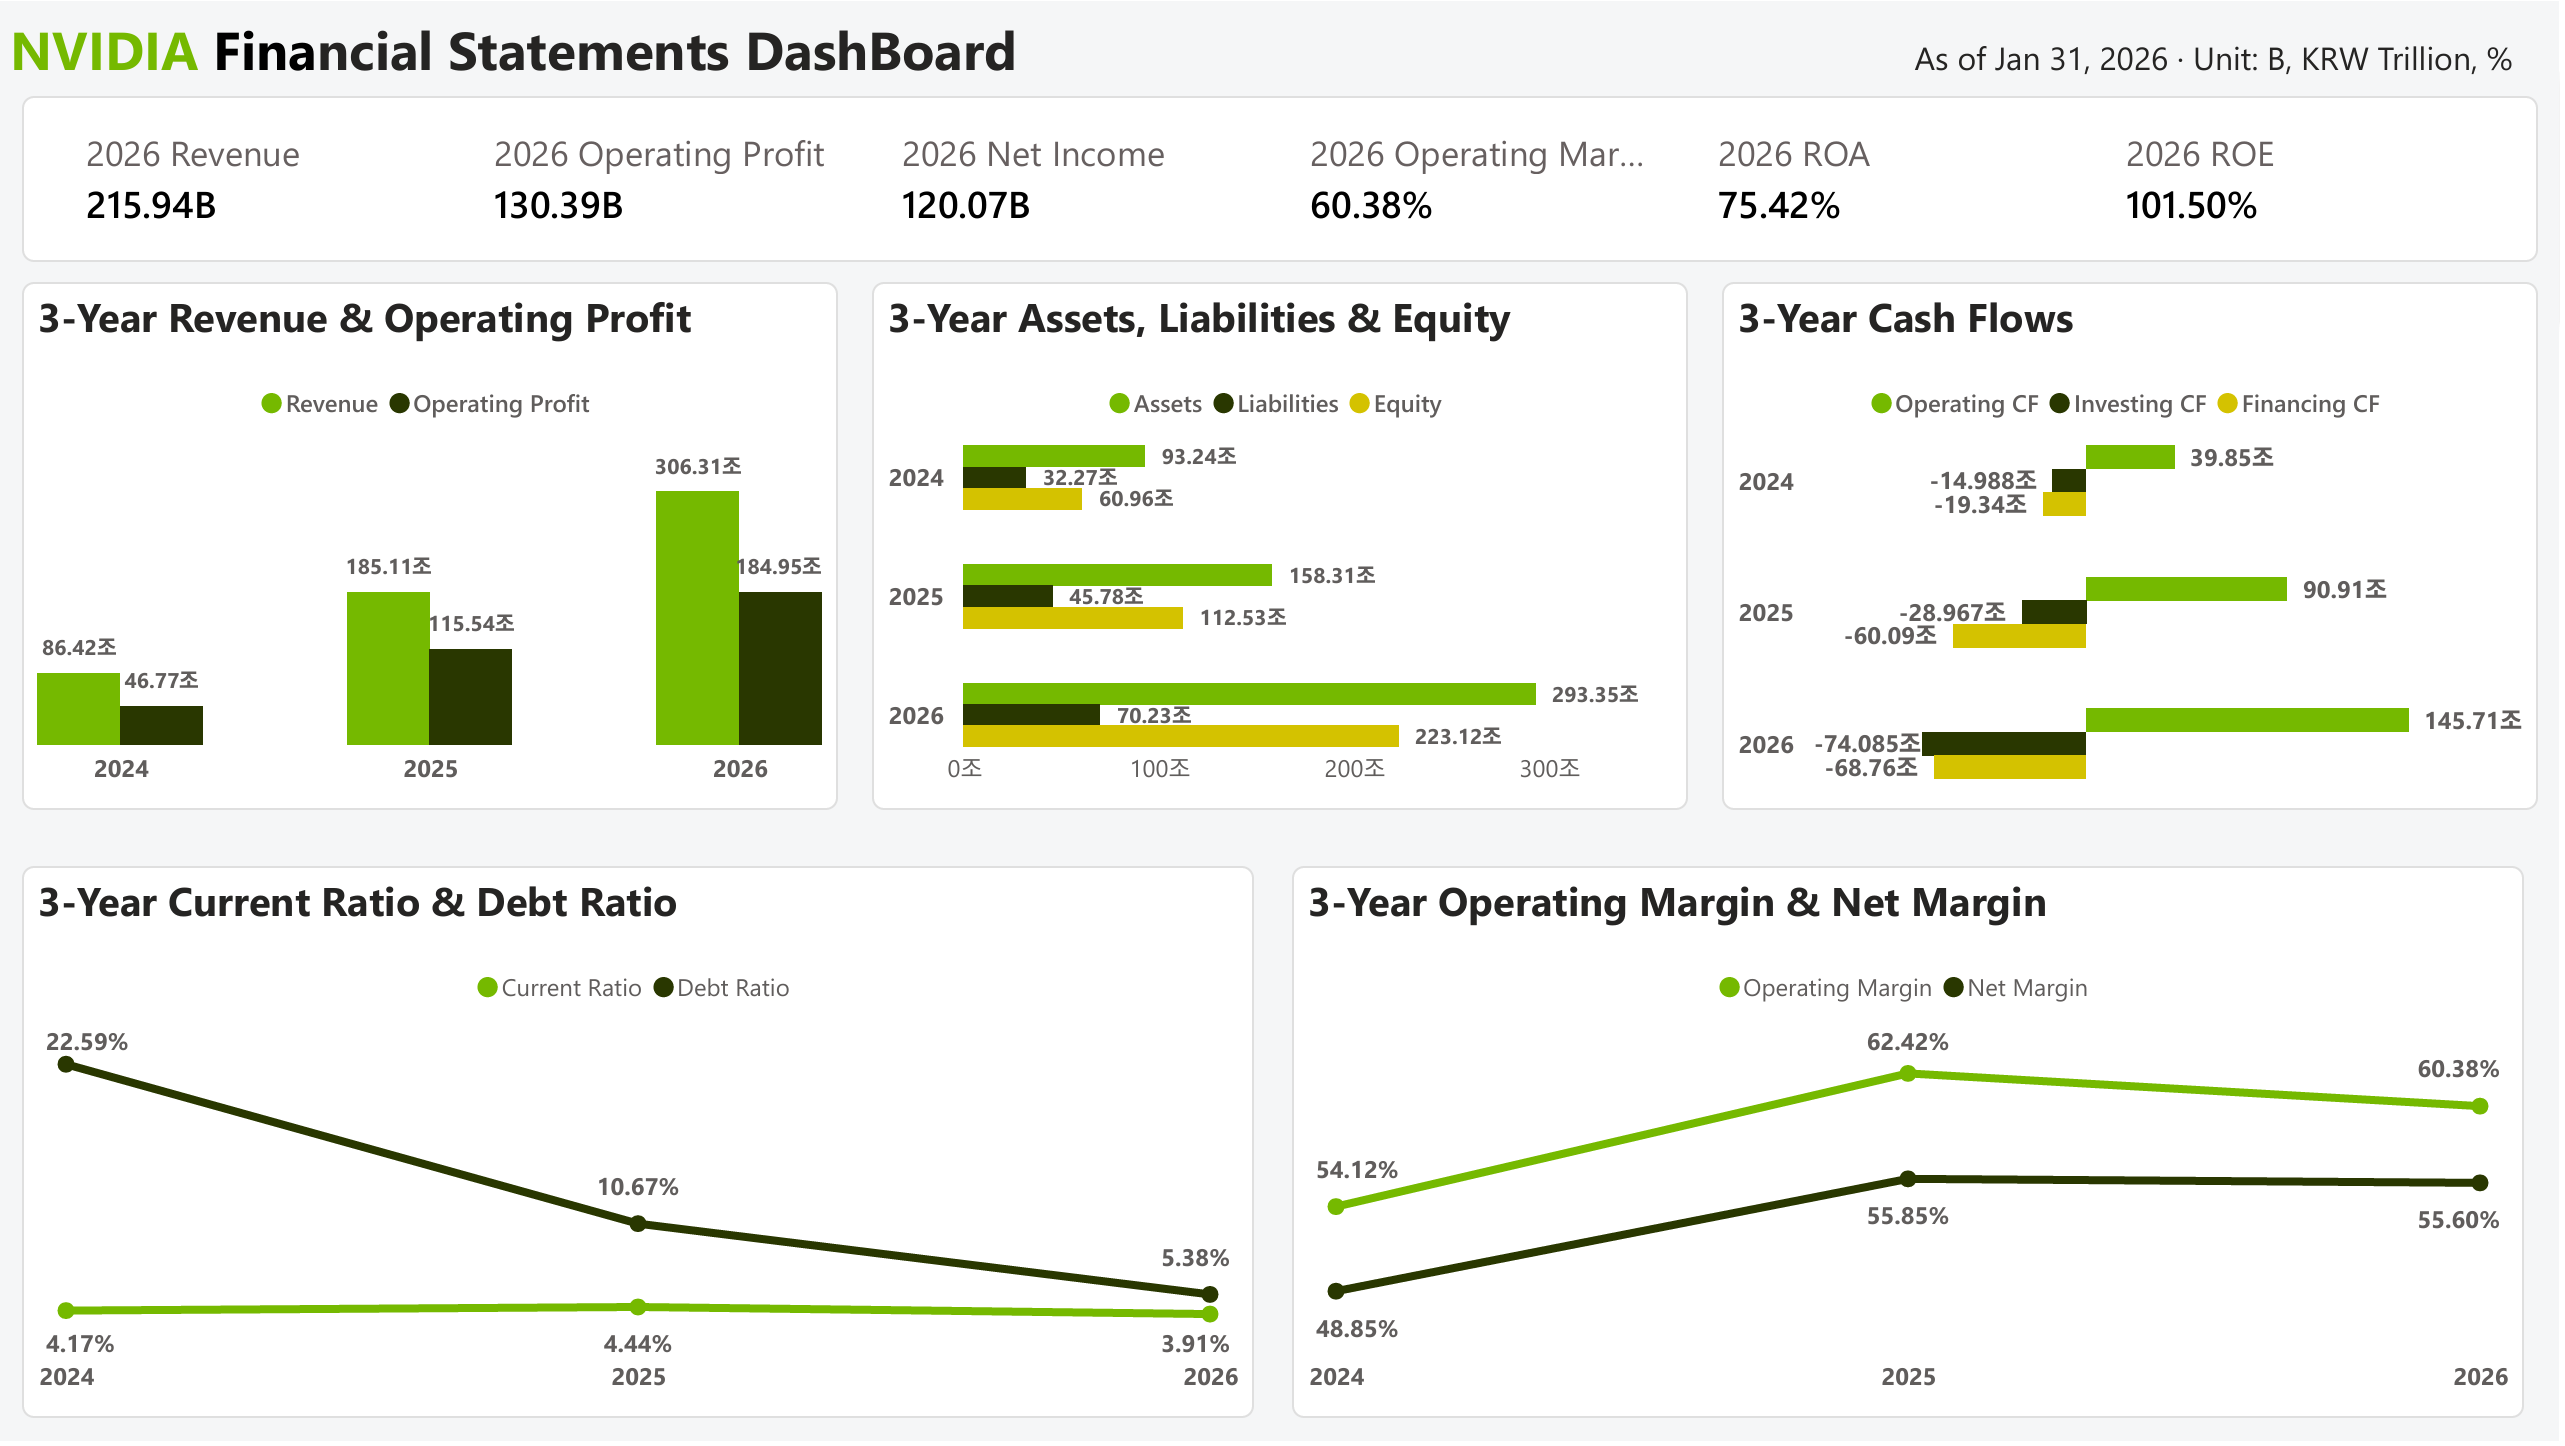


Frequently asked questions
Can these templates produce a proper P&L layout in Power BI?
Yes — the finance templates use measure-driven row layouts (and optionally Flexa Tables) to get accountant-grade income statement formatting: ordered line items, subtotals, and variance columns.
How do I map my chart of accounts into a template?
Each finance PBIX includes a mapping table (account → statement line). Replace it with your own chart of accounts in Power Query and the statement re-renders with your structure.
Do the dashboards handle budget vs actual comparison?
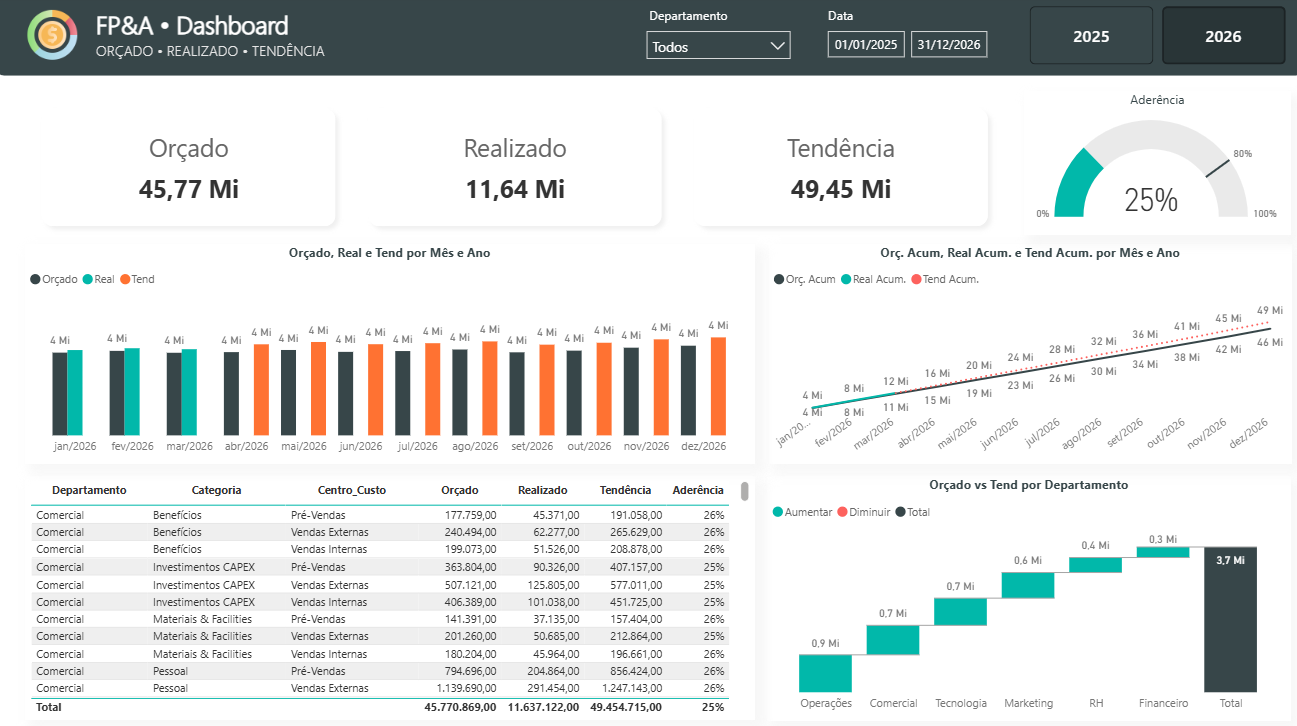
The variance templates ship with actual, budget and prior-year scenarios plus pre-written variance and variance-% measures, including favourable/unfavourable colour logic.