Power BI CFO Cash Flow Statement Dashboard Template (Free PBIX Download)
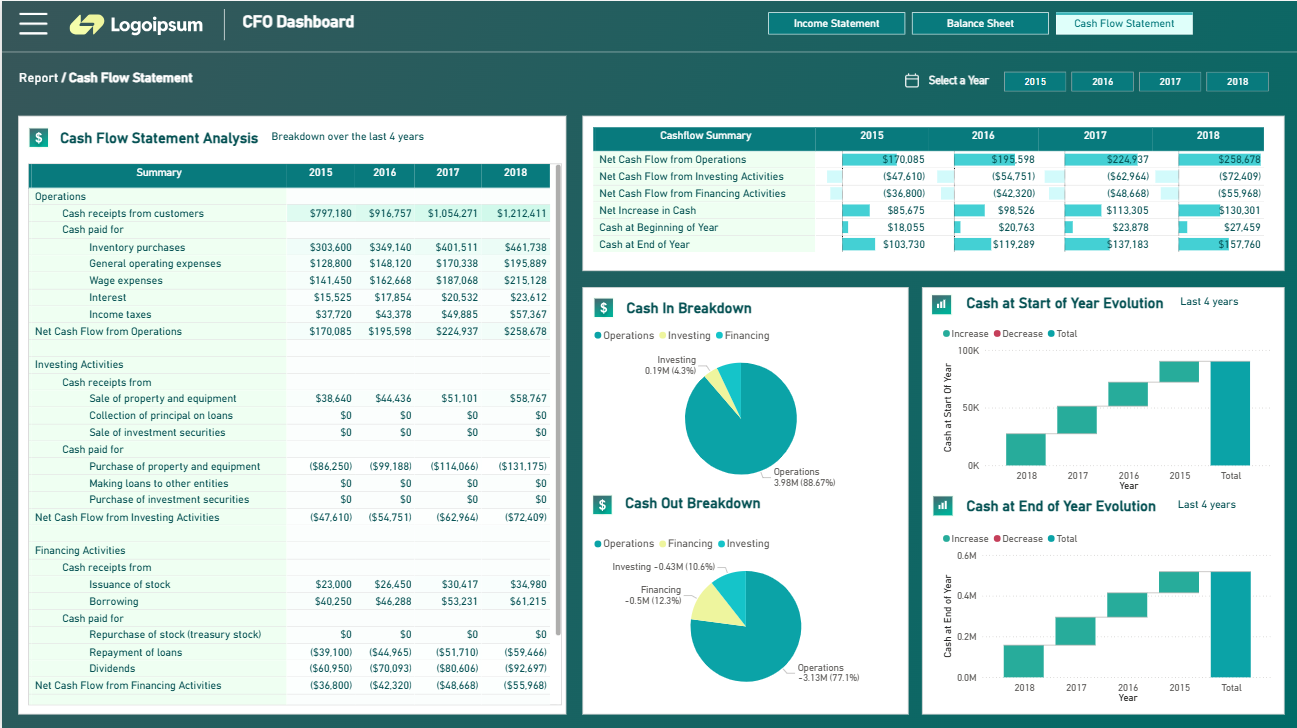
Introduction: This Power BI CFO Dashboard delivers a complete 4-year cash flow statement analysis (2015–2018) across all three GAAP cash flow categories — Operating, Investing, and Financing Activities — in a single page. It combines a detailed line-item cash flow table, a 4-year summary matrix, cash in/out composition charts, and beginning/end-of-year cash evolution visuals. Designed for CFOs and controllers who need both the granular line-item detail and the executive-level cash position trend without switching between reports.
What's Inside This Template
Three-Tab Structure (top navigation): Income Statement | Balance Sheet | Cash Flow Statement (active)
This is a full financial reporting suite — the Cash Flow tab shown here is one of three integrated statements, making this a complete CFO reporting package in a single PBIX file.
Year Selector: 2015 | 2016 | 2017 | 2018 — filters all visuals to a specific year while the table retains all four years for cross-year comparison.
Cash Flow Statement Table (left panel — full detail)
Operations:
| Line Item2015201620172018 | ||||
| Cash receipts from customers | $797,180 | $916,757 | $1,054,271 | $1,212,411 |
| Inventory purchases | $303,600 | $349,140 | $401,511 | $461,738 |
| General operating expenses | $128,800 | $148,120 | $170,338 | $195,889 |
| Wage expenses | $141,450 | $162,668 | $187,068 | $215,128 |
| Interest | $15,525 | $17,854 | $20,532 | $23,612 |
| Income taxes | $37,720 | $43,378 | $49,885 | $57,367 |
| Net Cash Flow from Operations | $170,085 | $195,598 | $224,937 | $258,678 |
Investing Activities:
| Line Item2015201620172018 | ||||
| Sale of property and equipment | $38,640 | $44,436 | $51,101 | $58,767 |
| Collection of principal on loans | $0 | $0 | $0 | $0 |
| Sale of investment securities | $0 | $0 | $0 | $0 |
| Purchase of property and equipment | ($86,250) | ($99,188) | ($114,066) | ($131,175) |
| Making loans to other entities | $0 | $0 | $0 | $0 |
| Purchase of investment securities | $0 | $0 | $0 | $0 |
| Net Cash Flow from Investing | ($47,610) | ($54,751) | ($62,964) | ($72,409) |
Financing Activities:
| Line Item2015201620172018 | ||||
| Issuance of stock | $23,000 | $26,450 | $30,417 | $34,980 |
| Borrowing | $40,250 | $46,288 | $53,231 | $61,215 |
| Repurchase of stock | $0 | $0 | $0 | $0 |
| Repayment of loans | ($39,100) | ($44,965) | ($51,710) | ($59,466) |
| Dividends | ($60,950) | ($70,093) | ($80,606) | ($92,697) |
| Net Cash Flow from Financing | ($36,800) | ($42,320) | ($48,668) | ($55,968) |
Cashflow Summary Matrix (top right)
| Metric2015201620172018 | ||||
| Net CF from Operations | $170,085 | $195,598 | $224,937 | $258,678 |
| Net CF from Investing | ($47,610) | ($54,751) | ($62,964) | ($72,409) |
| Net CF from Financing | ($36,800) | ($42,320) | ($48,668) | ($55,968) |
| Net Increase in Cash | $85,675 | $98,526 | $113,305 | $130,301 |
| Cash at Beginning of Year | $18,055 | $20,763 | $23,878 | $27,459 |
| Cash at End of Year | $103,730 | $119,289 | $137,183 | $157,760 |
The summary matrix reproduces the statement totals in a clean comparison format — the primary tool for trend analysis across all four years simultaneously.
Cash In Breakdown (Pie Chart)
| SourceAmountShare | ||
| Operations | 3.98M | 88.67% |
| Investing | 0.19M | 4.3% |
| Financing | ~0.32M | ~7% |
Operations generate 88.67% of all cash inflows — a healthy sign that the business is self-funding from core operations rather than relying on asset sales or external financing to maintain liquidity.
Cash Out Breakdown (Pie Chart)
| DestinationAmountShare | ||
| Operations | -3.13M | 77.1% |
| Financing | -0.5M | 12.3% |
| Investing | -0.43M | 10.6% |
Operations consume 77.1% of outflows, Financing 12.3% (dividends + loan repayments), Investing 10.6% (capex). The net Operations cash flow (In $3.98M − Out $3.13M = $0.85M net positive) is the engine driving all cash position growth.
Cash at Start of Year Evolution (Bar Chart)
Shows beginning-of-year cash position across 2015–2018 plus Total:
- 2015: ~$18K
- 2016: ~$21K
- 2017: ~$24K
- 2018: ~$27K
Steady staircase growth pattern — each year begins with more cash than the previous year, confirming compounding cash accumulation with no years of cash drawdown.
Cash at End of Year Evolution (Bar Chart)
| YearEnd Cash | |
| 2015 | $103,730 |
| 2016 | $119,289 |
| 2017 | $137,183 |
| 2018 | $157,760 |
End-of-year cash grows from $103.7K to $157.8K — a 52.1% cumulative increase over four years, or approximately 11% CAGR. The consistent green "Increase" bars with no red "Decrease" bars across any year confirms uninterrupted positive cash generation throughout the period.
Key Insights
- Operating cash flow grows at a perfectly consistent 52.1% CAGR ($170K → $258K) driven entirely by customer receipts scaling faster than operating costs. Customer receipts grew from $797K to $1.21M (+52%) while total operating outflows grew from $627K to $953K (+52%) — costs and revenues are scaling in lockstep. This is a stable business model with no operating leverage improvement but also no margin erosion: the cash conversion ratio has held constant across all four years.
- Investing activities show a structurally negative but controlled pattern: capex consistently outpaces asset disposals by ~2.2x. Property purchases ($86K → $131K) are the only investing outflow — the business has zero investment in securities or loans to third parties. Asset disposals ($38K → $58K) cover approximately 45% of capex each year. The increasing net investing outflow (-$47K → -$72K, +52% over 4 years) mirrors operational growth exactly — capex is scaling proportionally with revenue, not accelerating, which rules out a major expansion program.
- Dividends are the single largest financing outflow, exceeding all other financing items combined. In 2018: Dividends ($92,697) vs Borrowing ($61,215) vs Stock issuance ($34,980) vs Loan repayments ($59,466). The business is simultaneously borrowing and paying dividends — a capital structure decision that prioritizes shareholder returns over debt paydown. Net financing is negative every year (-$36K → -$55K) meaning dividends + loan repayments consistently exceed new borrowing + stock issuance.
- The Net Increase in Cash ($85K → $130K, +52% over 4 years) is entirely funded by Operations — Investing and Financing are both net negative every year. This is the textbook definition of a financially healthy, self-sustaining business: operational cash generation more than covers both capital investment and shareholder returns without requiring additional external financing to maintain or grow the cash balance.
- Cash at End of Year ($103K → $157K) growing at 11% CAGR while customer receipts grow at 15% CAGR means cash is accumulating slower than revenue. The gap is explained by proportionally higher dividend payments growing at ~15% annually. If dividend growth continues at this pace and operations slow, the cash buffer could compress — the CFO should model the scenario where customer receipt growth drops to 5–8% while dividend commitments remain at current trajectory.
- All investing activity is exclusively capex (property/equipment) with zero activity in securities, loans, or M&A across all four years. This is a pure organic growth model with no financial investment strategy. The $0 entries across securities and loans are not gaps — they are a deliberate strategic signal that management is reinvesting only in physical operating capacity, not building a financial asset base. For a CFO audience, this is a key capital allocation insight: the business has no diversification beyond its operating model.
Who This Template Is For
- CFOs and Financial Controllers who need a board-ready cash flow statement that shows both granular line-item detail and 4-year trend analysis in a single view, replacing static Excel cash flow reports with an interactive Power BI dashboard filtered by year
- Finance Analysts and Accountants building standardized GAAP-compliant financial reporting packages that combine Income Statement, Balance Sheet, and Cash Flow Statement in one integrated Power BI file with consistent formatting
- BI Developers building financial reporting systems for mid-market companies who need a production-ready CFO dashboard template with three-statement structure, year-selector navigation, and conditional-formatted summary matrices
How to Use
- Download the PBIX file
- Open in Power BI Desktop
- Connect your accounting data source — the model requires a cash flow transactions table with year, activity category (Operating/Investing/Financing), line item name, and amount fields (compatible with Excel exports from QuickBooks, SAP, NetSuite, or any ERP system)
- All line items, summary matrix, pie charts, and evolution bar charts update automatically; use the year selector (2015–2018) to filter the visual panel while retaining the full 4-year comparison table
"The cash flow table in this dashboard uses a native Power BI matrix. To add collapsible activity sections (Operating/Investing/Financing), variance-to-prior-year columns, and color-coded positive/negative formatting per line item — Flexa Tables is a Microsoft-certified Power BI visual purpose-built for structured financial statement reporting with full hierarchy and conditional formatting control."
Other Templates
 Free Sales & Revenue
Power BI Sales Dashboard with Variance Analysis — Contoso BI Template (Free PBIX Download)
 Free Sales & Revenue
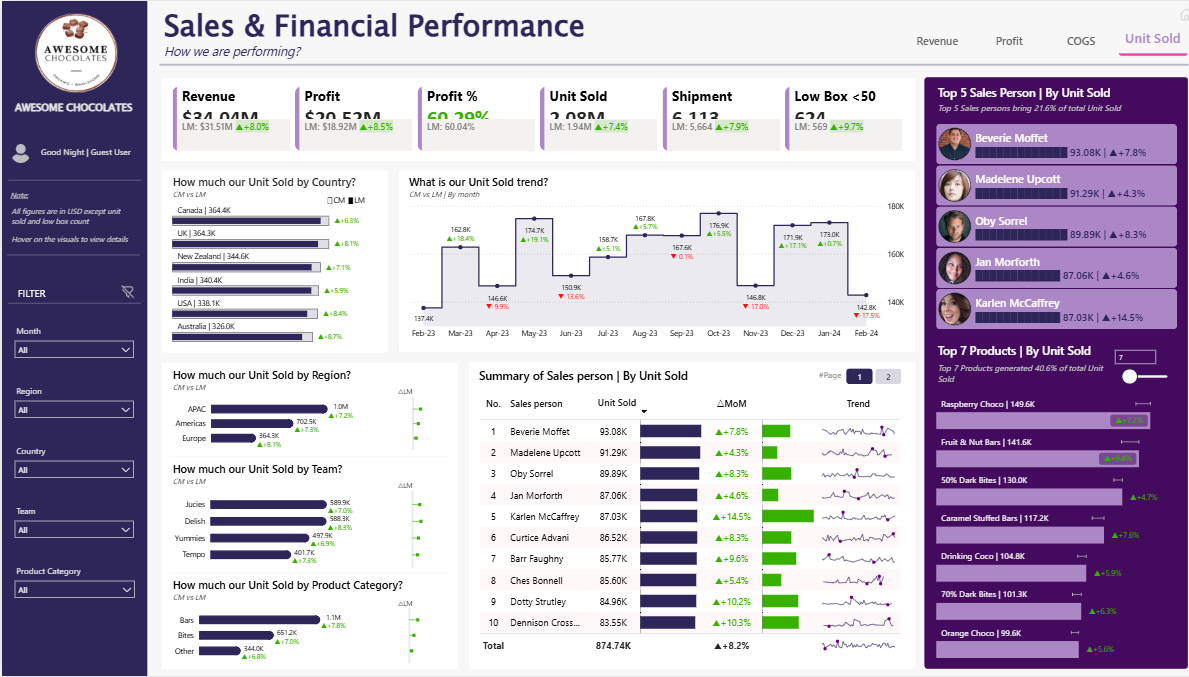
Power BI Sales & Financial Performance Dashboard Template — FMCG Retail Analytics (Free PBIX Download)
 Free Finance & Accounting
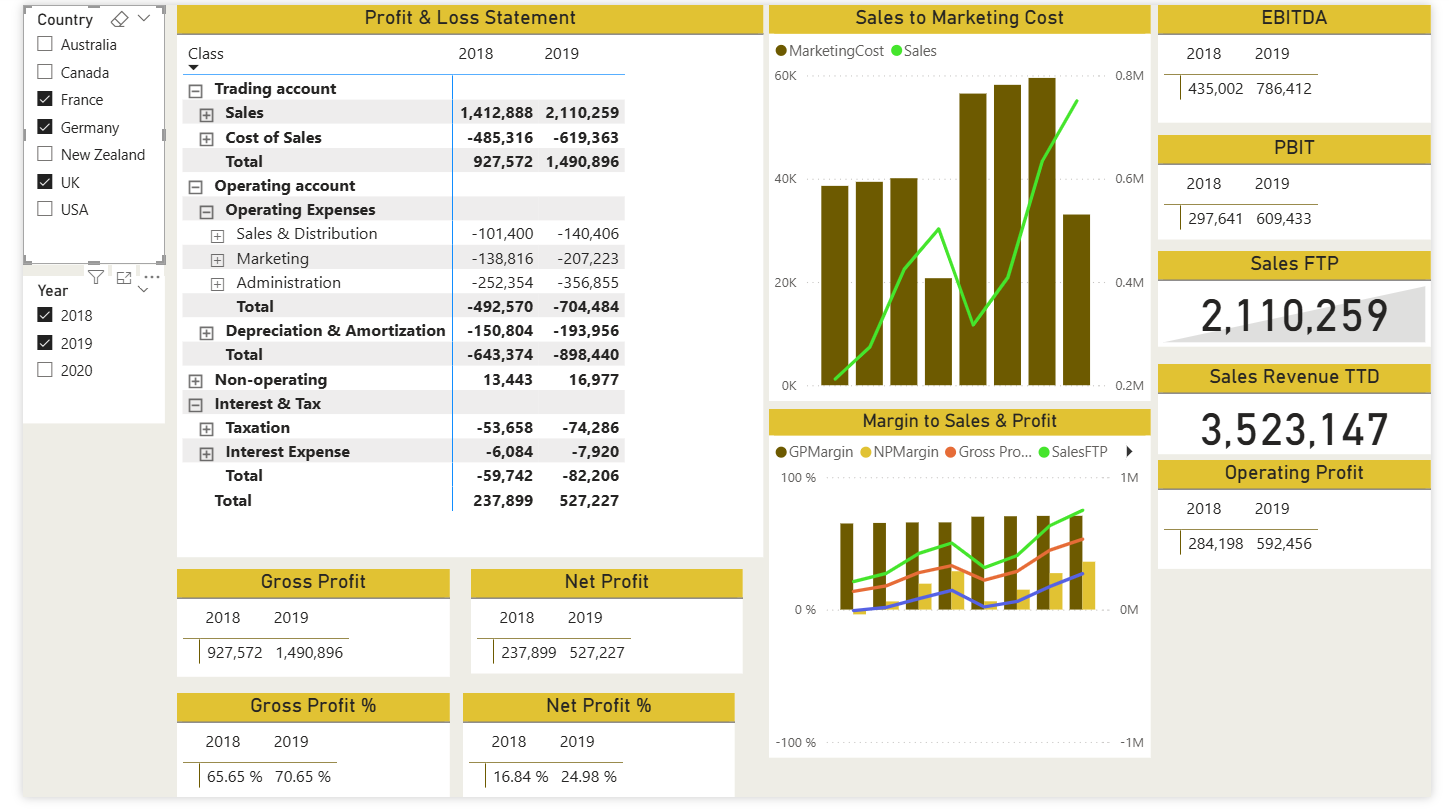
Power BI Profit & Loss Dashboard Template (Free PBIX Download)
If you find this website helpful, share it with friends and colleagues to boost their Power BI skills and work efficiency!
Like this site? Share it