
Power BI Operations & Production Dashboard Examples
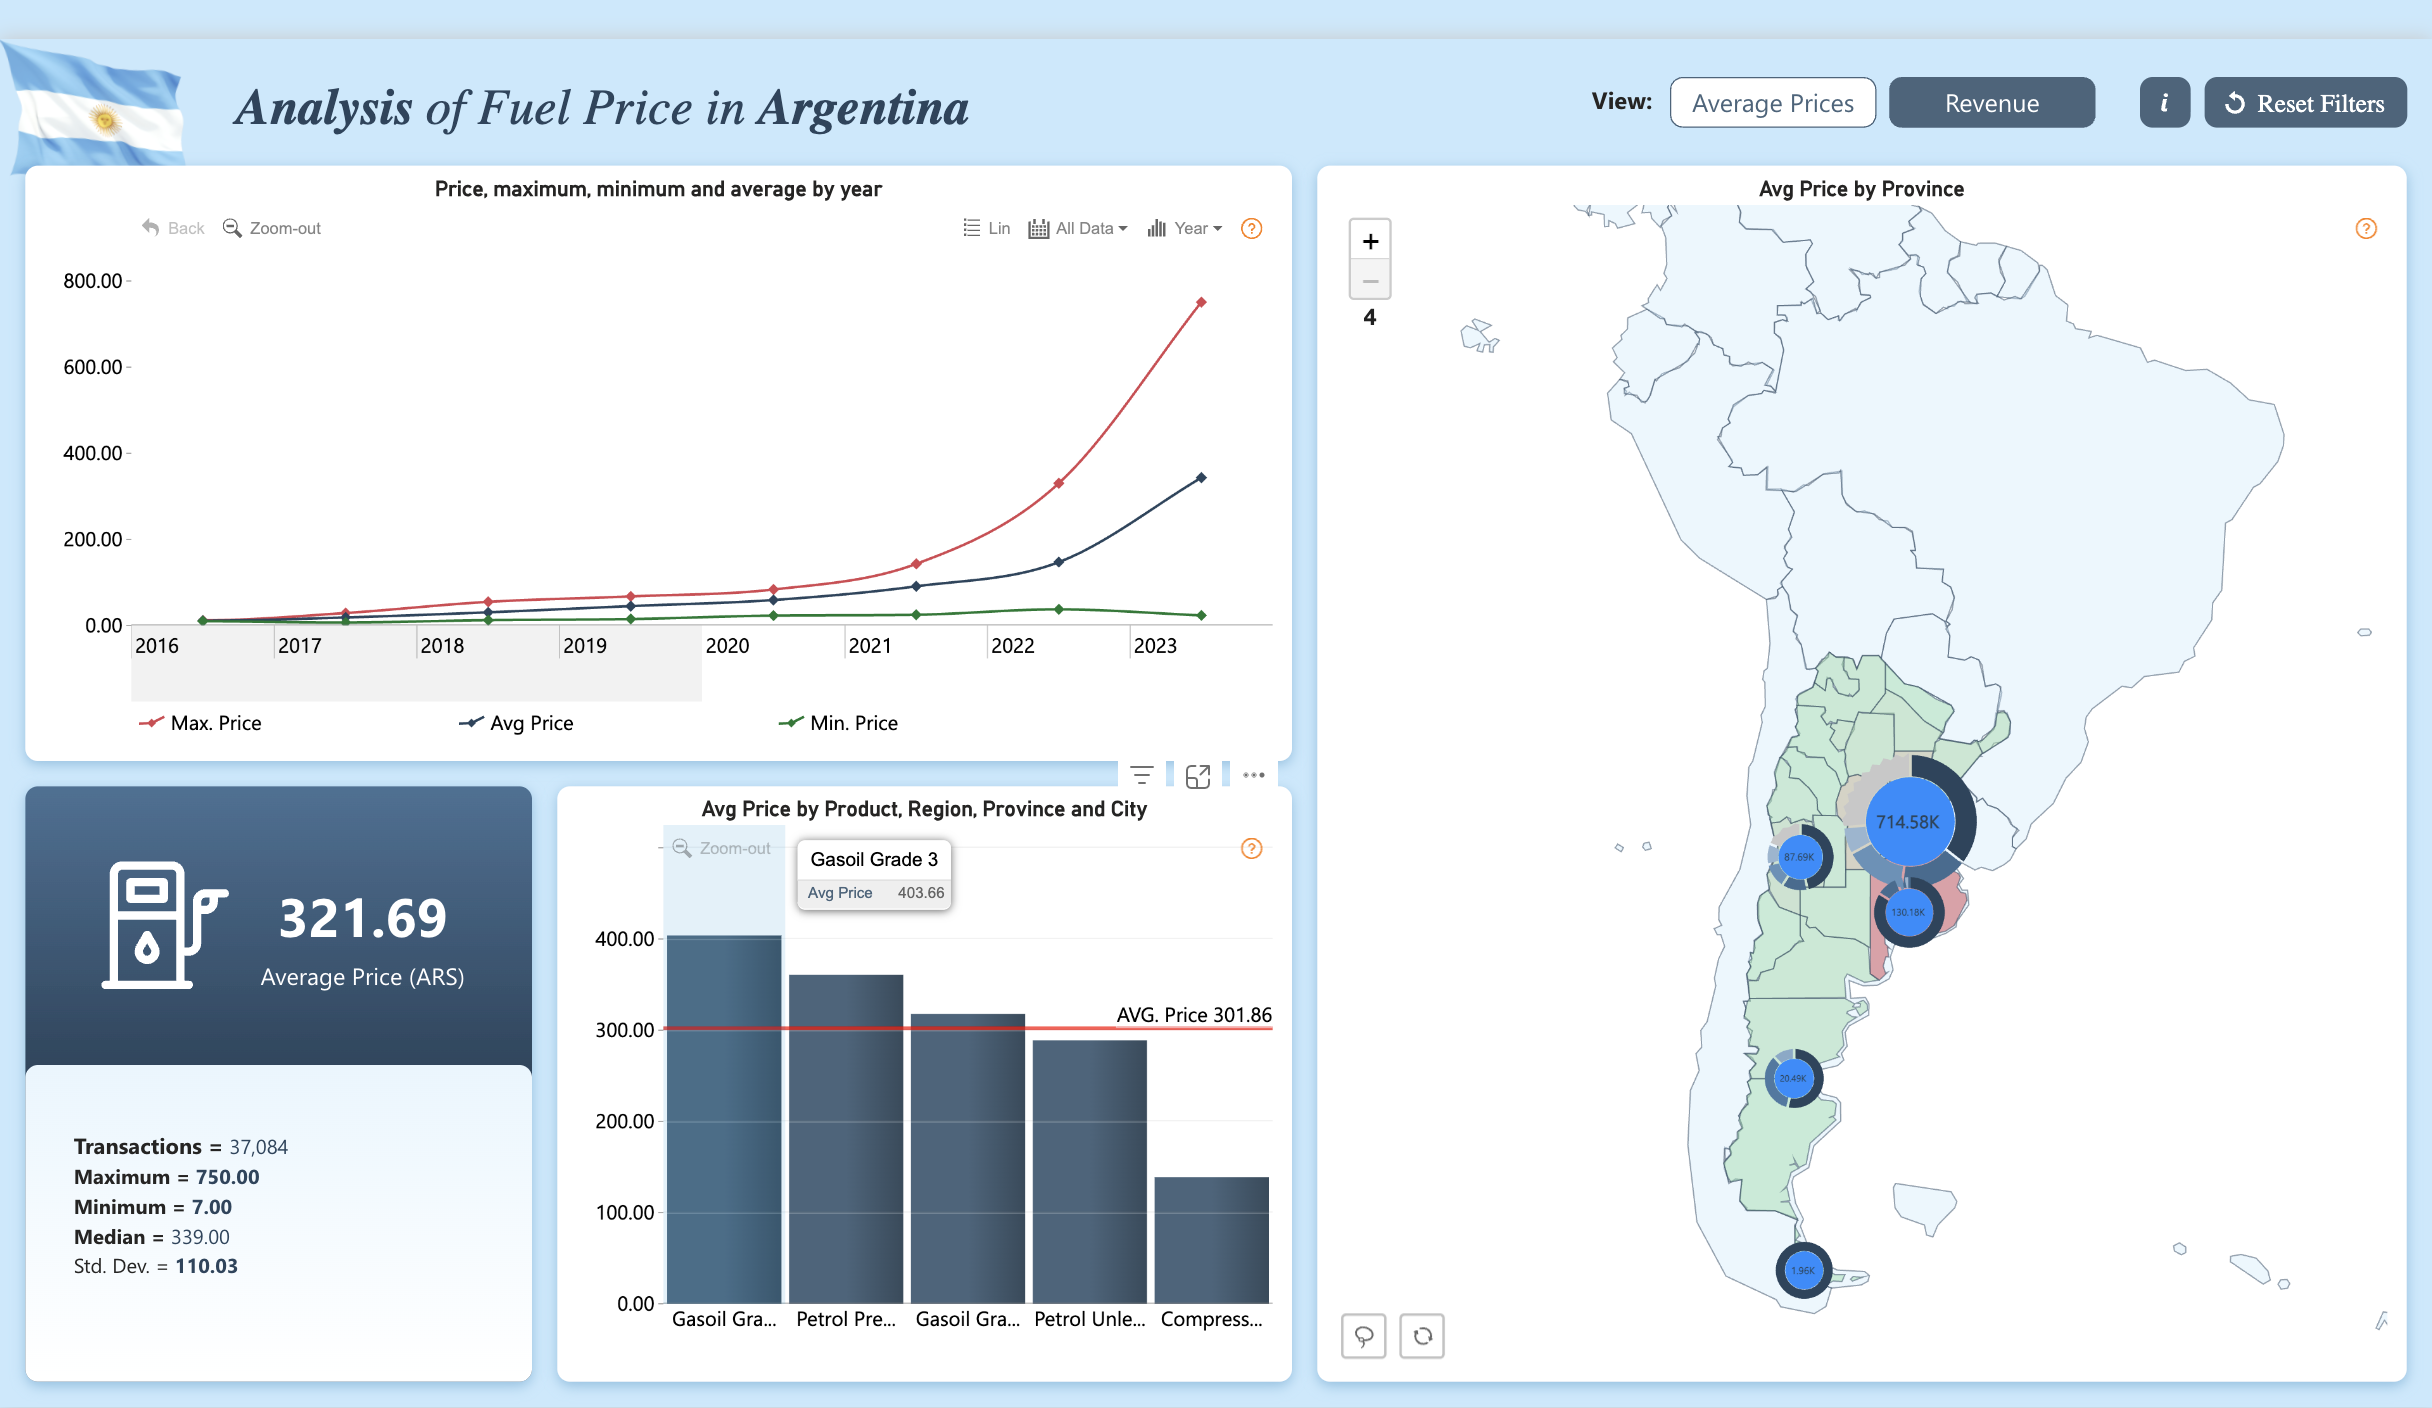
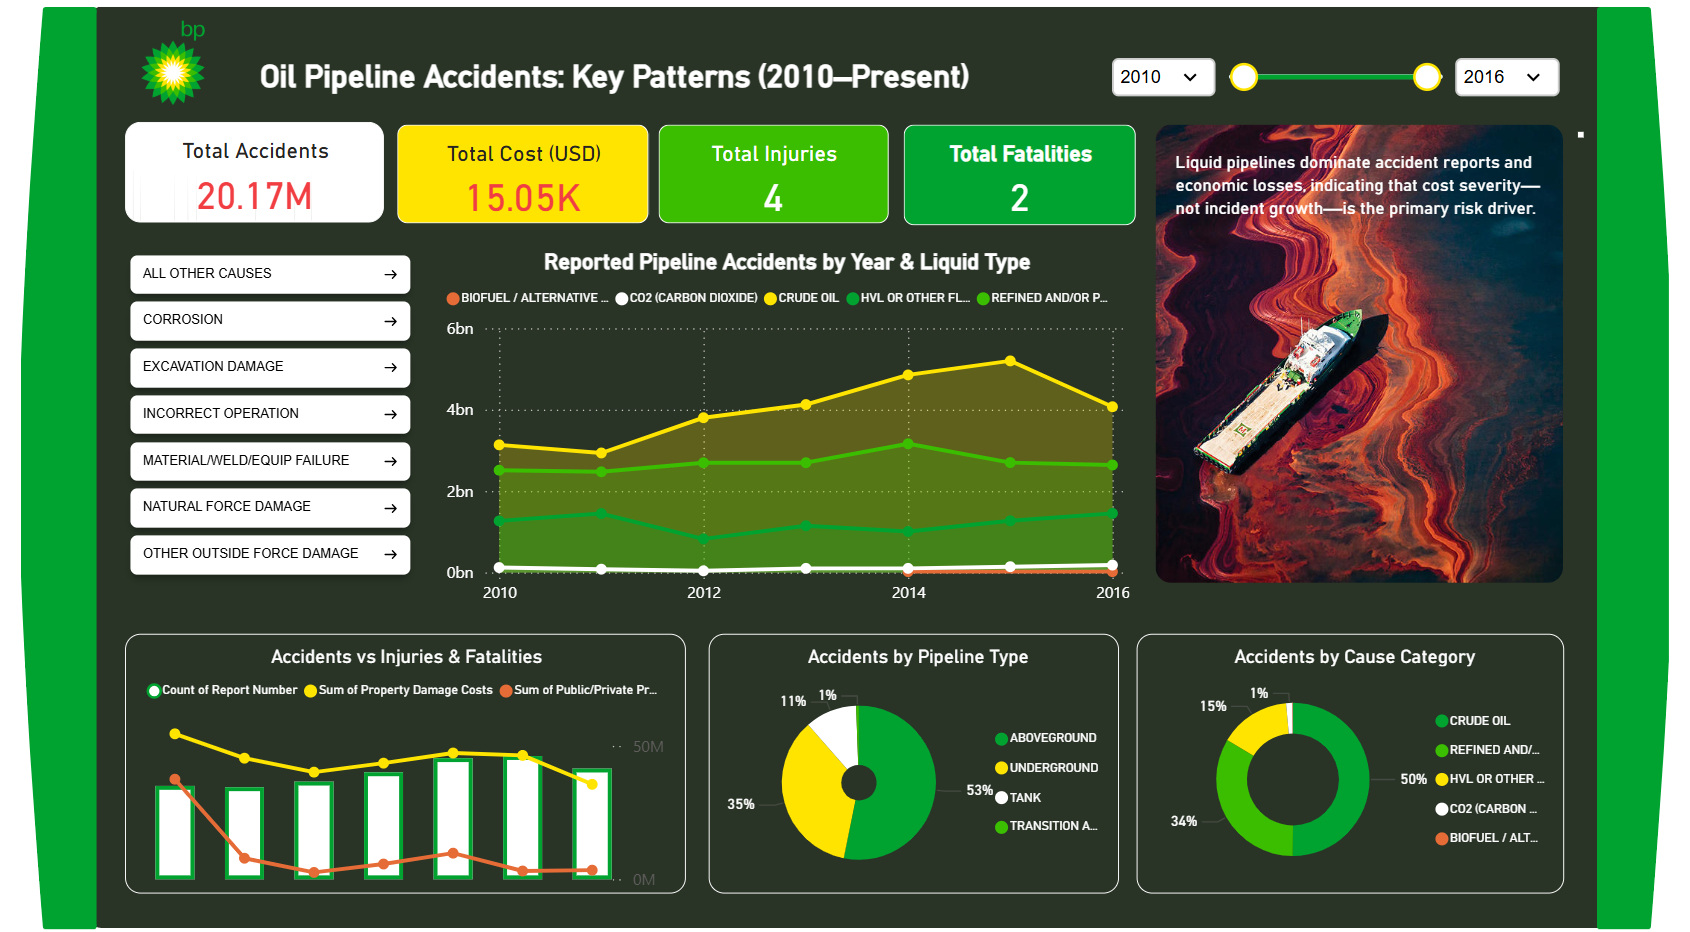
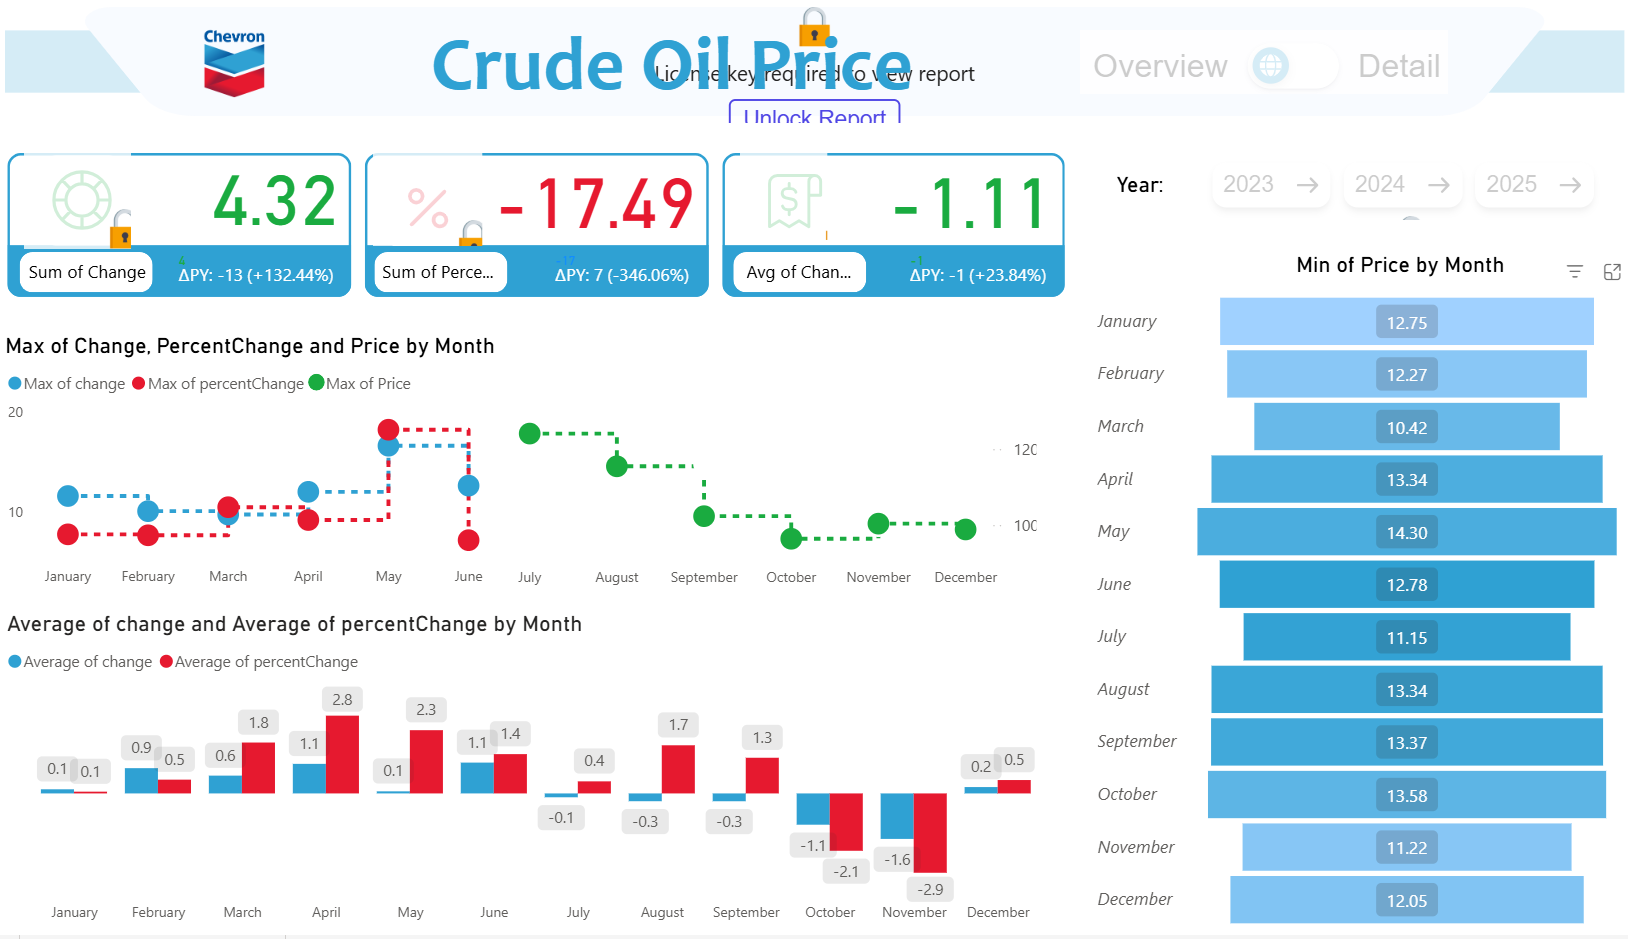
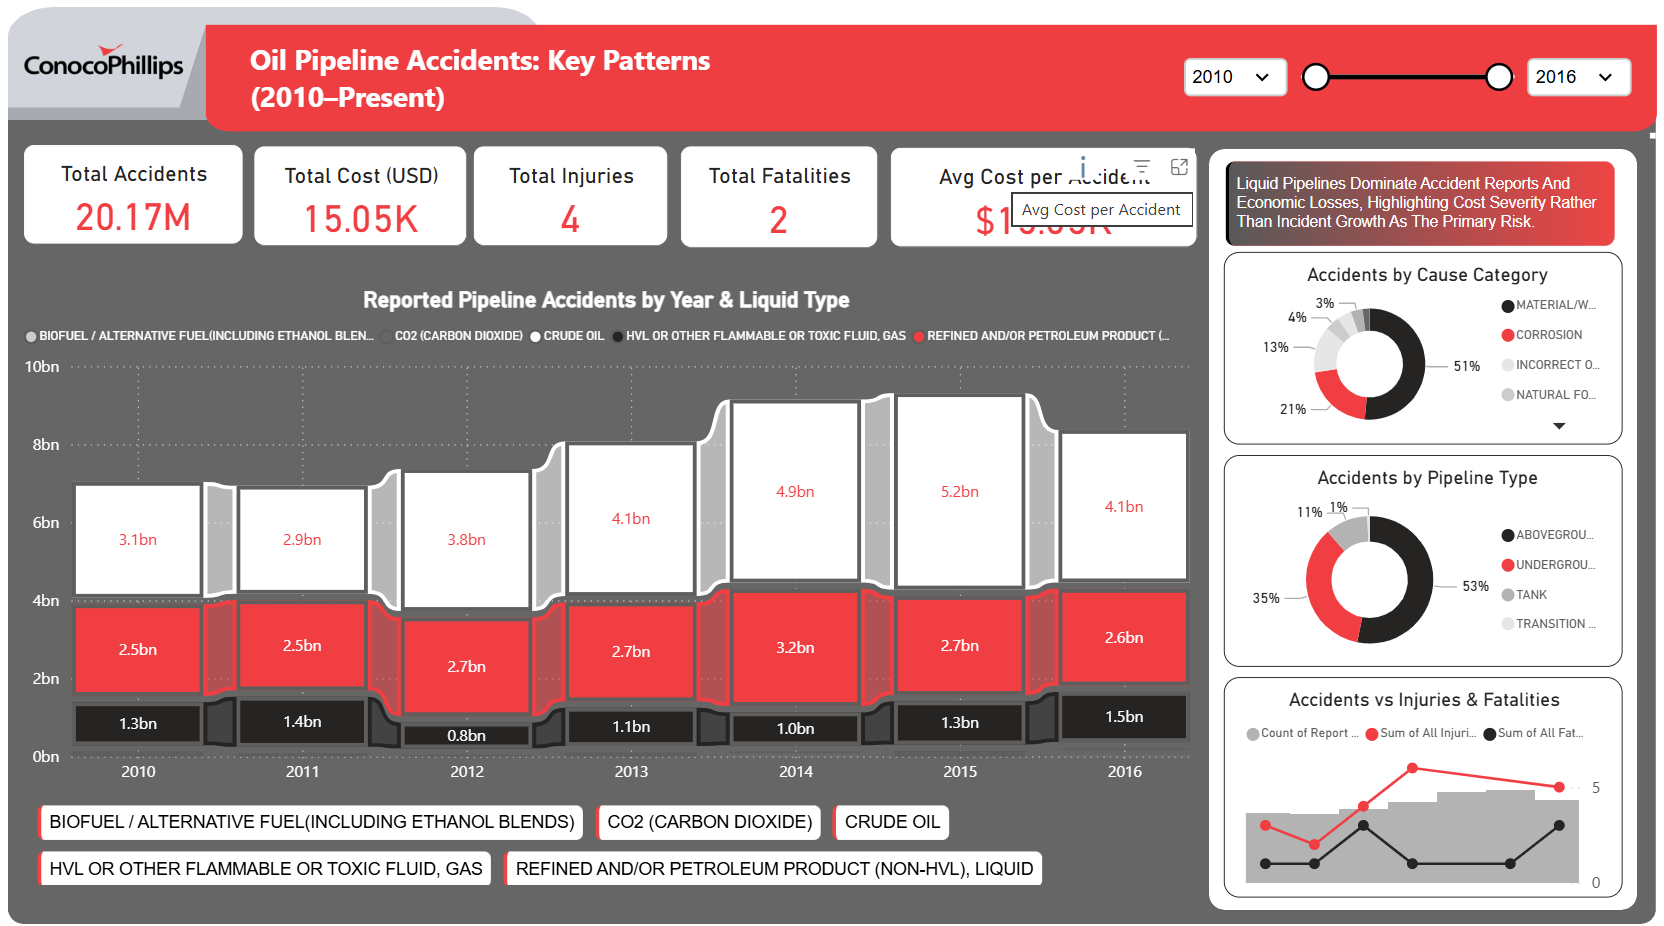
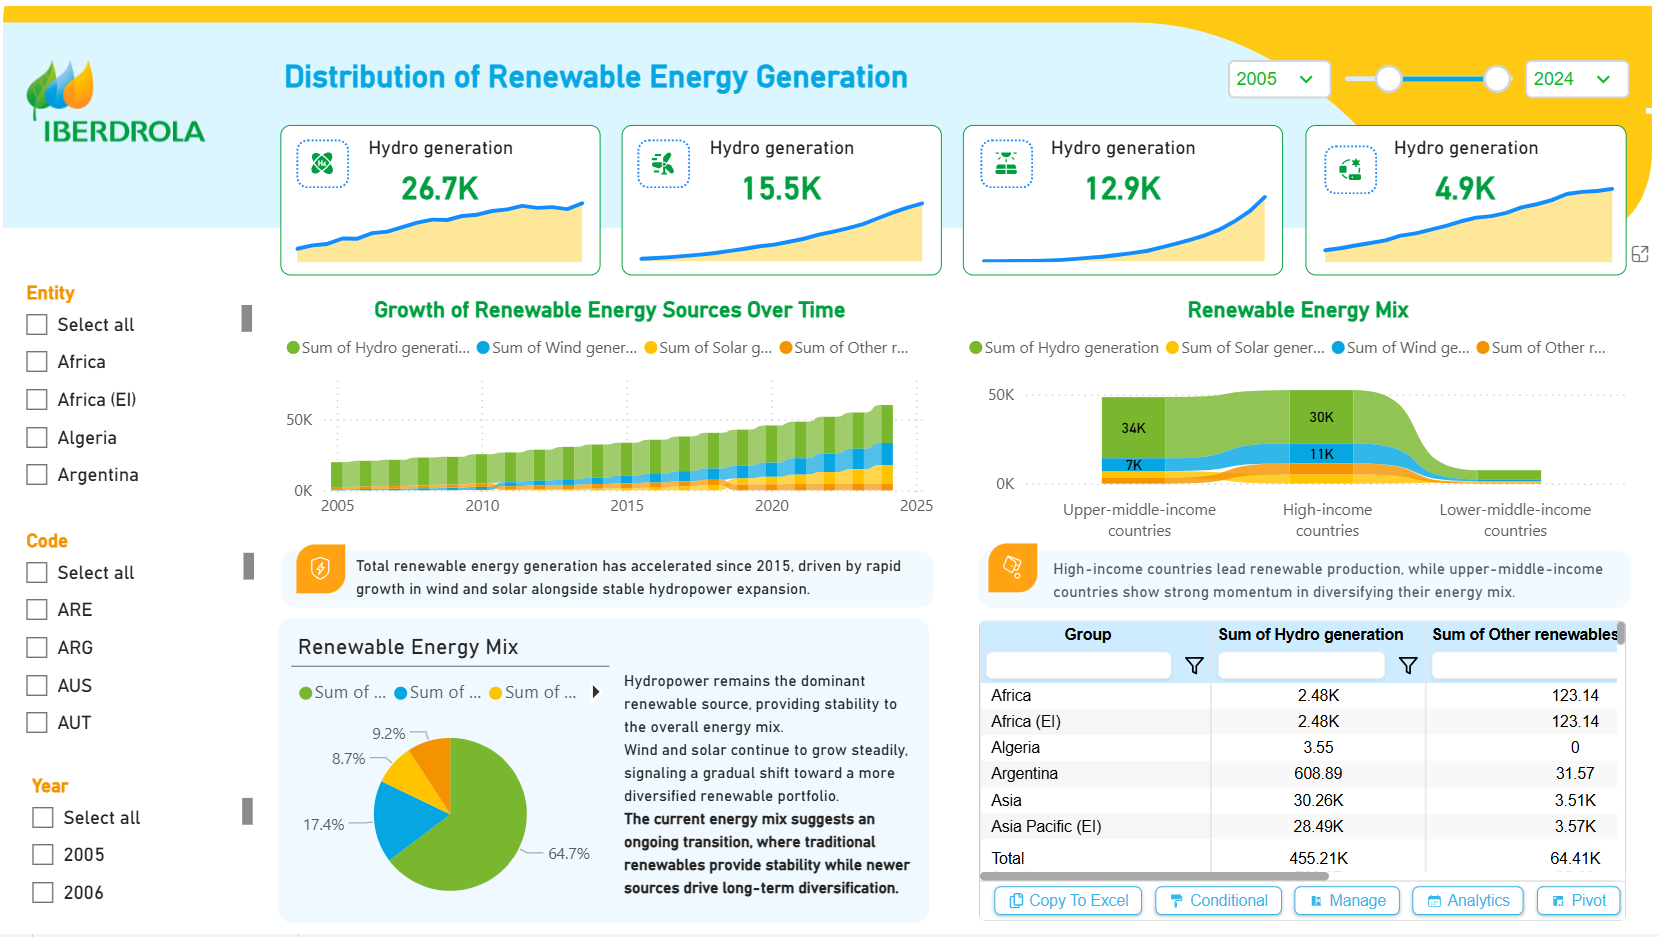
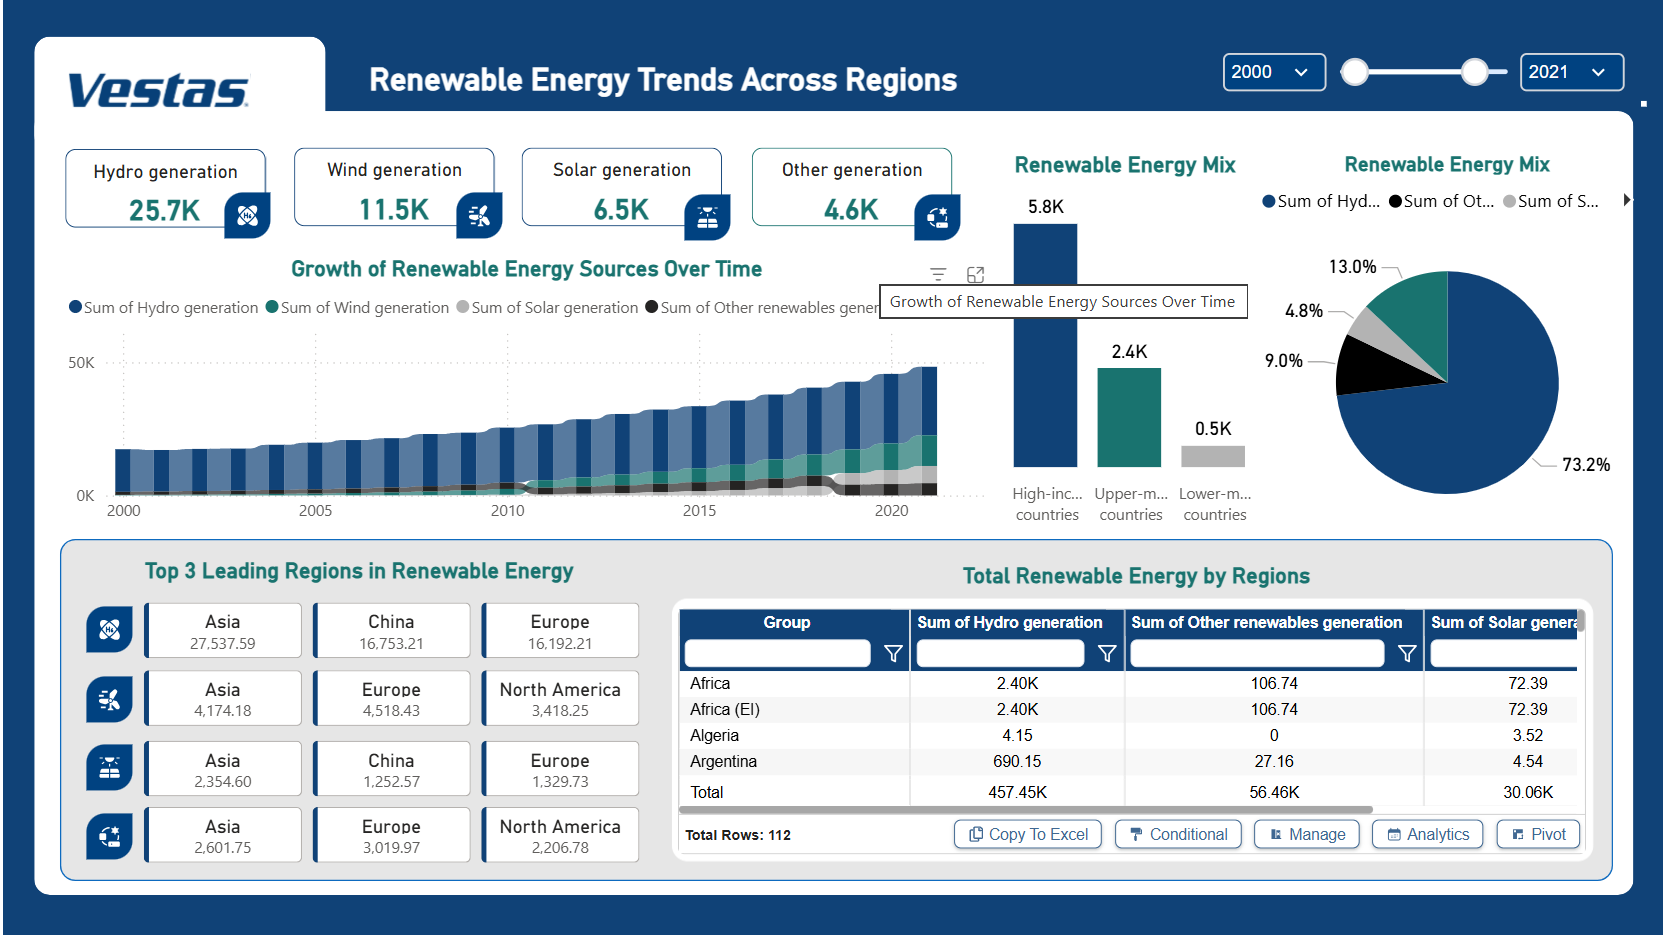
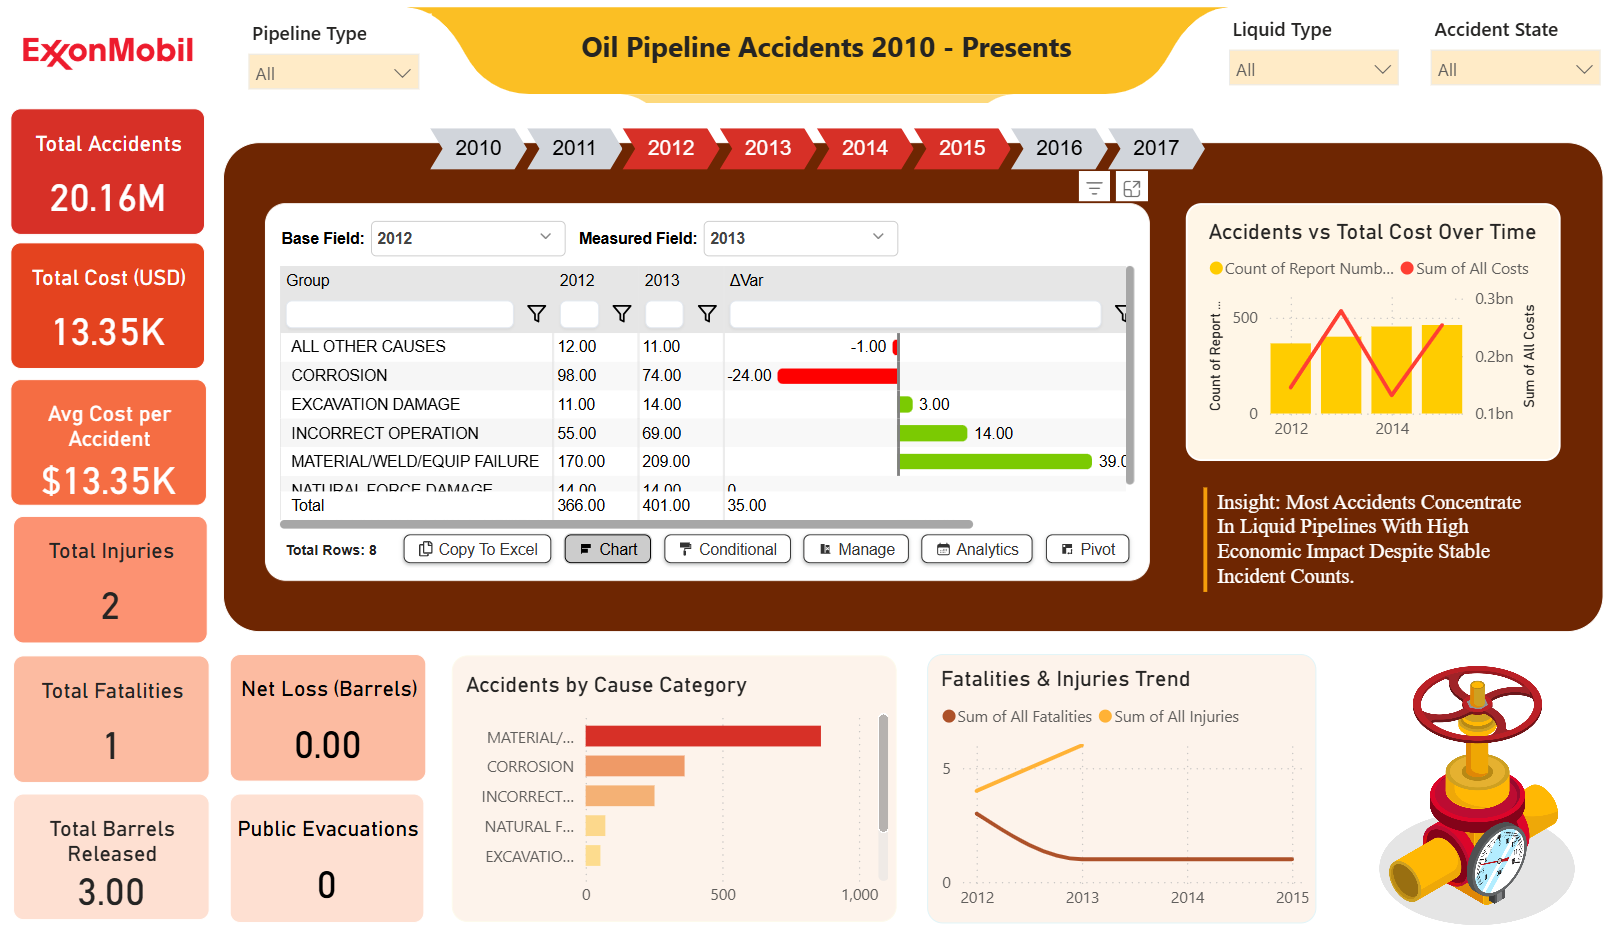
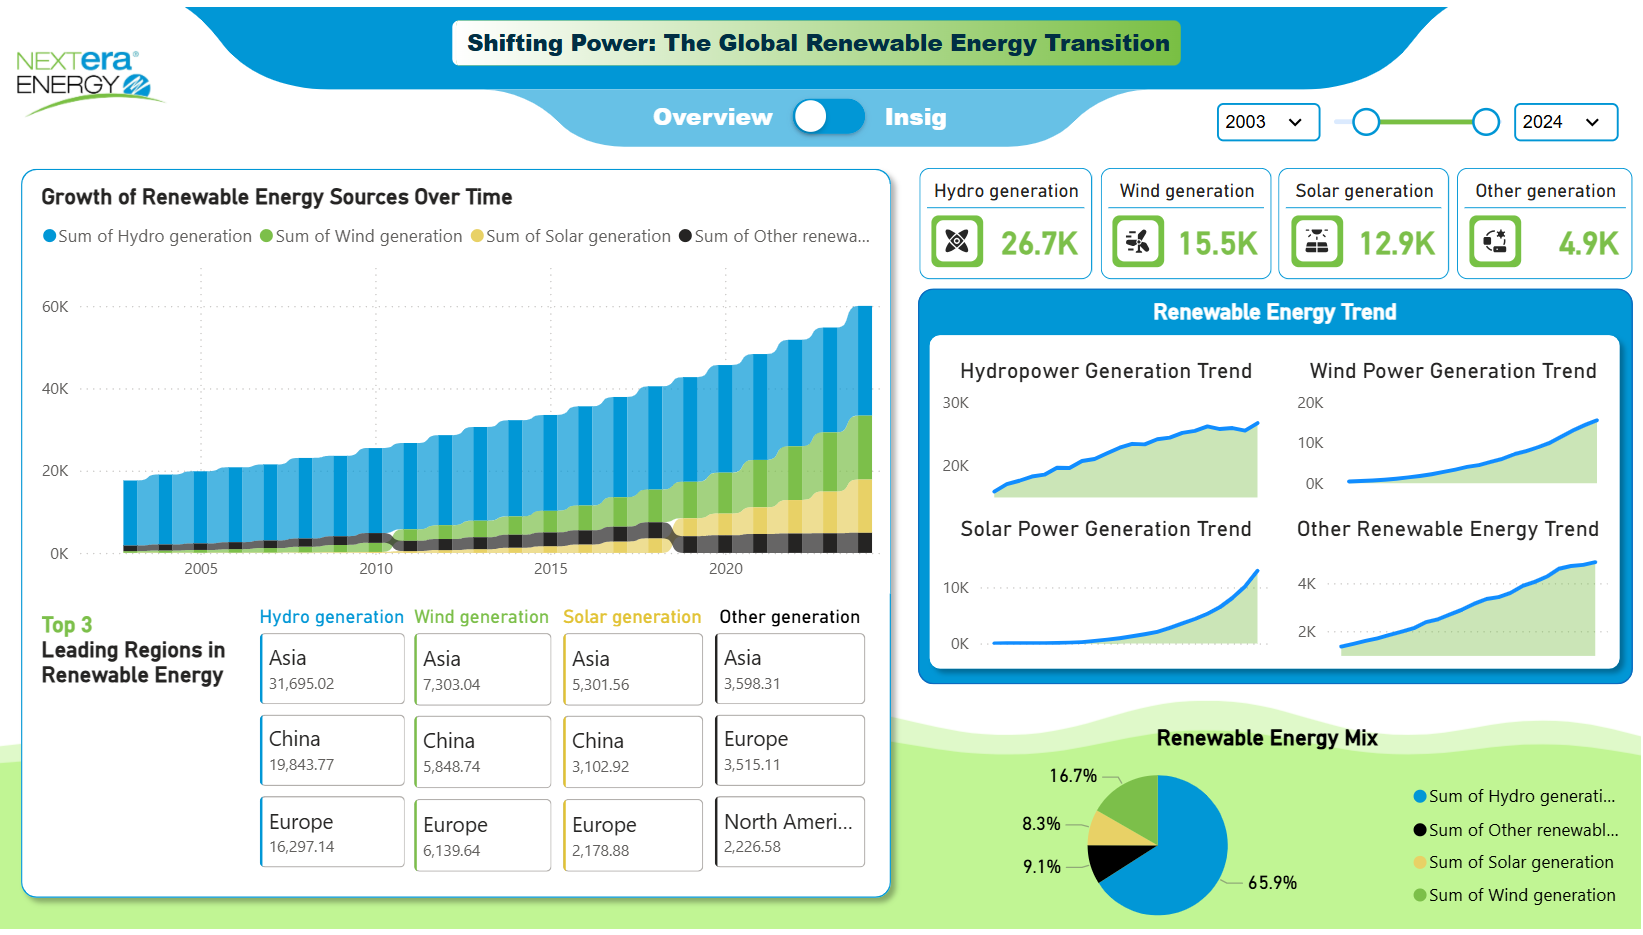
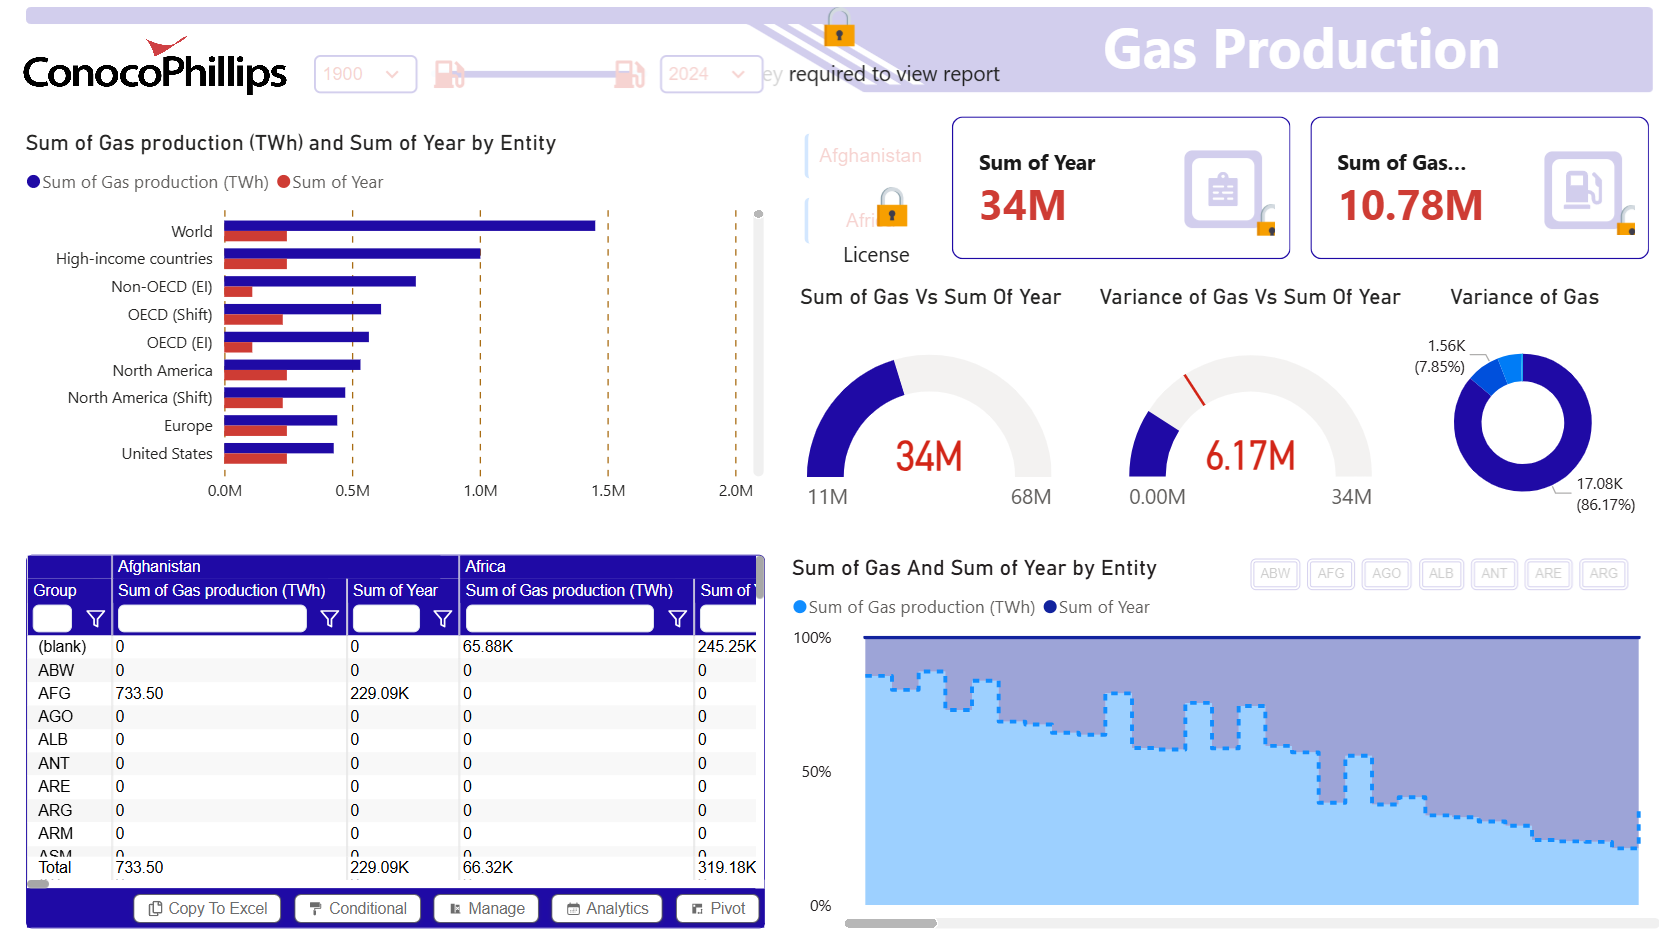
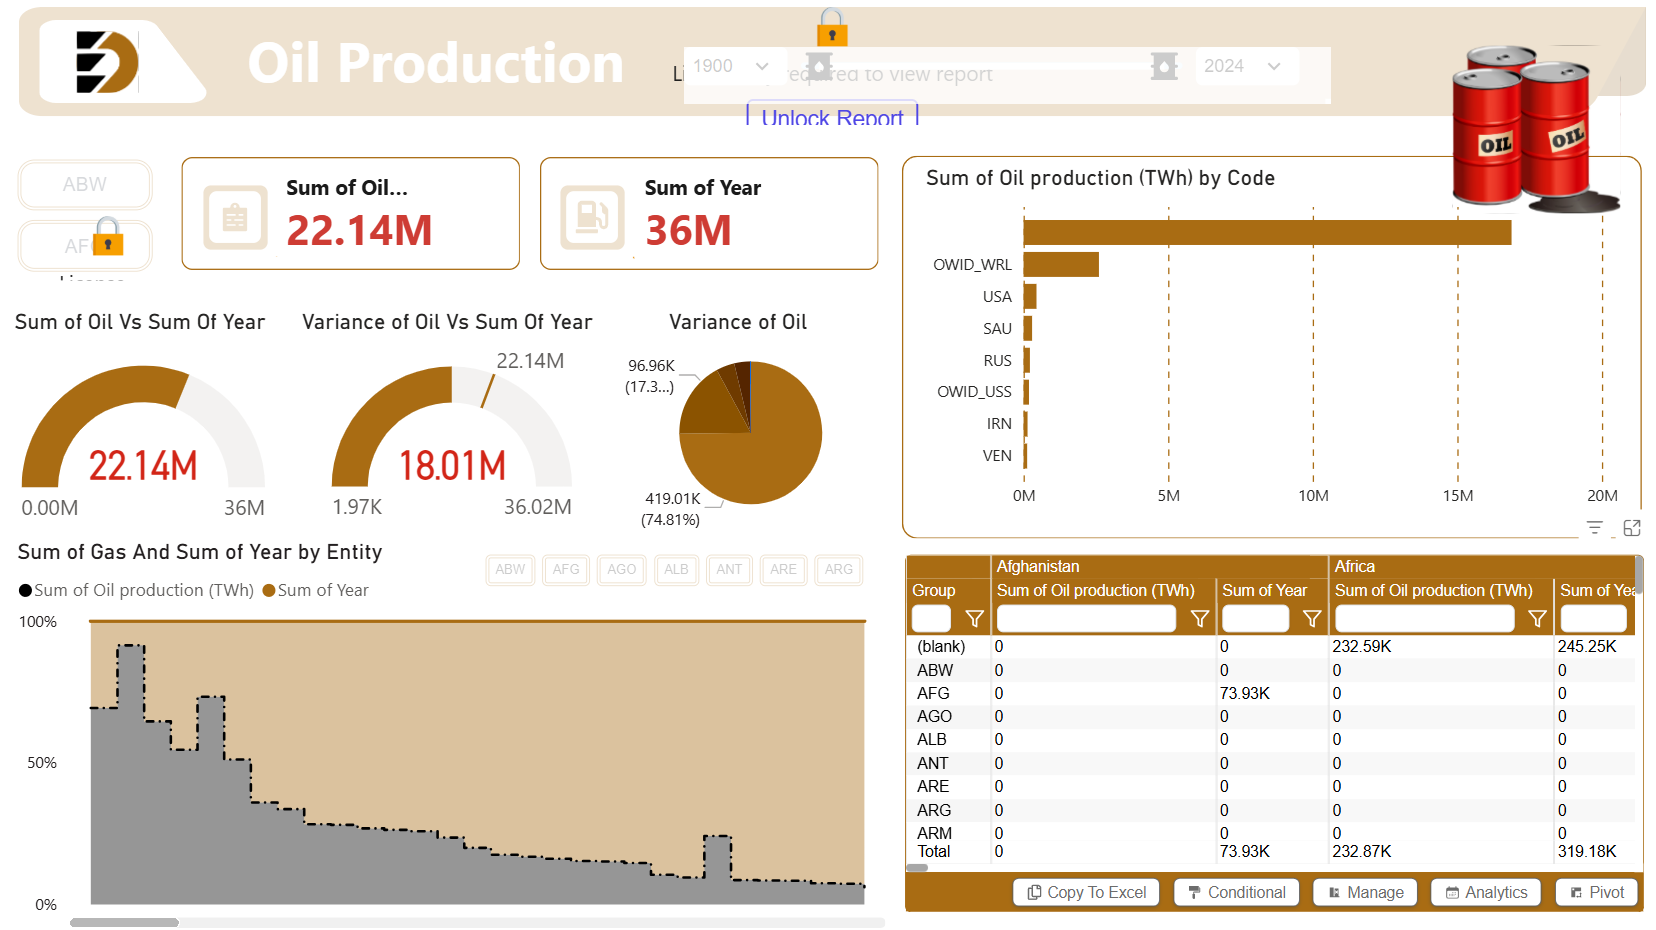
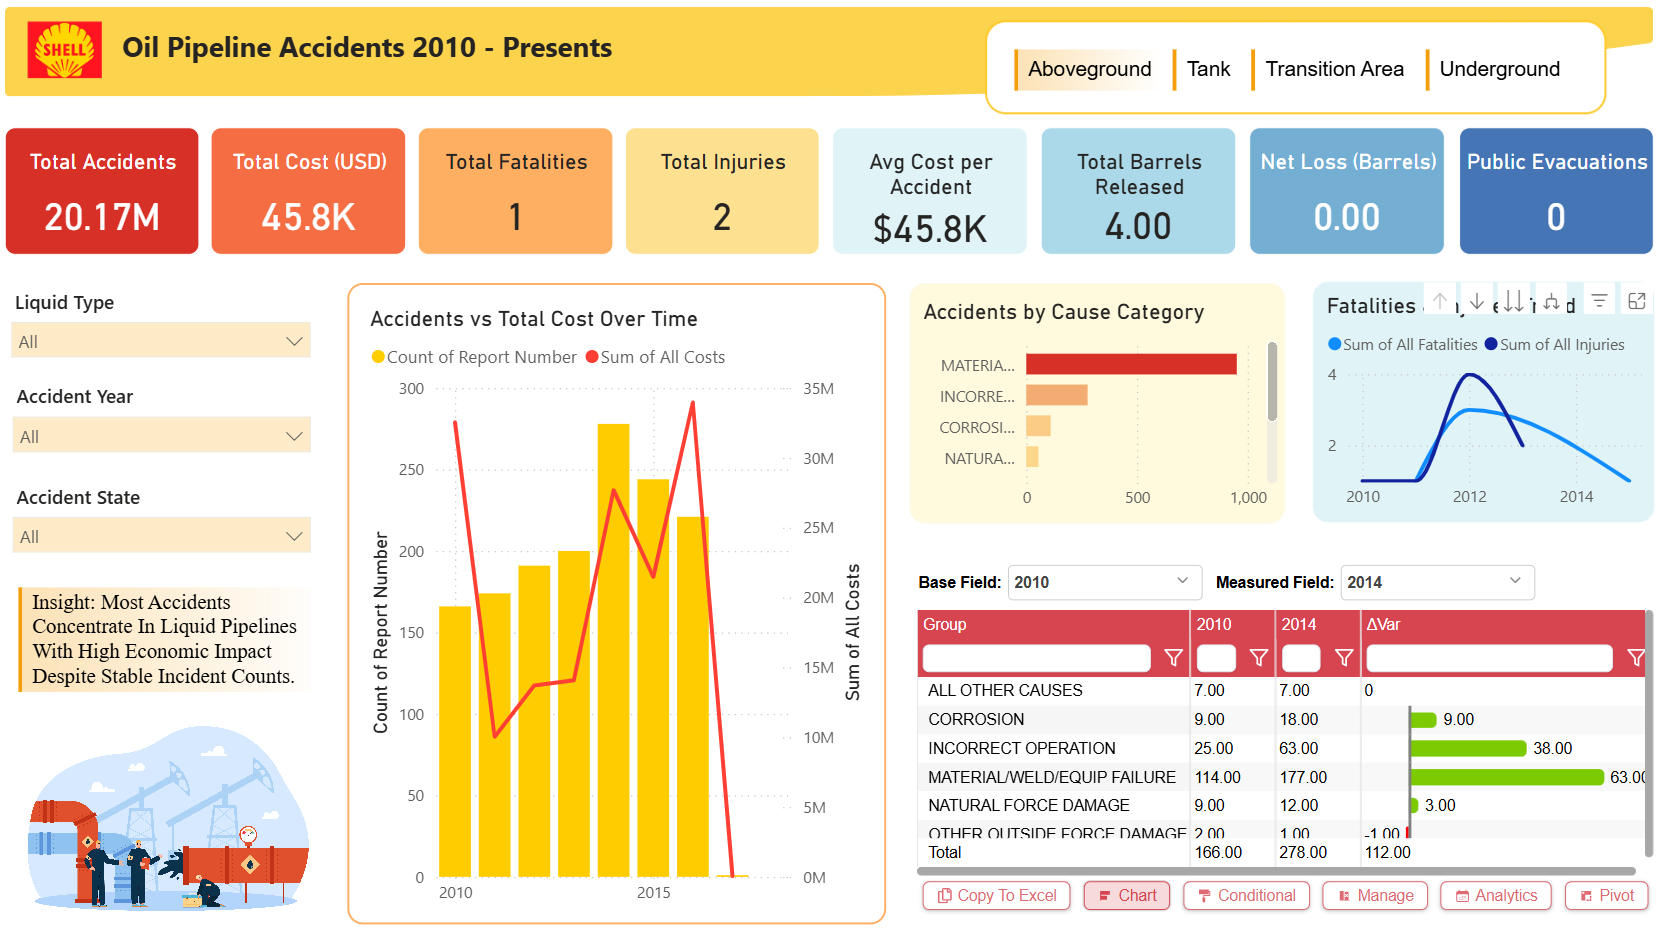
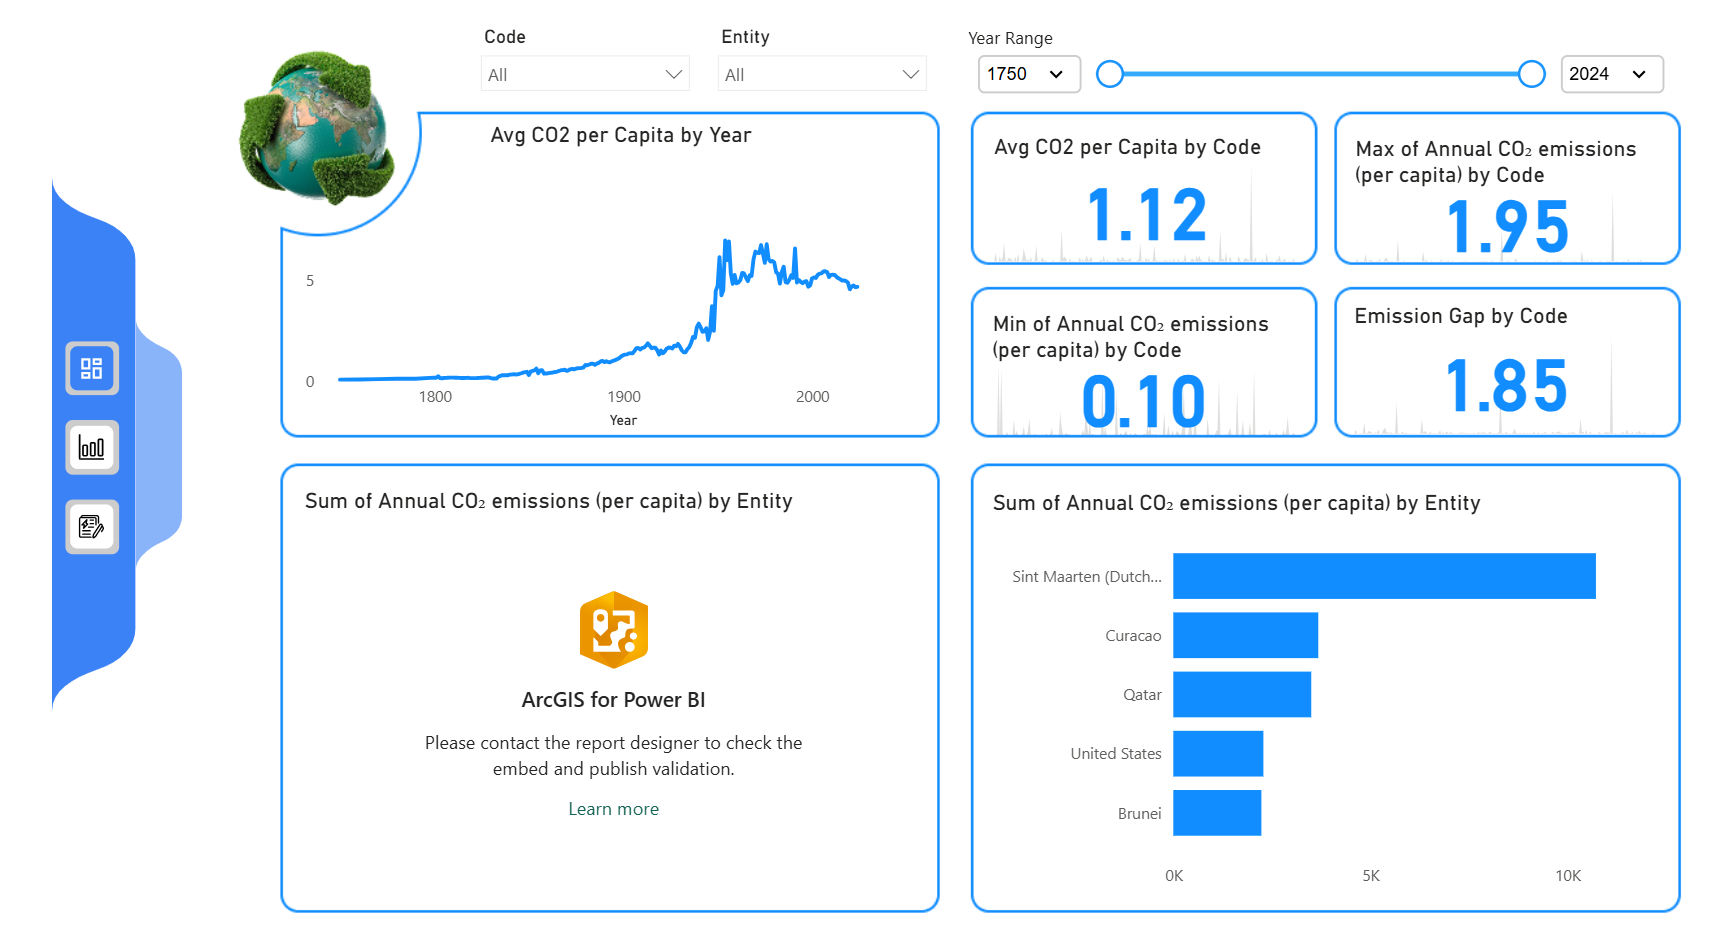
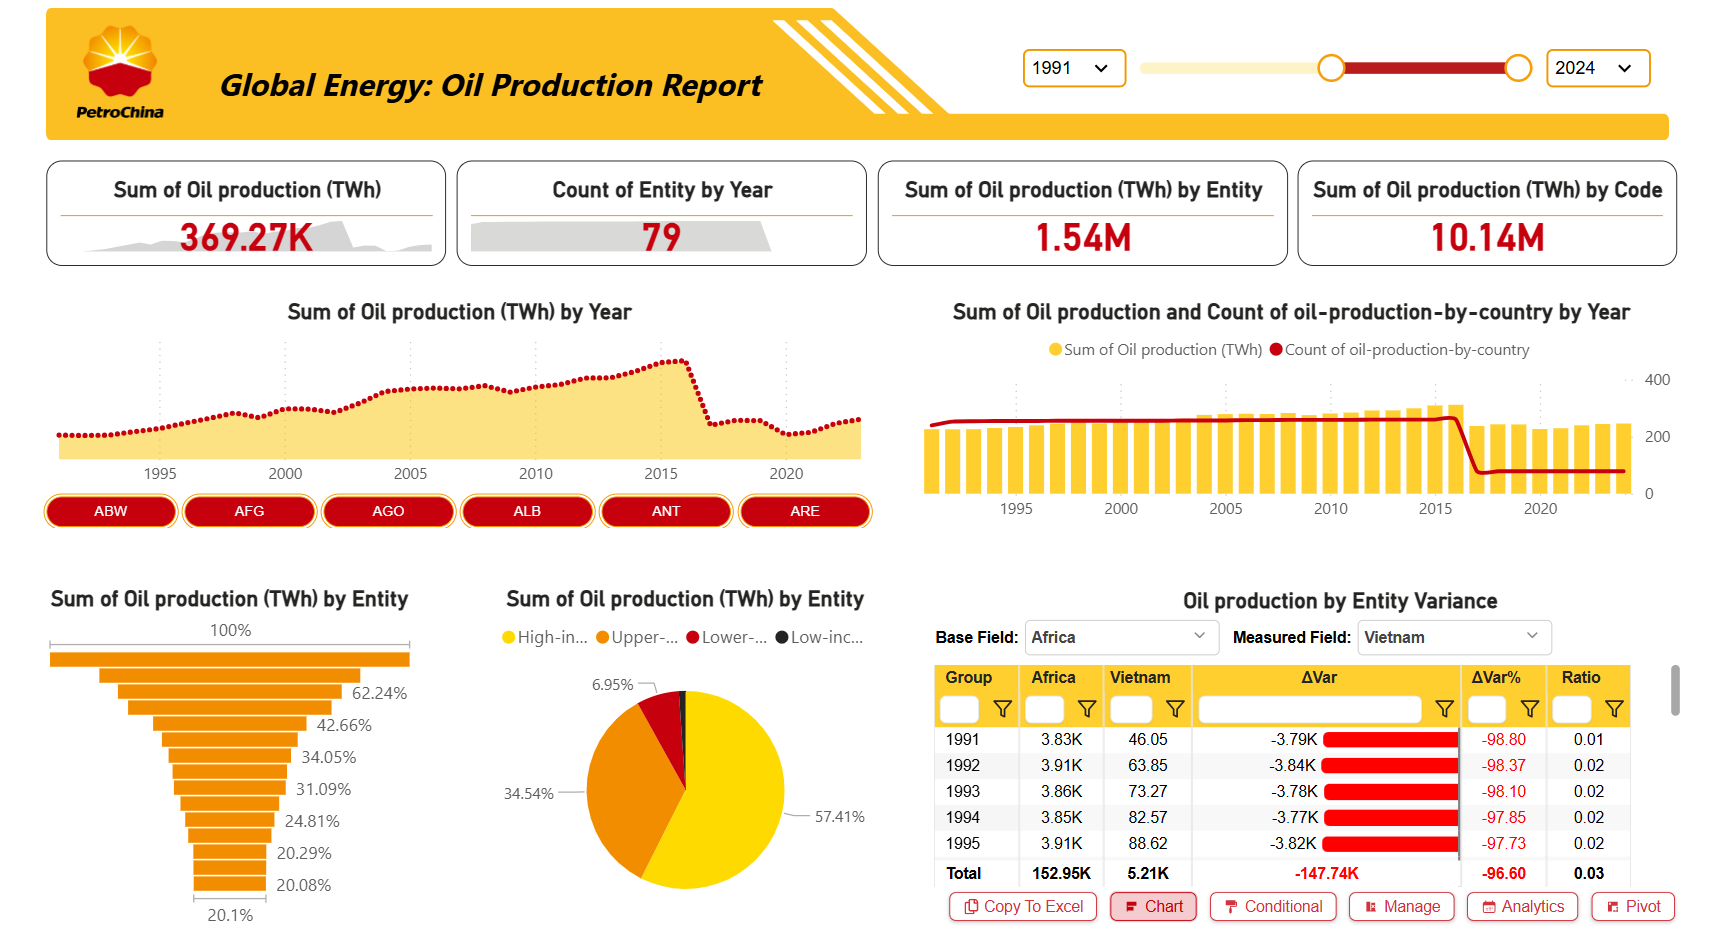
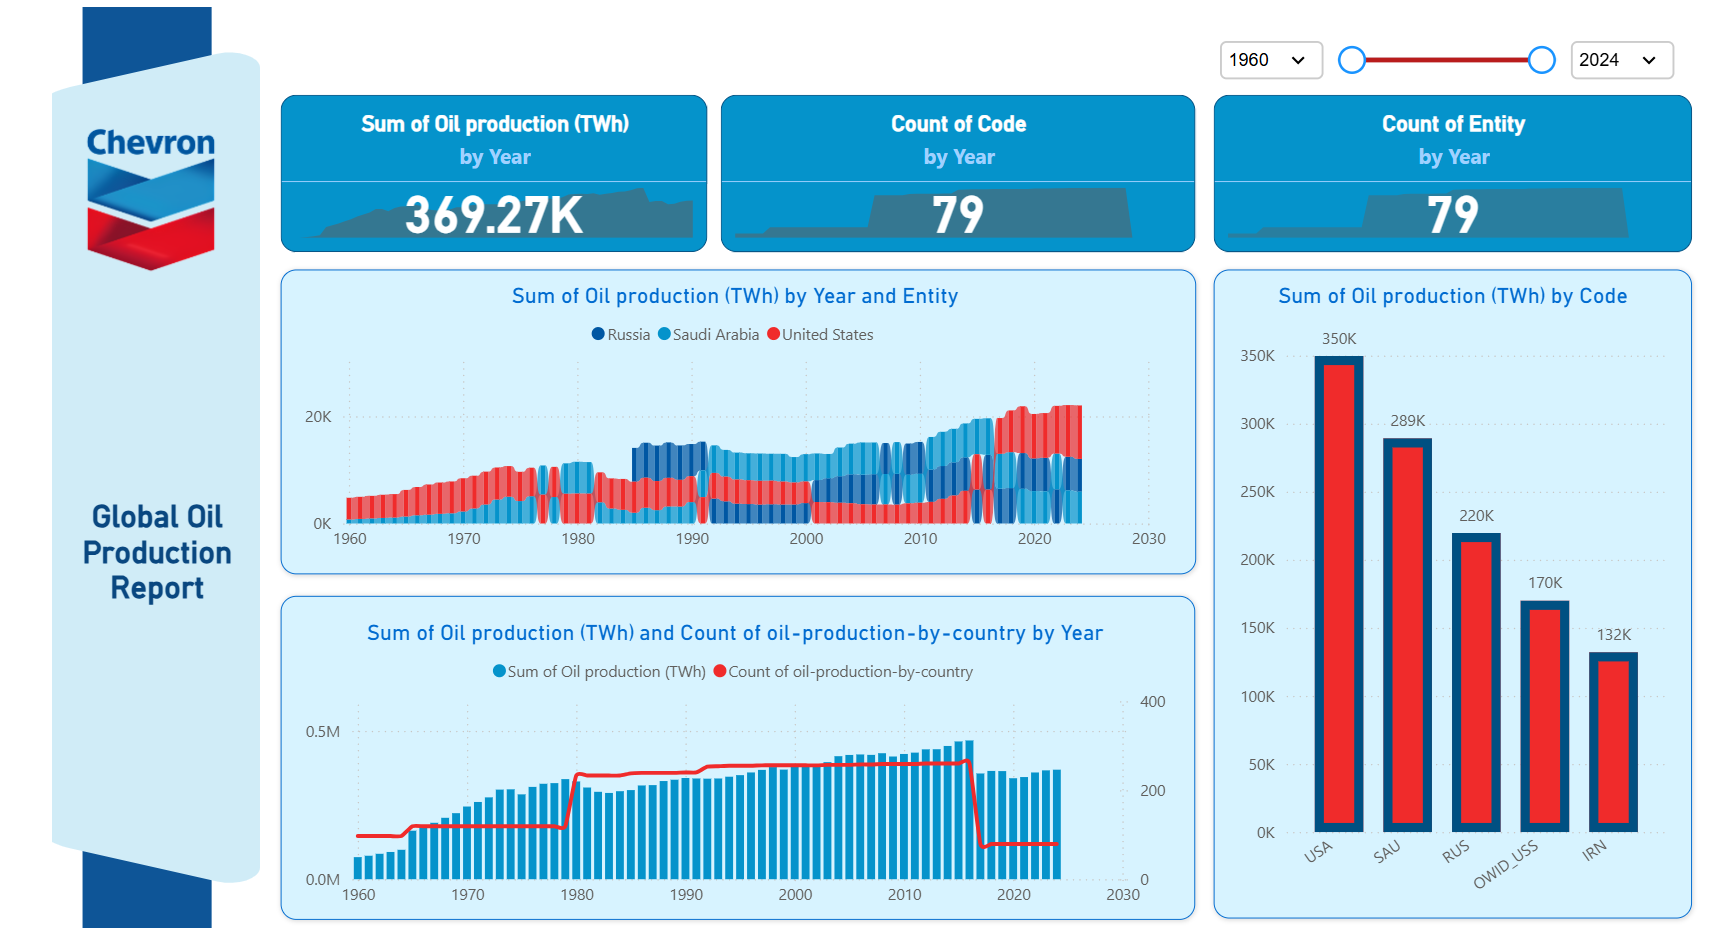
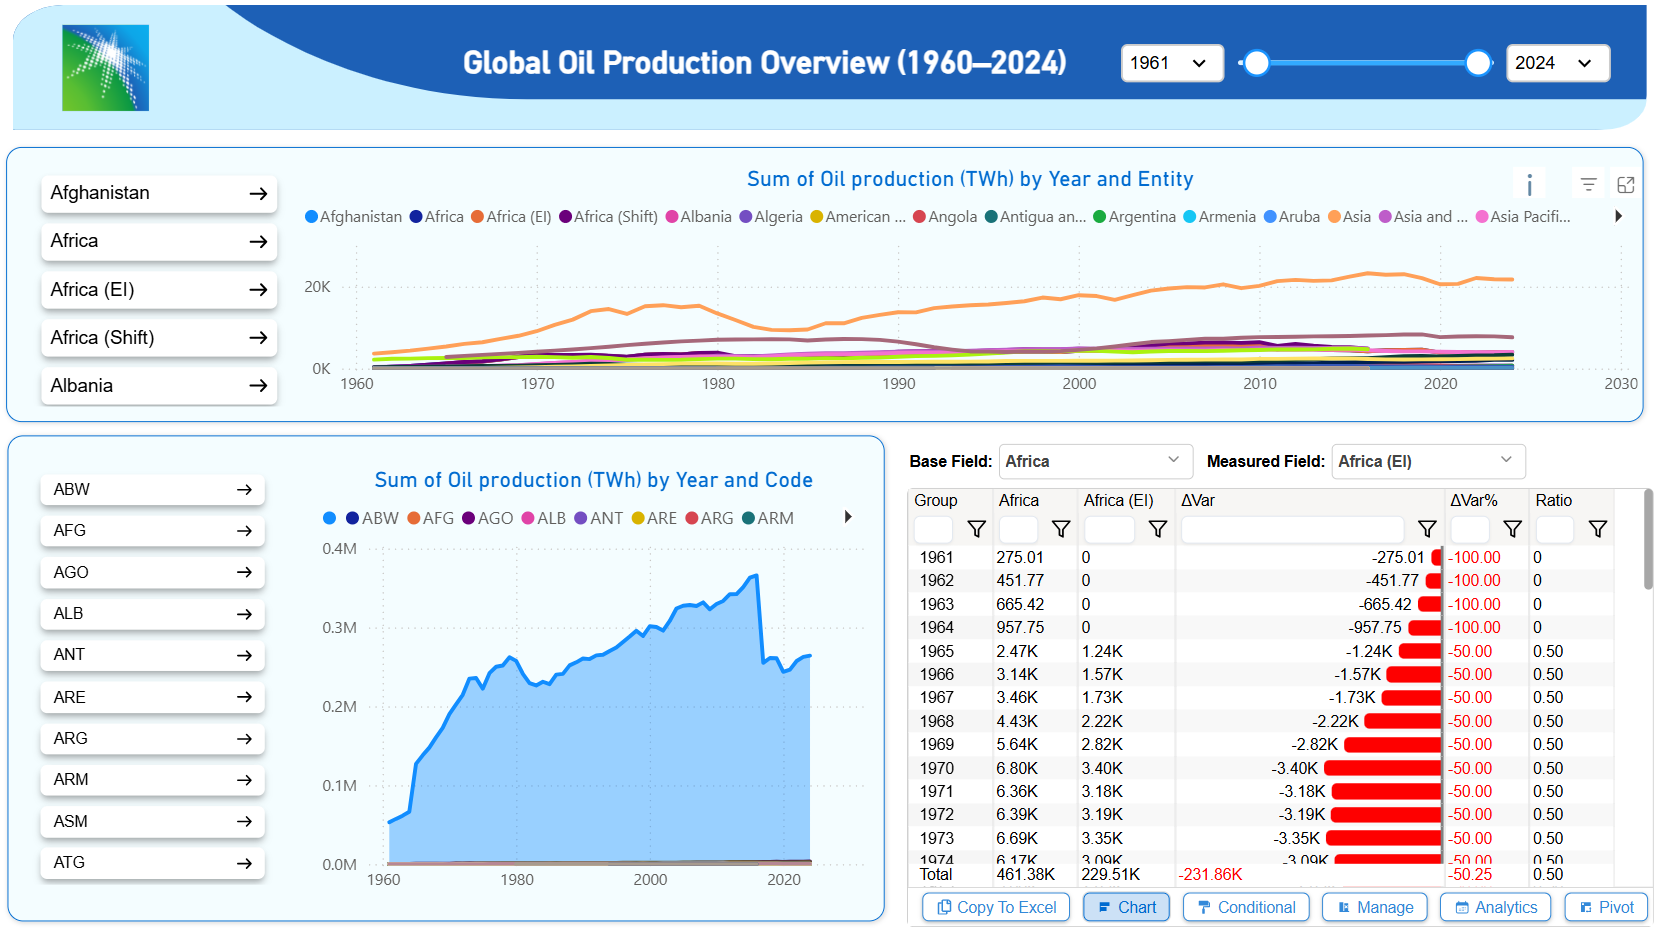
Operations dashboards reward density done well: output against plan, quality rates, downtime causes and resource consumption, visible at a glance and drillable when a number looks wrong. The templates in this category cover production output tracking, quality/defect analysis, and a set of energy-sector dashboards (oil & gas production, emissions, pipeline incidents) built on public datasets.
They double as worked examples of time-series analysis in Power BI over decades-long datasets.
16 templates in Operations & Production
Browse all templates →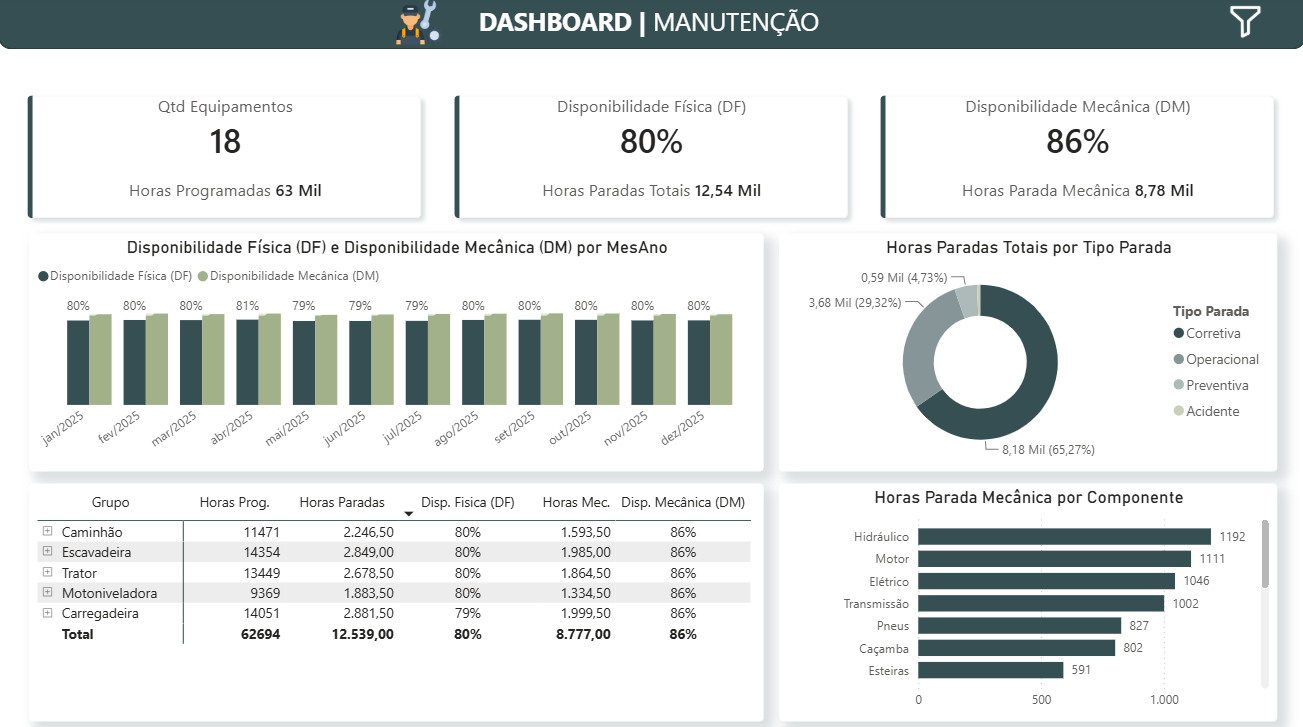
Frequently asked questions
Are the energy dashboards based on real data?
Yes — the oil, gas and emissions templates are built on public historical datasets (cited inside each report), which makes them useful both as analysis and as realistic training material.
Can I use these for OEE / downtime tracking?
The production templates include output-vs-plan and downtime-by-cause views. For full OEE you can extend the model with availability and performance tables — the measure patterns are already there.
How large a dataset can these handle?
The bundled models use import mode and comfortably handle millions of rows; the visuals and measures carry over unchanged if you move the source to DirectQuery.