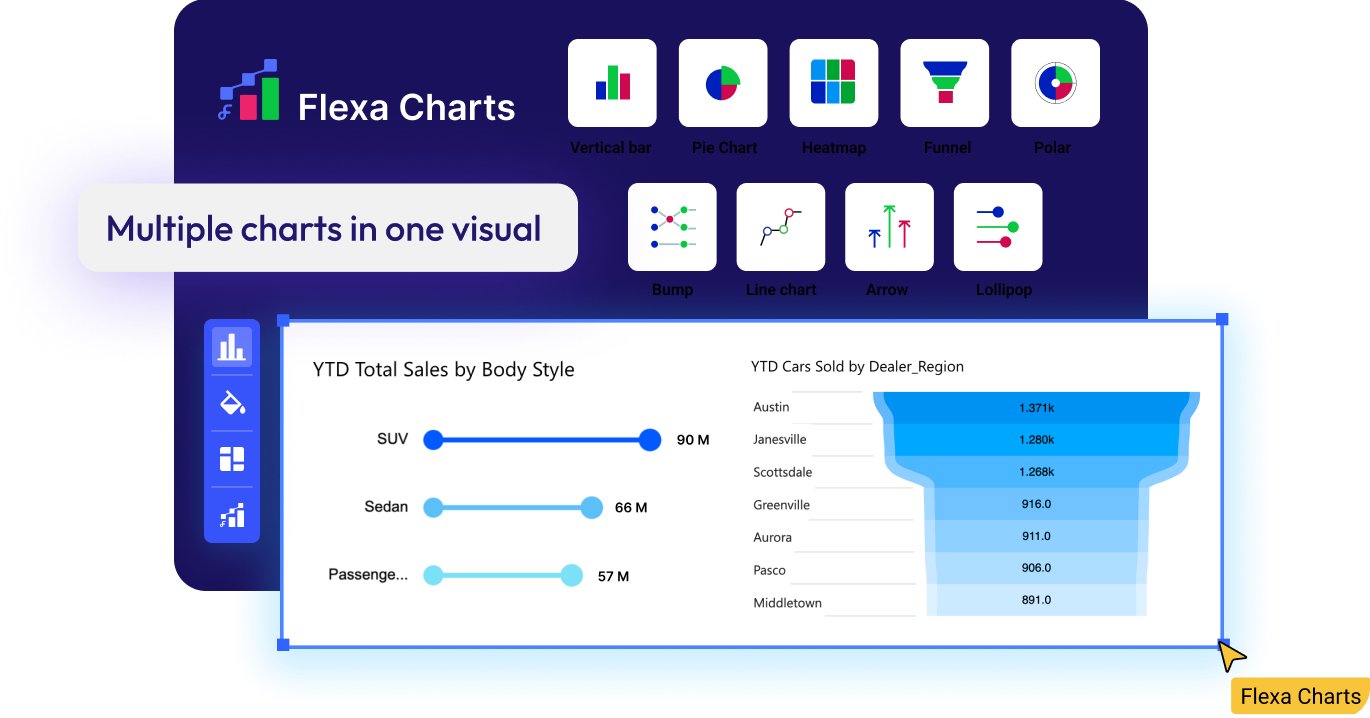
Welcome to Flexa Charts by Flexa Intel
Flexa Charts lets you go beyond default visuals—explore unique chart types, drag and drop data, and fine-tune details to turn raw data into compelling visual stories.
Why Choose Flexa Charts?
'%3e%3cpath%20d='M10%2019.3444V30H20.6556L18.4333%2027.7778H12.2222V21.5666L10%2019.3444Z'%20fill='%232200FD'%20/%3e%3cpath%20d='M38.7445%2035.8778L35.5556%2032.6445V35.5556H4.44447V30.9445H6.66669V29.1667H4.44447V21.7778H6.66669V20H4.44447V12.8889H6.66669V11.1111H4.44447V4.90003L22.1556%2022.5111V19.3778L4.12225%201.43336C3.96684%201.27666%203.76828%201.16979%203.55189%201.12638C3.33551%201.08297%203.1111%201.10498%202.90727%201.18961C2.70344%201.27424%202.52944%201.41766%202.40743%201.60157C2.28543%201.78548%202.22096%202.00155%202.22225%202.22225V36.6667C2.22225%2036.9614%202.33931%2037.244%202.54768%2037.4524C2.75606%2037.6607%203.03867%2037.7778%203.33336%2037.7778H37.9556C38.1763%2037.7791%2038.3923%2037.7146%2038.5763%2037.5926C38.7602%2037.4706%2038.9036%2037.2966%2038.9882%2037.0928C39.0728%2036.889%2039.0949%2036.6645%2039.0514%2036.4482C39.008%2036.2318%2038.9012%2036.0332%2038.7445%2035.8778Z'%20fill='%232200FD'%20/%3e%3cpath%20d='M26.6667%2033.3333H31.1111C31.7005%2033.3333%2032.2657%2033.0992%2032.6825%2032.6825C33.0992%2032.2657%2033.3333%2031.7005%2033.3333%2031.1111V9.66667L30.7778%204.96667C30.5801%204.62425%2030.2947%204.34076%2029.951%204.14544C29.6072%203.95013%2029.2176%203.85006%2028.8222%203.85556C28.418%203.85877%2028.0222%203.97221%2027.6776%204.18366C27.333%204.39512%2027.0526%204.69657%2026.8667%205.05556L24.4445%209.6889V31.1111C24.4445%2031.7005%2024.6786%2032.2657%2025.0953%2032.6825C25.5121%2033.0992%2026.0773%2033.3333%2026.6667%2033.3333ZM26.6667%2010.2222L28.8222%206.03334L31.1111%2010.2333V26.6667H26.6667V10.2222ZM26.6667%2028.4778H31.1111V31.1889H26.6667V28.4778Z'%20fill='%232200FD'%20/%3e%3c/g%3e%3cdefs%3e%3cclipPath%20id='clip0_100_435'%3e%3crect%20width='40'%20height='40'%20fill='white'%20/%3e%3c/clipPath%3e%3c/defs%3e%3c/svg%3e)
Design Charts Your Way
Pick your chart type, fine-tune every detail, and make it yours — all without leaving Power BI.

No-Code, Full Control
Tweak colors, labels, axes, and layout in seconds— all with a friendly, no-code interface.

Responsive & Dynamic
Your visuals adapt instantly to filters, slicers, and screen sizes — always clear, always sleek.
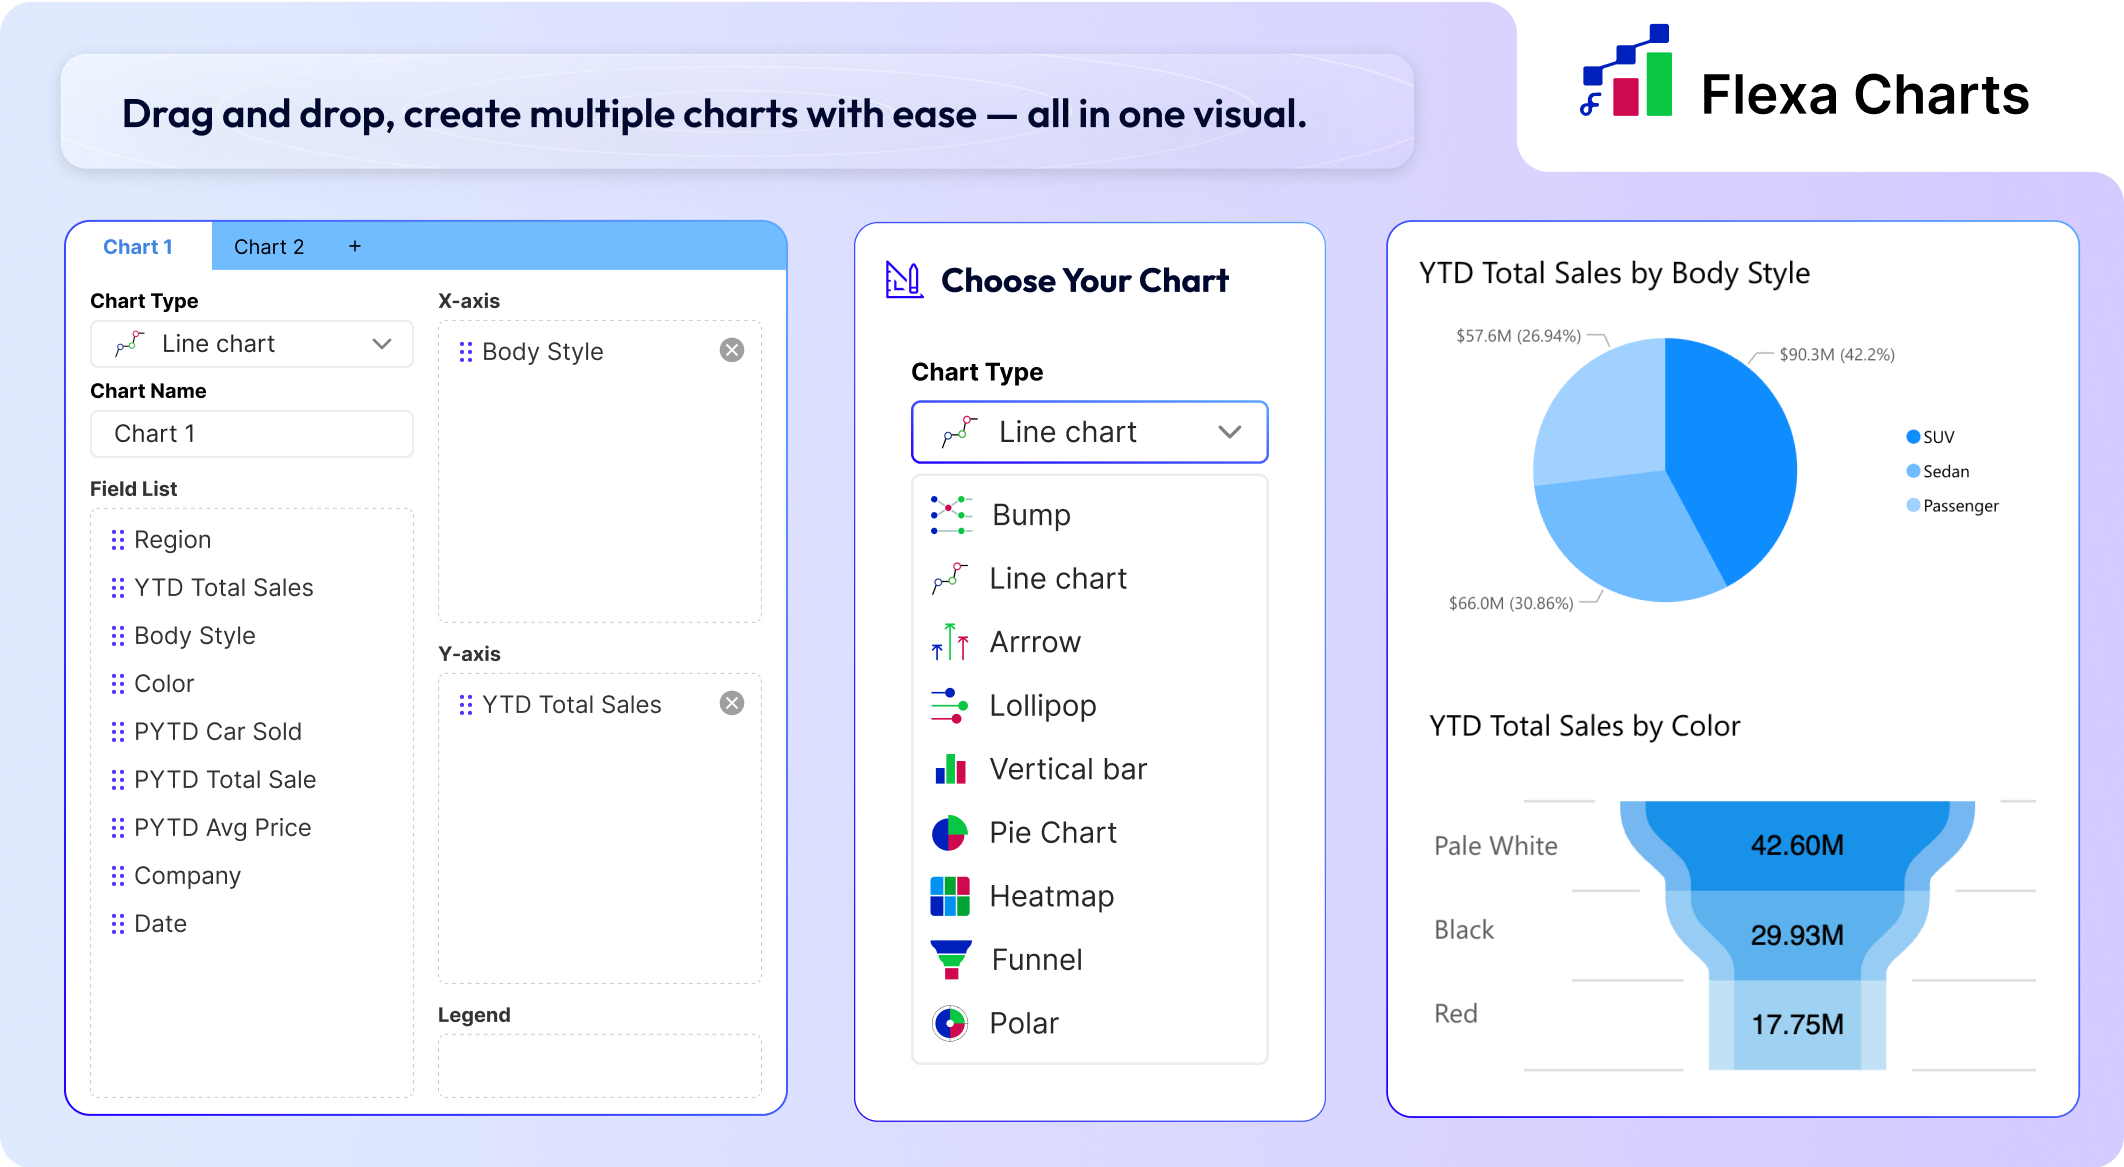
Design Your Charts, Your Way
Flexa Chart lets you pick chart types, drag fields into axes, and customize styles — all in one seamless experience inside Power BI.
Bring flexible charting to life
with the ease of a visual editor 

Get started today!
Experience the next level of chart customization inside Power BI.
With Flexa Chart, you don't just visualize data — you shape how it's understood
Have questions?
Reach out via the contact form, and we'll be happy to assist!