Income & Expense Analytics Dashboard – Key Insights (Jan 1, 2024 – Oct 20, 2025)
1179 Downloads
Description
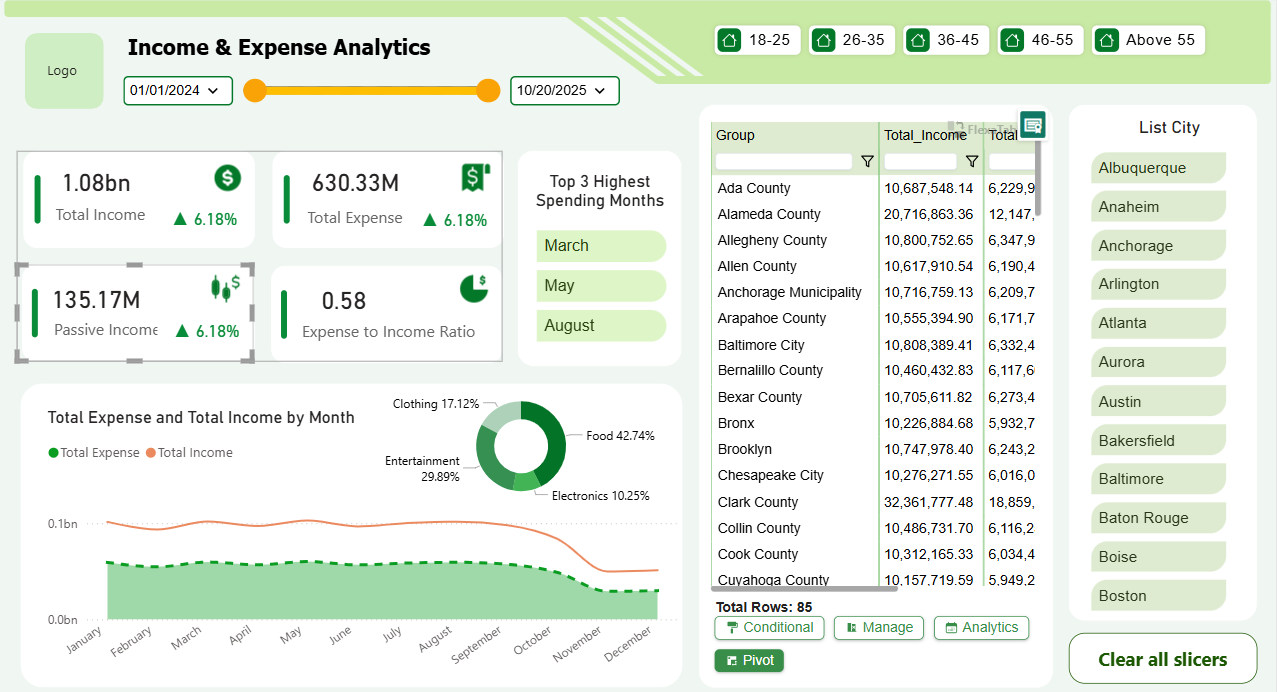
High-Level Financial Summary
- Total Income: $1.08 billion ↑ +6.18% vs previous comparable period
- Total Expense: $630.33 million ↑ +6.18% (exactly matching income growth)
- Passive Income: $135.17 million ↑ +6.18%
- Expense-to-Income Ratio: 0.58 (58%) – healthy and stable
Monthly Trend
- Both income and expenses remained remarkably steady throughout the 22-month period with only minor seasonal fluctuations.
- Highest spending months: March, May, and August (highlighted as top 3 peak months).
Expense Breakdown by Category
- Food – 42.74% (largest category by far)
- Entertainment – 29.89%
- Clothing – 17.12%
- Electronics – 10.25%
Geographic Spending Insights (Top Counties/Cities by Total Spending)
| Rank | County/City | Total Spending ($M) | Avg Monthly Spend ($M) |
| 1 | Ada County | 10,687 | 6,229 |
| 2 | Alameda County | 10,716 | 6,147 |
| 3 | Allegheny County | 10,801 | 6,347 |
| 4 | Anchorage Municipality | 10,717 | 6,210 |
| 5 | Arapahoe County | 10,555 | 6,172 |
Top spending cities include Albuquerque, Anaheim, Atlanta, Aurora, and Austin – indicating strong consumption in major metropolitan areas.Key Takeaways & Implications
- Extremely disciplined financial profile: expenses grew at exactly the same rate as income → spending habits scale linearly with earnings.
- Very strong Expense-to-Income ratio of 58% leaves significant room for savings/investment.
- Food and Entertainment together account for ~73% of all expenses – lifestyle-driven rather than necessity-driven spending.
- Spending is highly concentrated in a few high-population counties, suggesting urban professionals or higher-income households dominate the dataset.
- Passive income contribution ($135M) is meaningful and growing in lockstep.
Recommendations
- Leverage the low 58% expense ratio to aggressively boost savings or investment rate.
- Target Food (43%) and Entertainment (30%) for potential optimization if faster wealth accumulation is desired.
- Consider geographic-specific offers or loyalty programs in top-spending counties (Ada, Alameda, Allegheny, etc.) if this data belongs to a retail/F&B business.
Overall: Very healthy, scalable personal/business finances with significant spending power concentrated in lifestyle categories and major urban areas.
The dashboard is designed using Flexa Design, Flexa Tables, and Flexa Charts from Flexa Intel.
Other Templates
 Free Finance & Accounting
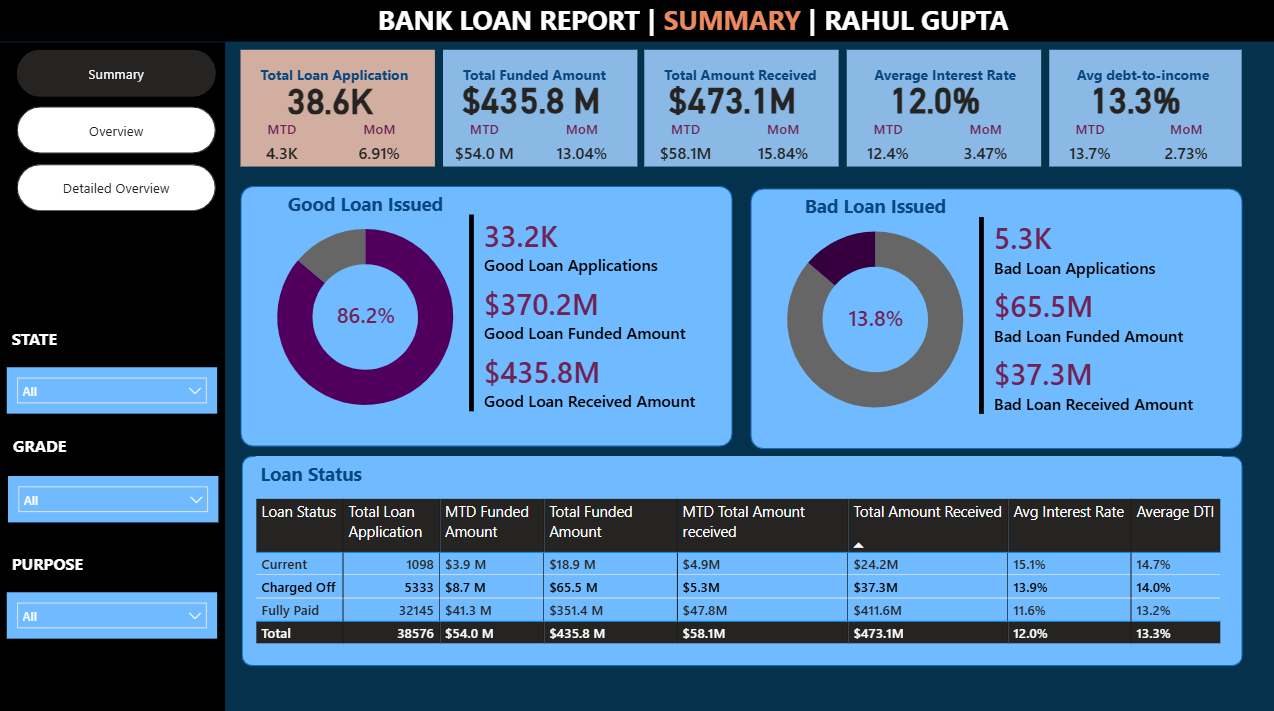
Power BI Bank Loan Report Dashboard Template (Free PBIX Download)
48
 Free Sales & Revenue
Power BI Sales Dashboard with Variance Analysis — Contoso BI Template (Free PBIX Download)
83
 Free Finance & Accounting
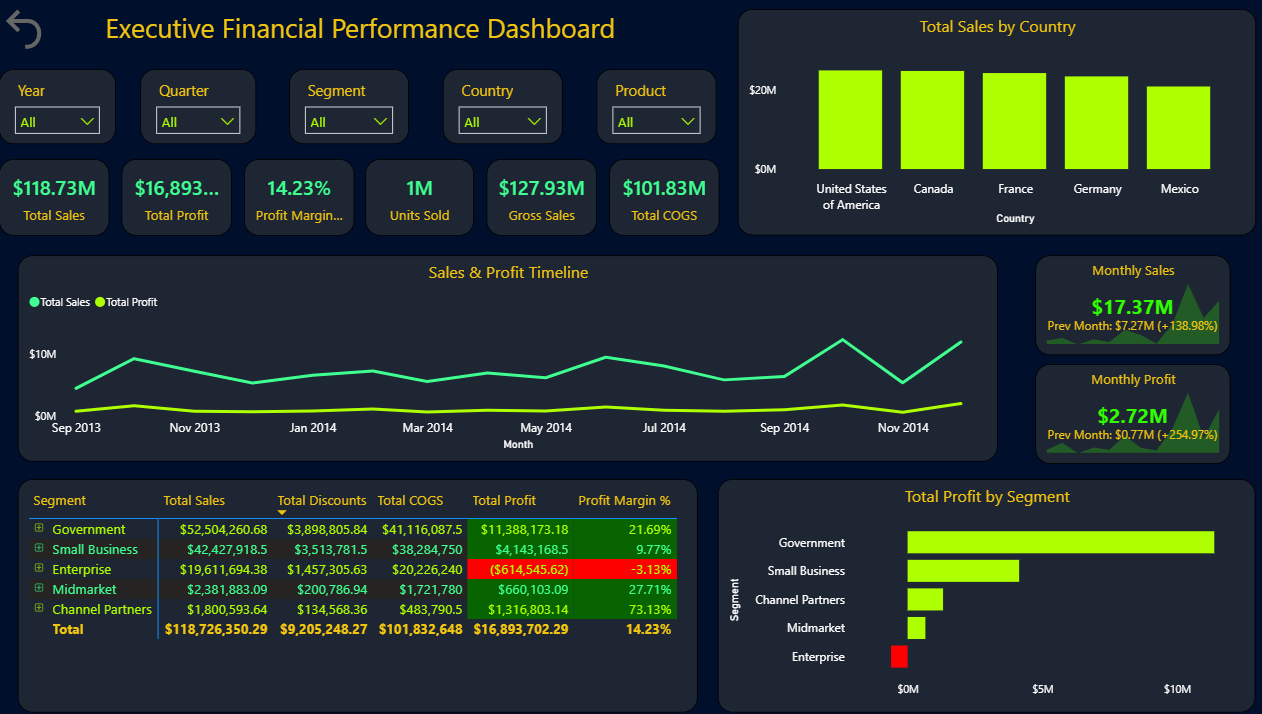
Power BI Executive Financial Performance Dashboard Template (Free PBIX Download)
63
If you find this website helpful, share it with friends and colleagues to boost their Power BI skills and work efficiency!
Like this site? Share it