
General Power BI Dashboard Examples
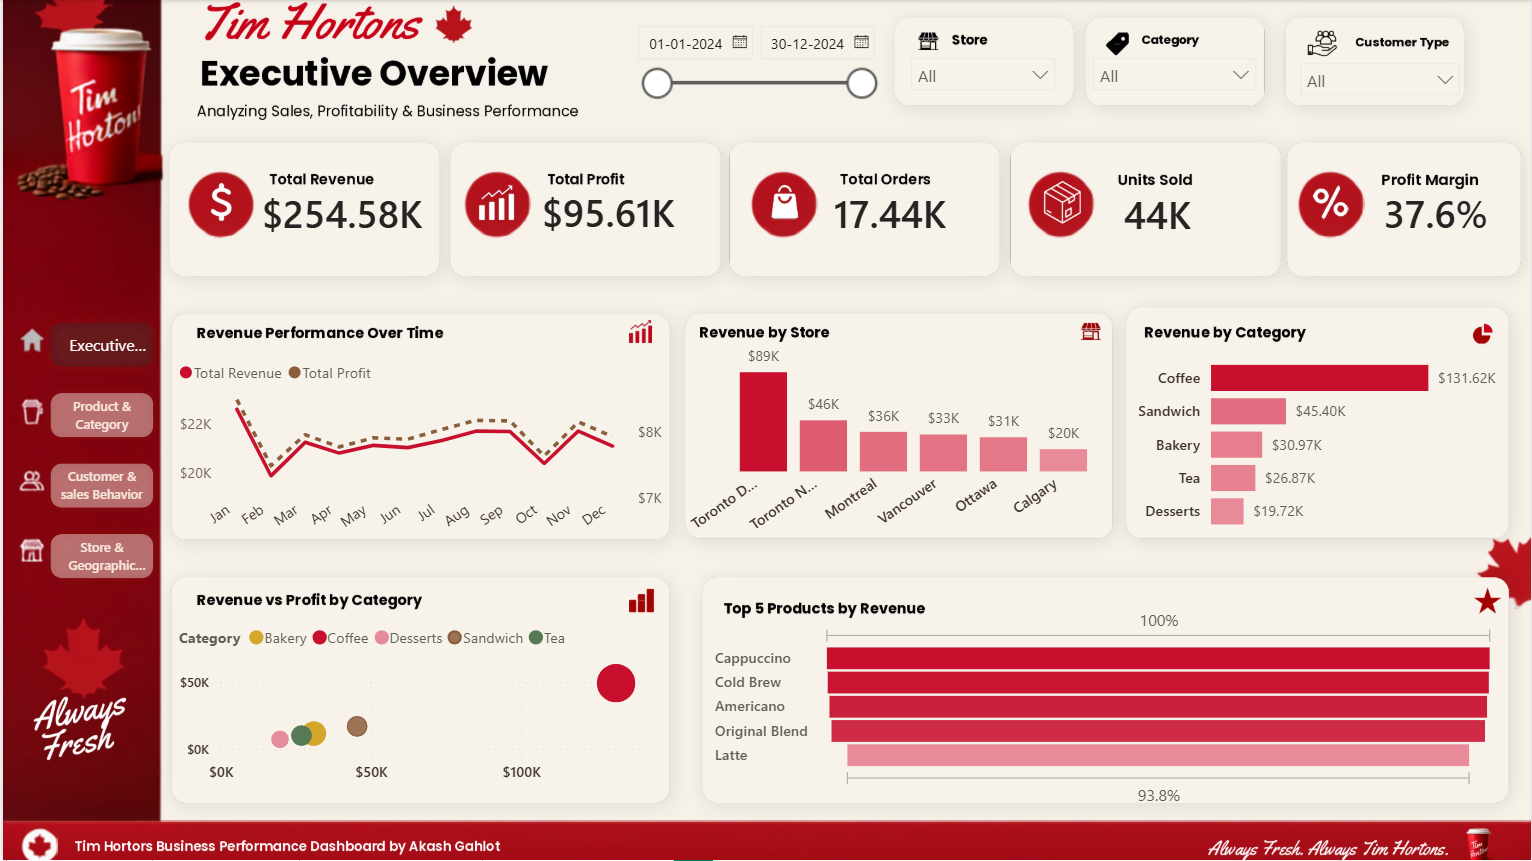
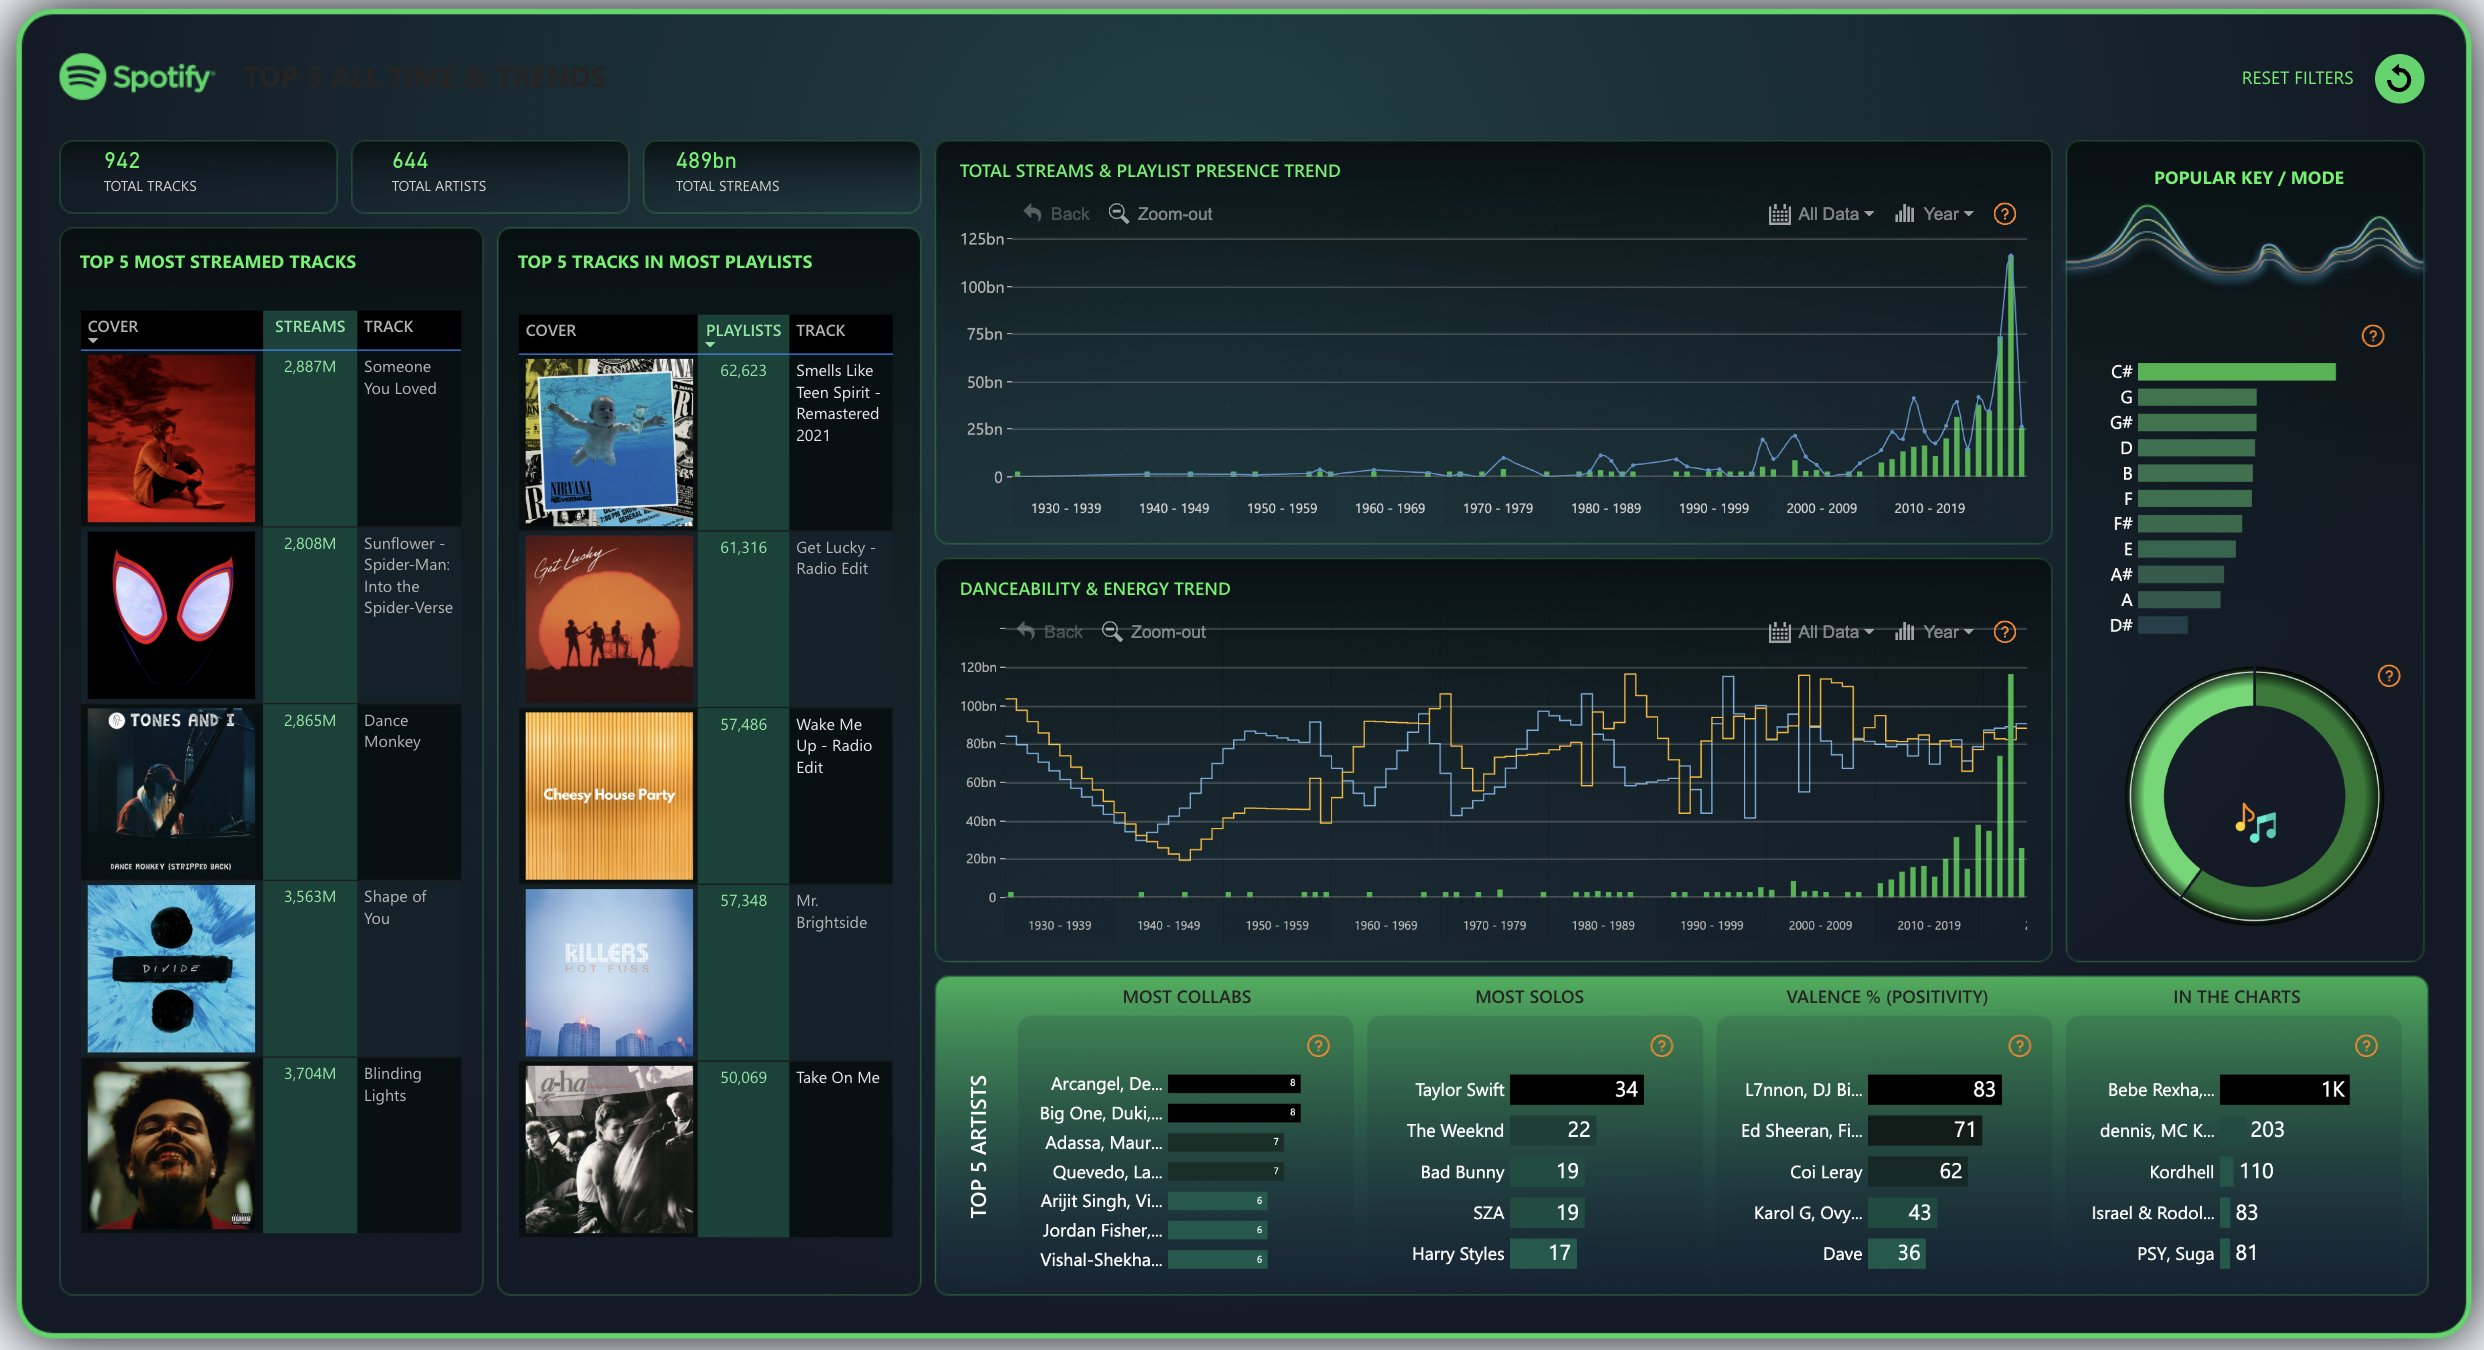
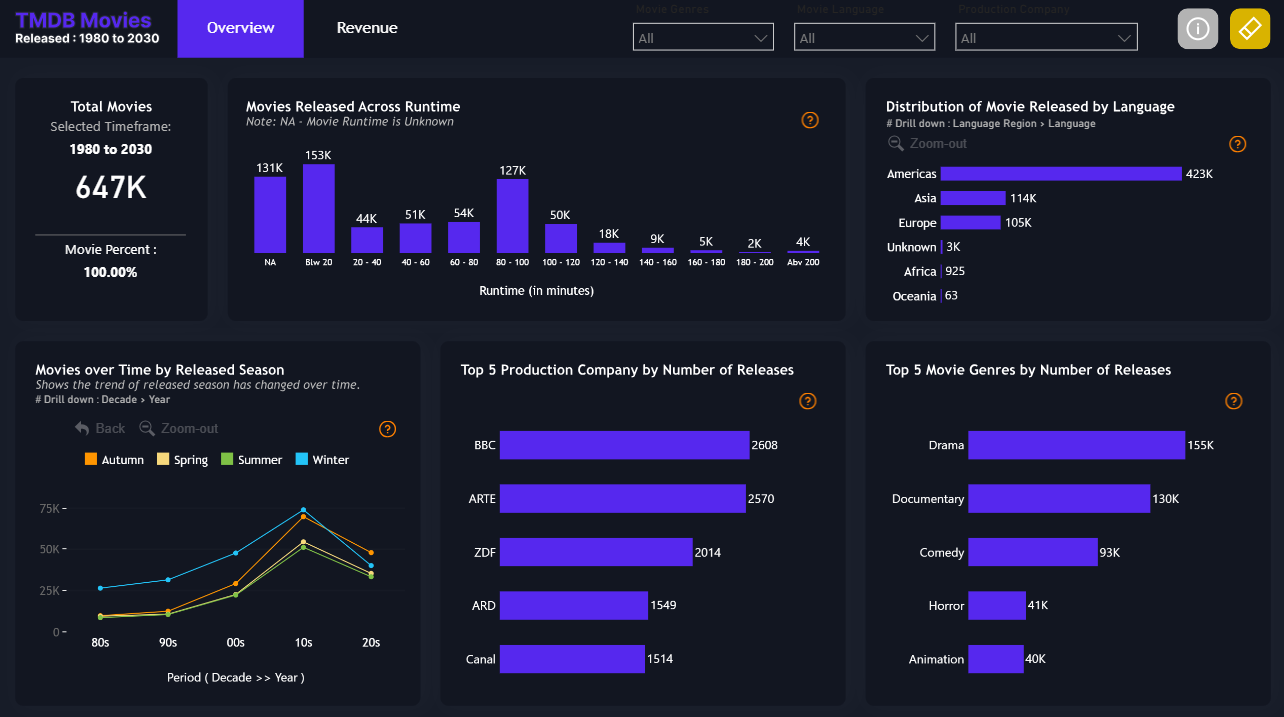
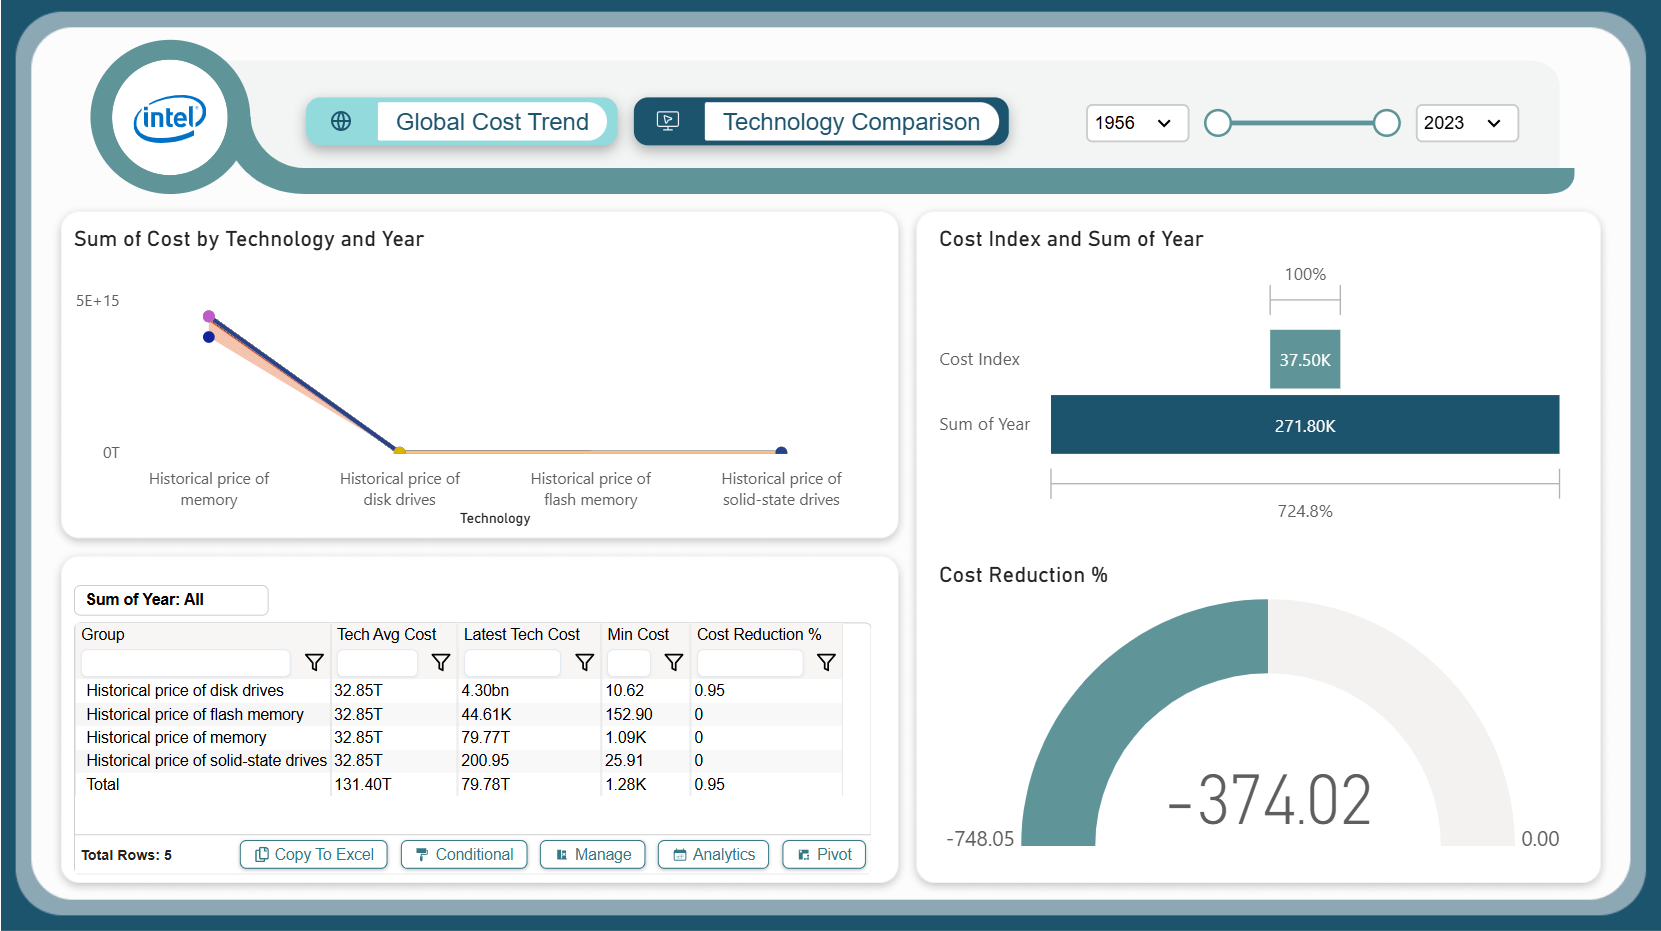
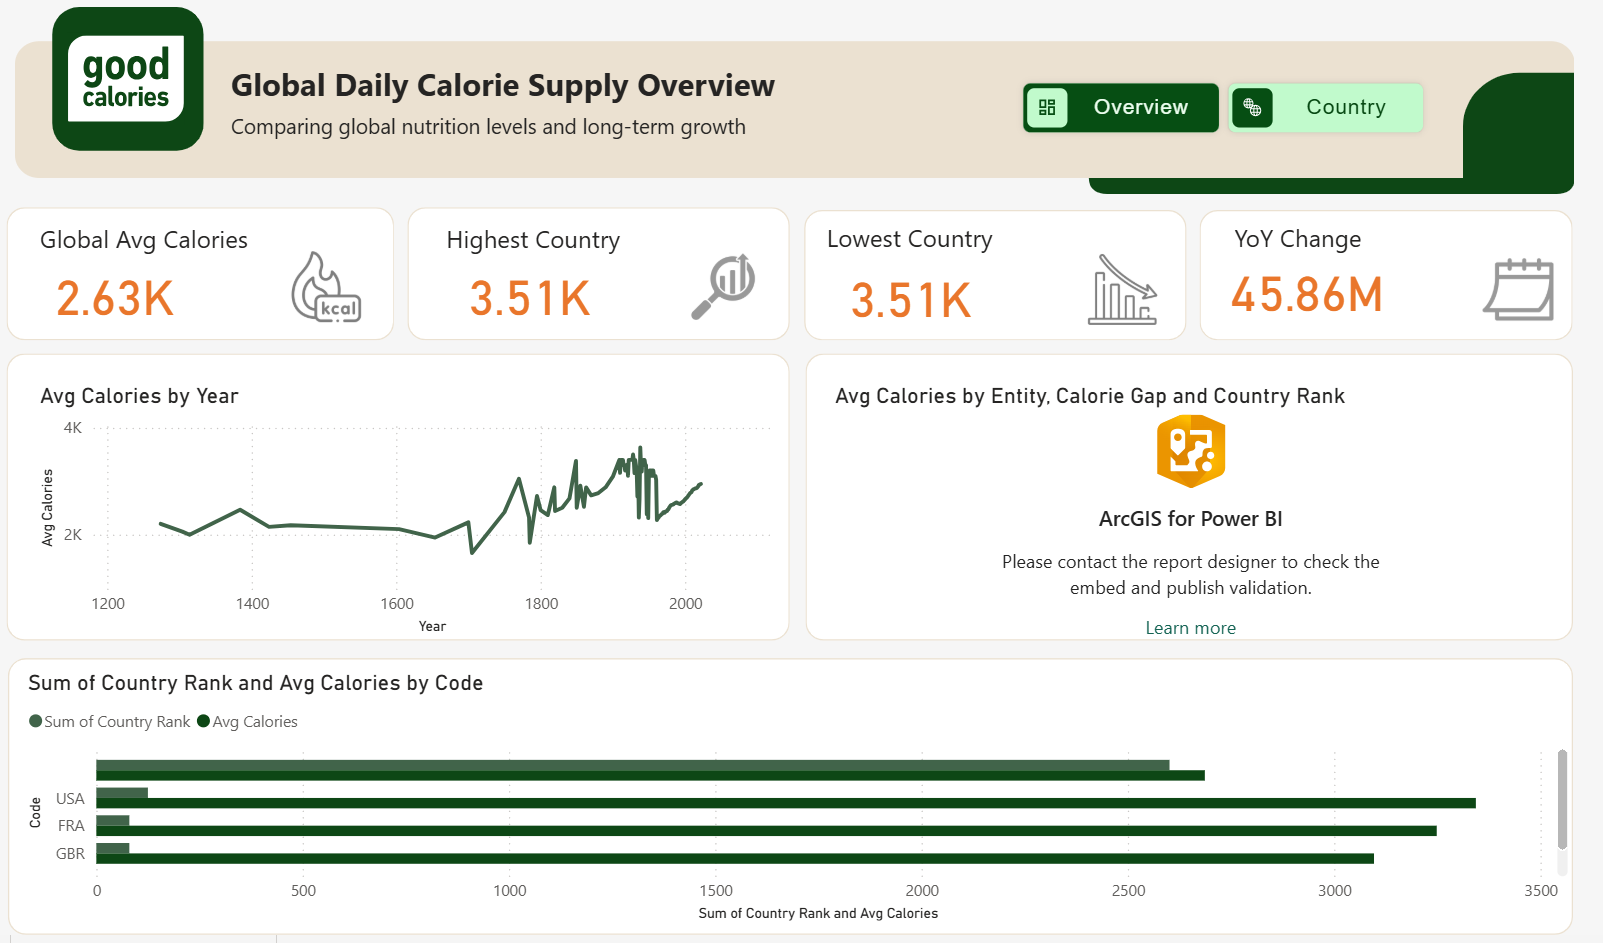
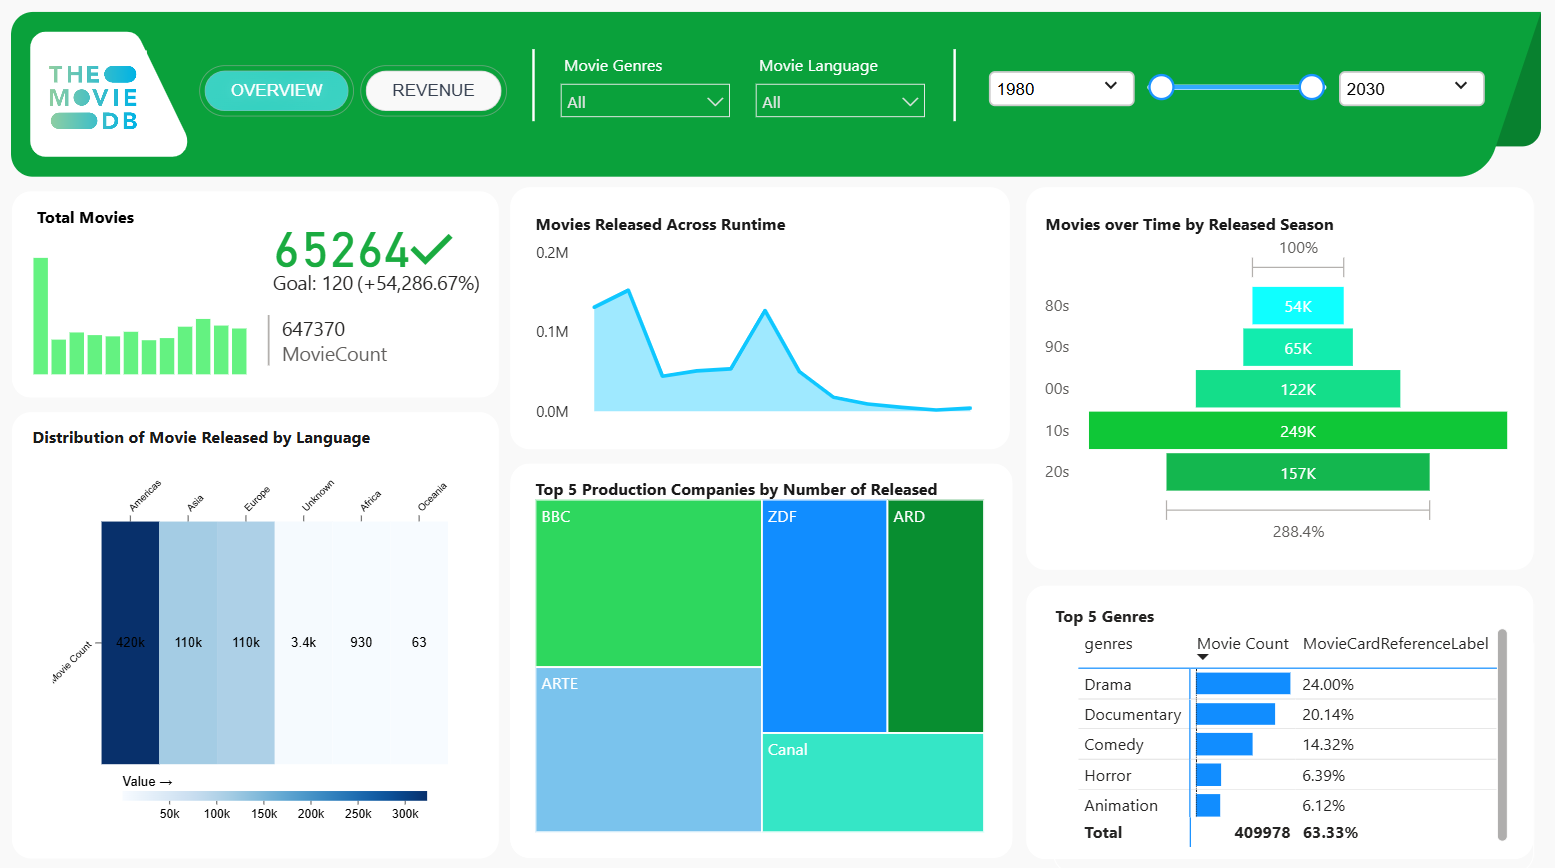
Not every good dashboard fits one industry. This collection gathers cross-domain analyses, visualization pattern references and design showcases — useful when you want to see how a technique (small multiples, decomposition trees, custom tooltips, theme design) looks on real data before applying it to your own.
Browse them as a design library: every PBIX is fully editable, so you can lift the pattern you need into your own reports.
9 templates in Other / General
Browse all templates →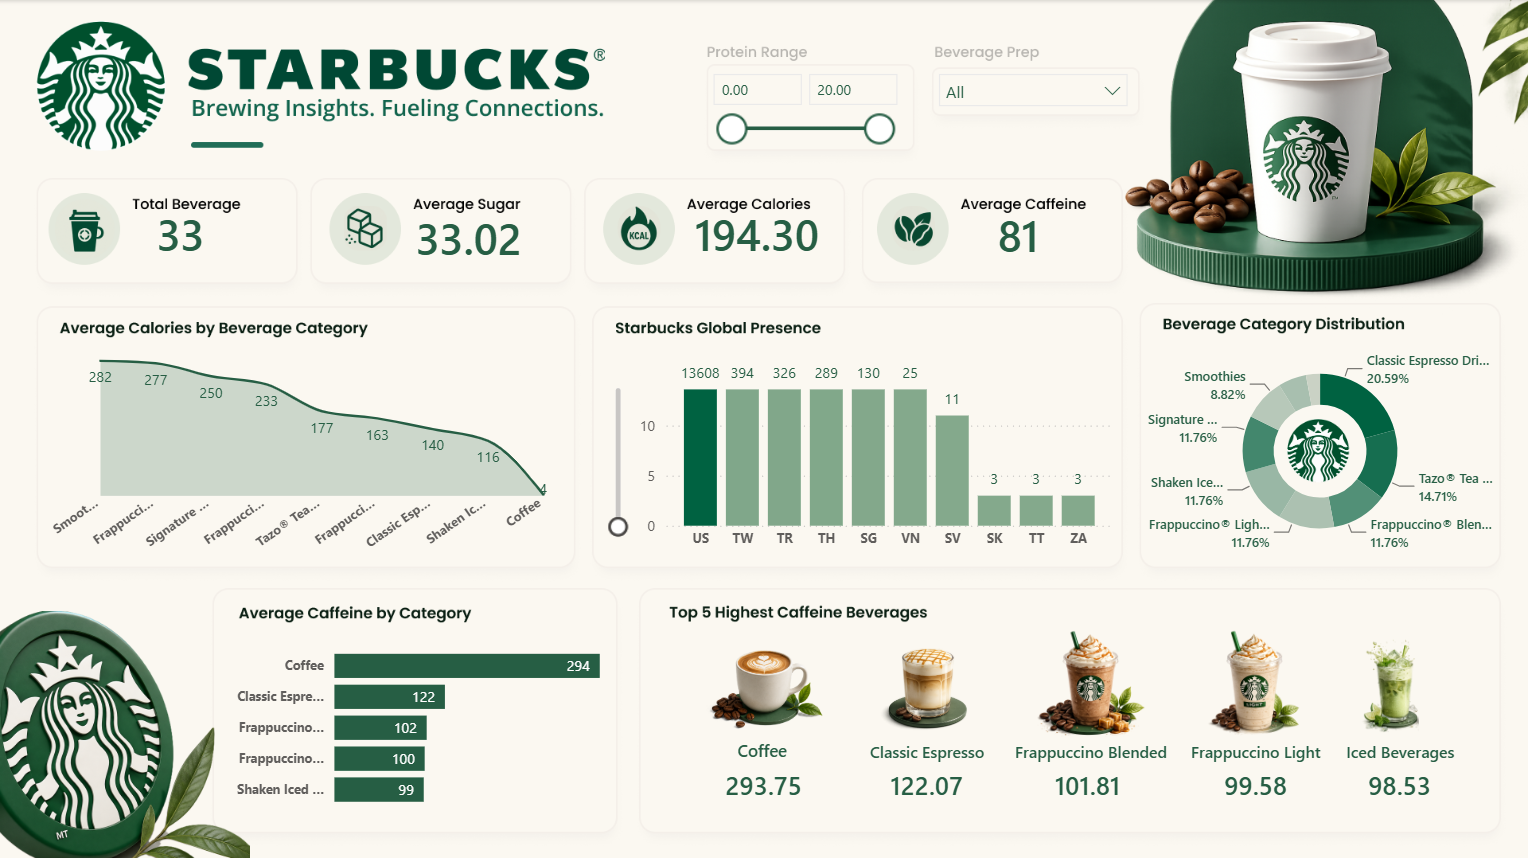
Frequently asked questions
What is in the general category?
Cross-domain datasets (sports, public data, consumer datasets) and design-focused reports that demonstrate Power BI techniques applicable to any industry.
Can I reuse visuals from these templates in my own reports?
Yes — open the PBIX, copy visuals or measures, and paste into your report. The theme files used are also downloadable on the Flexa Theme page.
How often are new templates added?
New templates land regularly across all categories — the Newest sort on the main library page shows the latest additions.