Income & Expense Overview by District – Key Insights (2025 YTD)
974 Downloads
Description
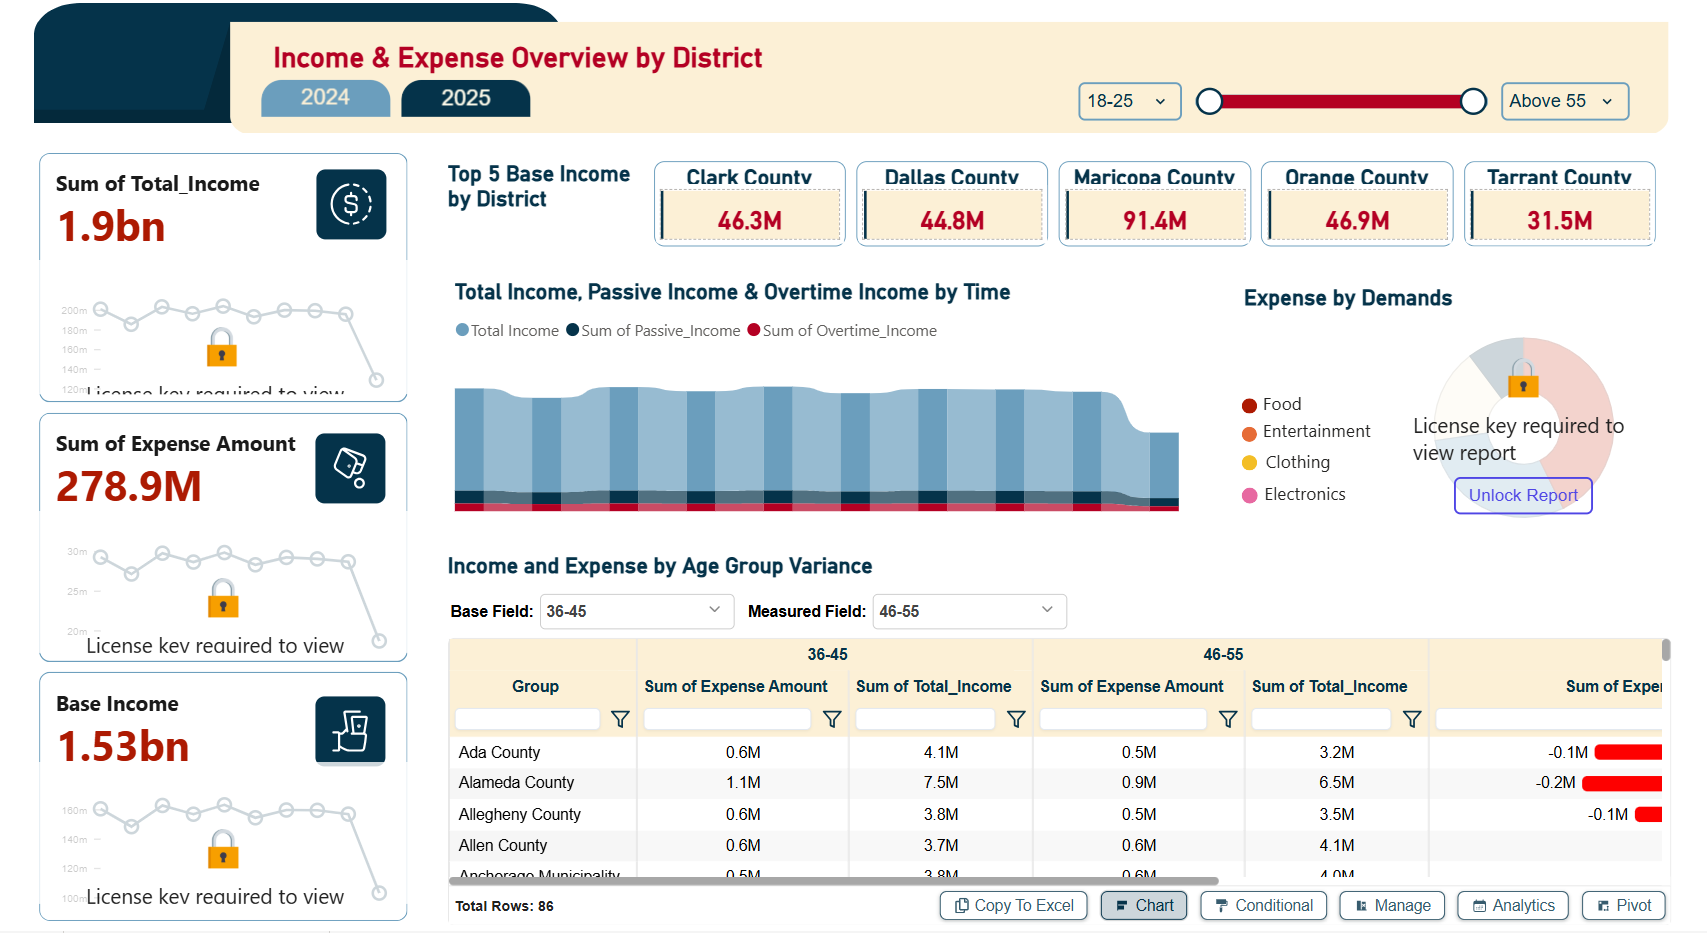
High-Level Financial Summary (2025)
- Total Income: $1.90 billion
- Base (Salary) Income: $1.53 billion (≈80% of total income)
- Total Expenses: $278.9 million
- Net Surplus: ≈ $1.62 billion (very strong financial position)
- Expense-to-Income Ratio: ≈14.7% – extremely low and healthy
Top 5 Districts by Base Income
- Maricopa County – $91.4M
- Orange County – $46.9M
- Clark County – $46.3M
- Dallas County – $44.8M
- Tarrant County – $31.5M
Income Composition Over Time
- Base income (dark blue) forms the overwhelming majority and remains very stable.
- Overtime income (red line) is minimal and declining toward year-end.
- Passive income (gray) is almost negligible.
Expense Breakdown by Category
- Food dominates spending (largest segment by far)
- Followed by Entertainment, Clothing, and Electronics (in descending order
Age Group Variance (36–45 vs 46–55)
- Older group (46–55) consistently spends less than the 36–45 cohort in nearly every district.
- Biggest spending gaps (favoring younger group) seen in Ada, Alameda, and Allegheny Counties.
Key Takeaways
- Exceptionally strong financial health – only ~15% of income is spent, leaving massive surplus for savings/investment.
- Income is extremely stable and salary-driven; overtime and passive streams contribute almost nothing.
- Spending is heavily skewed toward Food & Entertainment – classic lifestyle/leisure spending pattern for affluent working-age population.
- Maricopa County (Phoenix area) stands out as the clear economic powerhouse.
- The 36–45 age group is the highest-spending segment – prime marketing target for discretionary goods and services.
Recommendations
- Capitalize on the 85%+ savings rate with investment or retirement planning offerings.
- Focus marketing budgets on Maricopa, Orange, Clark, and Dallas metro areas.
- Develop targeted campaigns for the 36–45 age cohort, especially around dining, travel, and entertainment.
- Consider premium food & lifestyle loyalty programs given the dominance of those categories.
Overall: Very healthy, high-earning, low-spending population with clear geographic and demographic concentration – ideal profile for wealth management and premium consumer offerings.
The dashboard is designed using Flexa Design, Flexa Tables, and Flexa Charts from Flexa Intel.
Other Templates
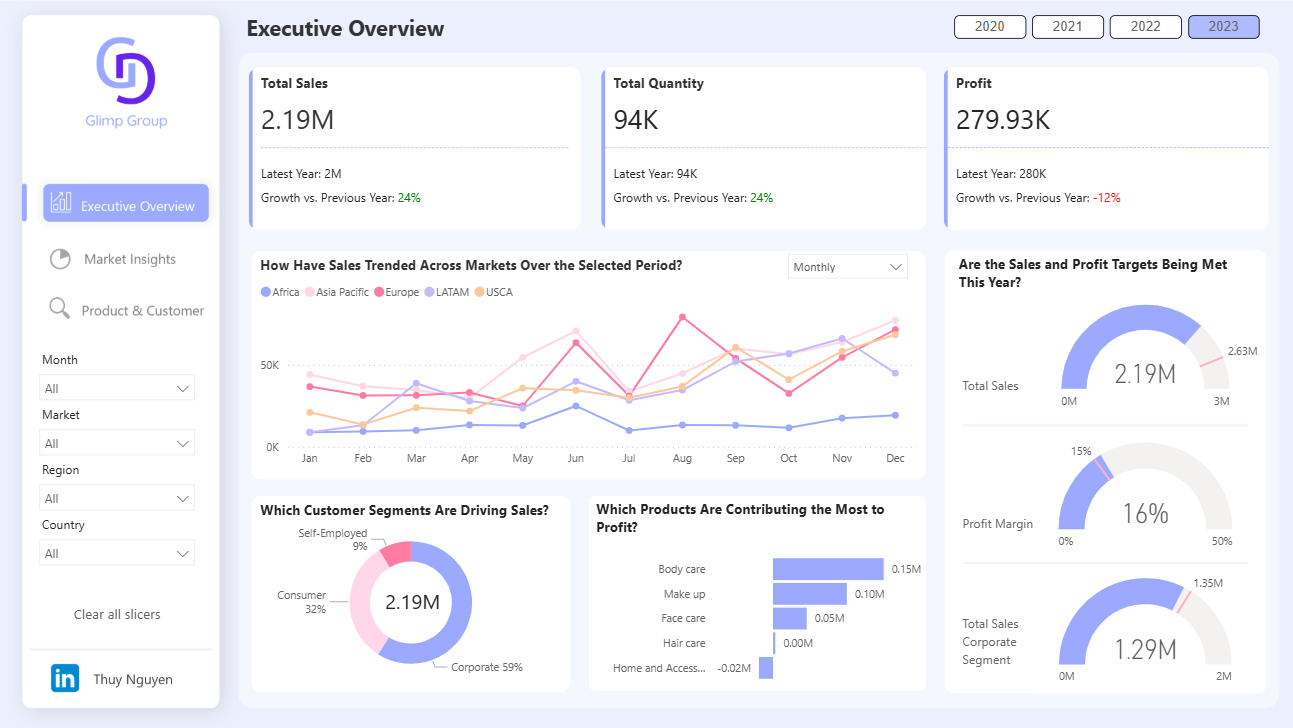 Free Sales & Revenue
Power BI Executive Overview Dashboard Template — Global Sales & Profit Target Tracking (Free PBIX Download)
147
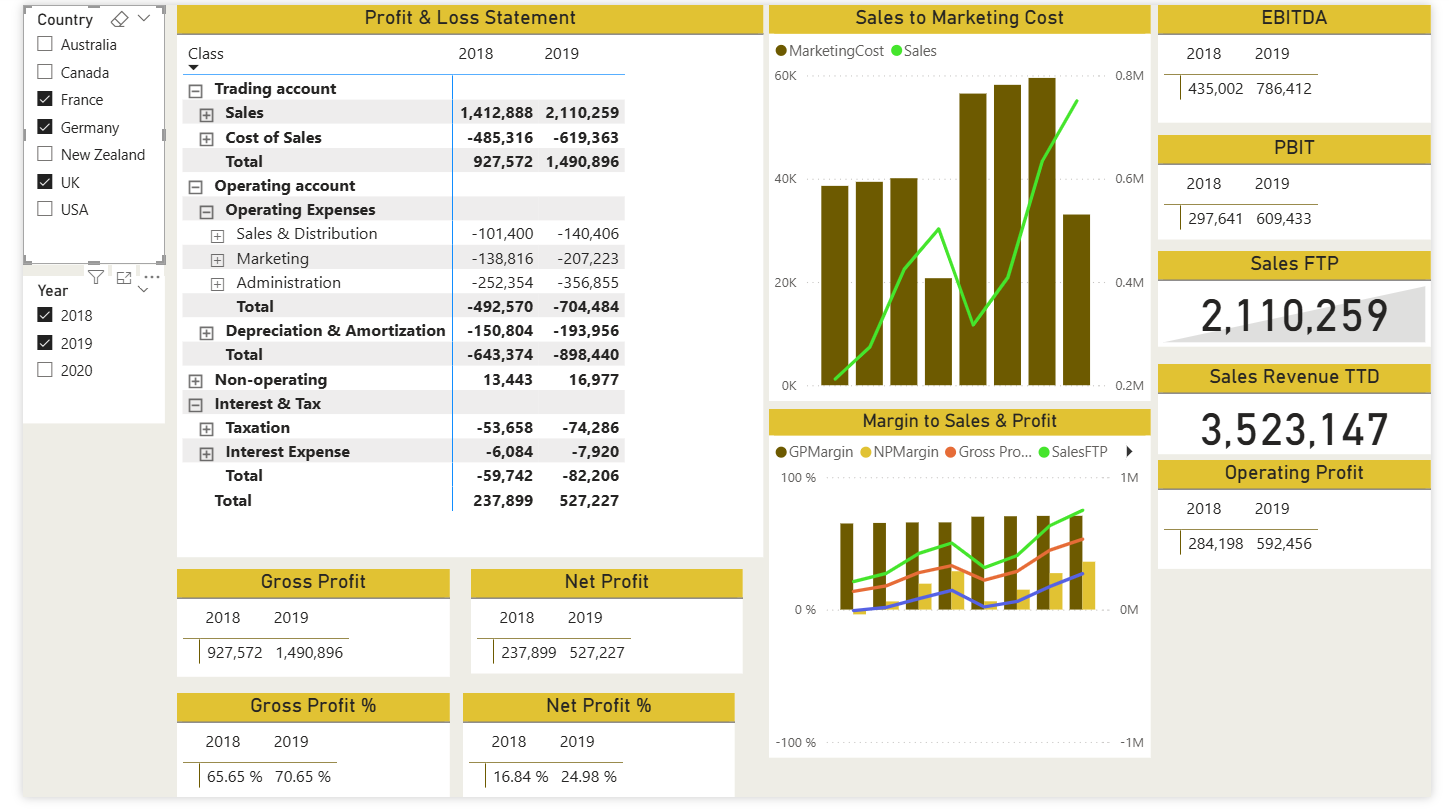 Free Finance & Accounting
Power BI Profit & Loss Dashboard Template (Free PBIX Download)
107
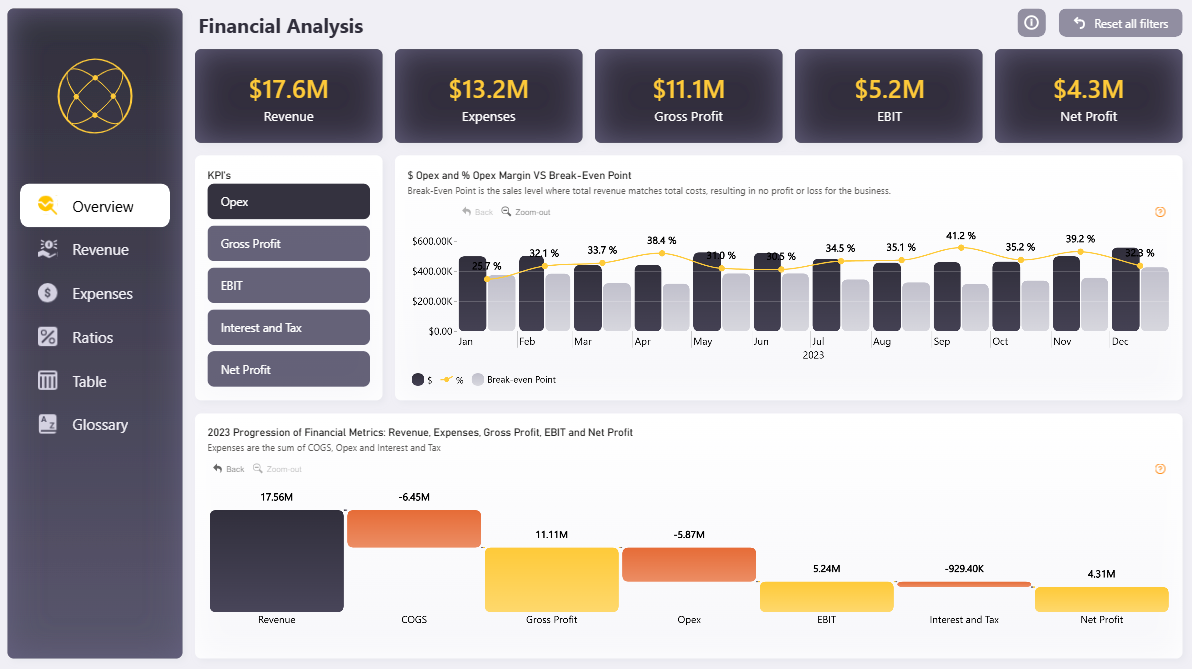 Free Finance & Accounting
Power BI Financial Analysis Dashboard Template (Free PBIX Download)
120
If you find this website helpful, share it with friends and colleagues to boost their Power BI skills and work efficiency!
Like this site? Share it