
Power BI Education Dashboard Examples
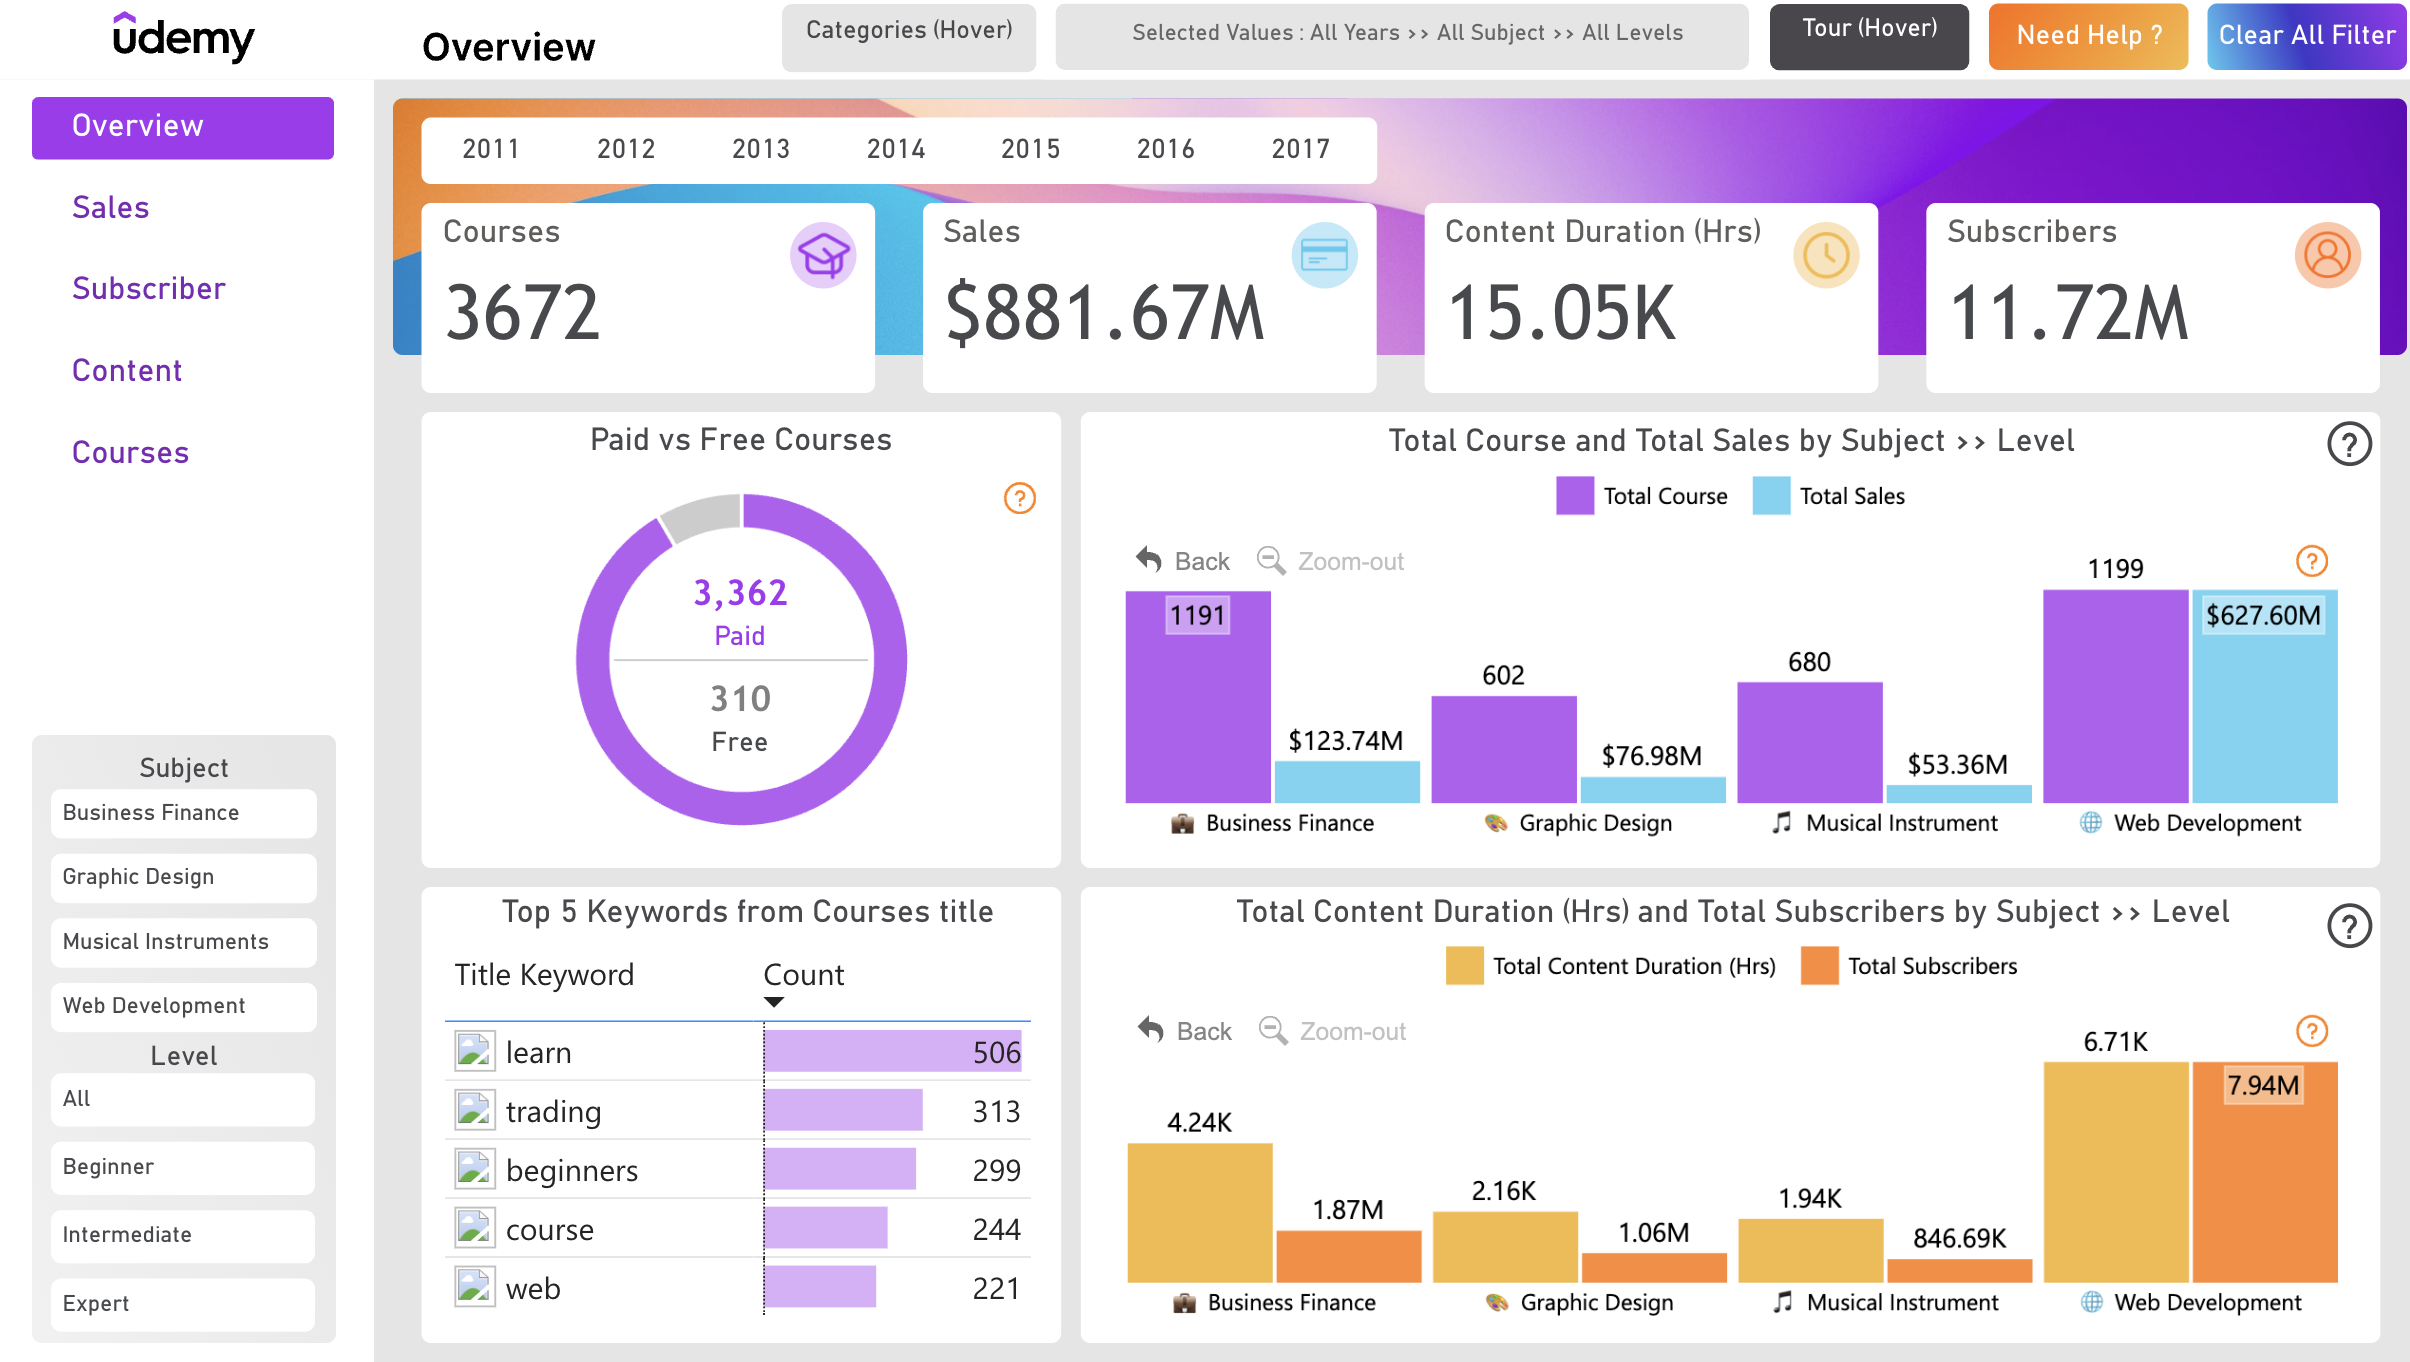
Education dashboards track cohorts: enrollment funnels, attendance, grade distributions and progression over academic years. The templates below implement those views with academic-calendar-aware time intelligence — a detail that generic templates usually miss.
They fit schools, universities and training providers working from SIS/LMS exports.
2 templates in Education
Browse all templates →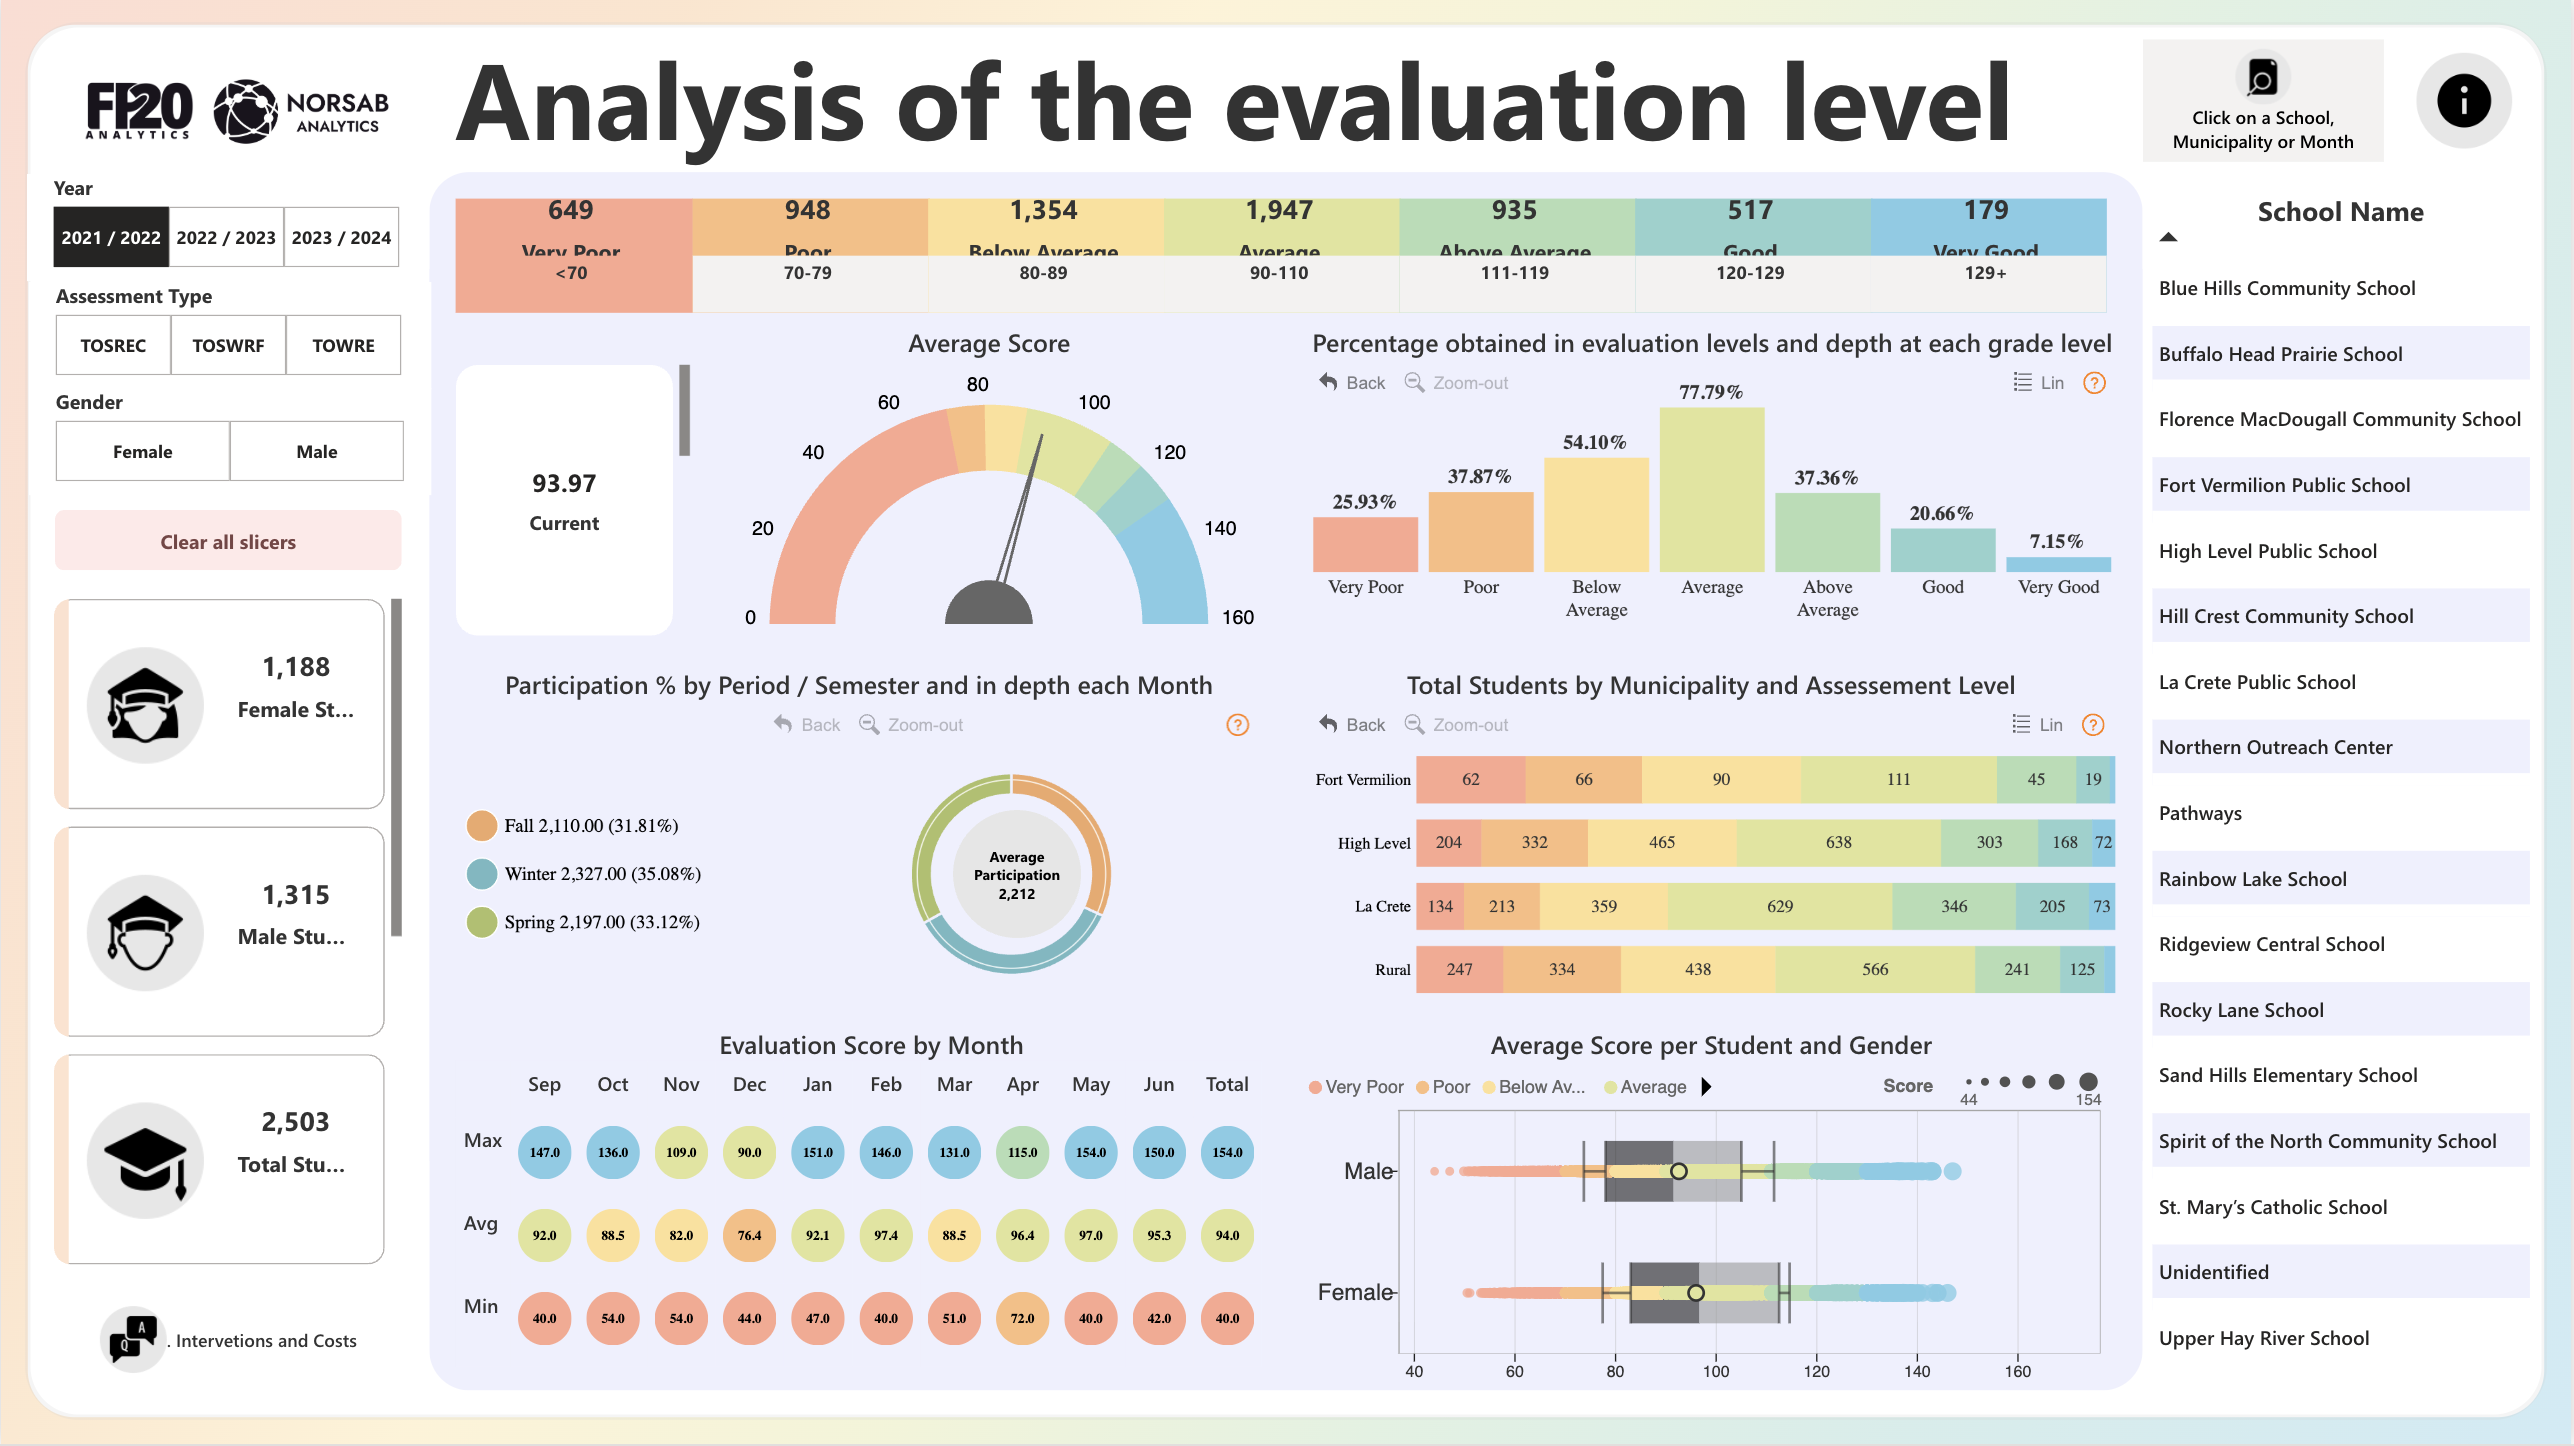
Frequently asked questions
Do the templates understand academic years and terms?
Yes — the date dimension includes academic-year and term columns, so year-over-year comparisons align on academic periods rather than calendar years.
Can I track student performance by cohort?
Cohort templates group students by intake and follow progression, retention and grade distribution across terms — sliceable by program and demographic fields you provide.
What data exports do I need?
A student table, an enrollment/registration table and an assessment or attendance table — shapes that Moodle, Canvas and most SIS platforms export directly.