
Power BI Project Management Dashboard Examples
A PMO dashboard has to compress many projects into one honest page: status, schedule health, budget burn and who is overloaded. These templates ship portfolio overviews, timeline/Gantt-style views, budget-vs-actual burn tracking and resource allocation matrices as ready PBIX files.
They map naturally onto exports from Jira, Azure DevOps, MS Project or a plain project register spreadsheet.
2 templates in Project Management
Browse all templates →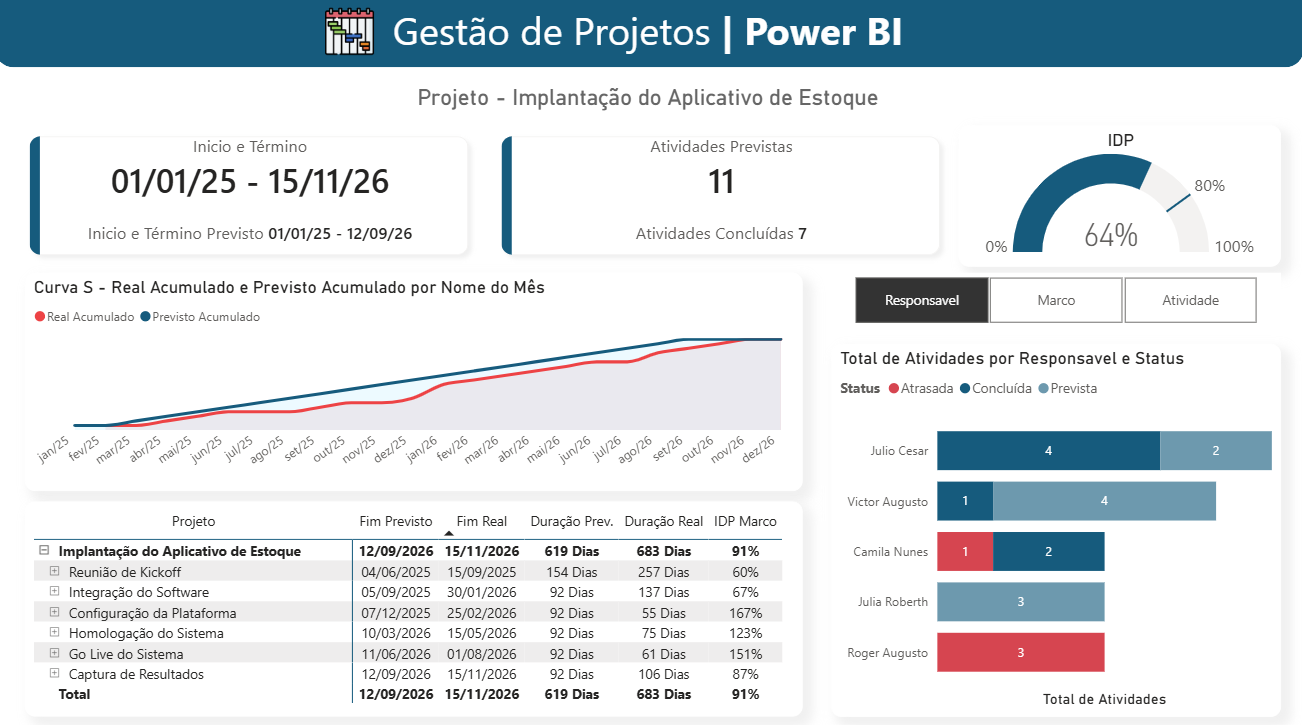

Frequently asked questions
Can Power BI show Gantt-style project timelines?
Yes — the templates use timeline visuals driven by start/end dates per task or phase. Swap in your own project table and the timeline re-renders.
How is project health / RAG status calculated?
RAG measures combine schedule variance and budget variance thresholds; the thresholds are parameters you can tune to your PMO standards.
Do these work with Jira or Azure DevOps data?
Yes — export issues/work items with dates, status and story points, load in Power Query and remap. The example dataset shows the expected structure.