Power BI Credit Card Customer Report Dashboard Template (Free PBIX Download)
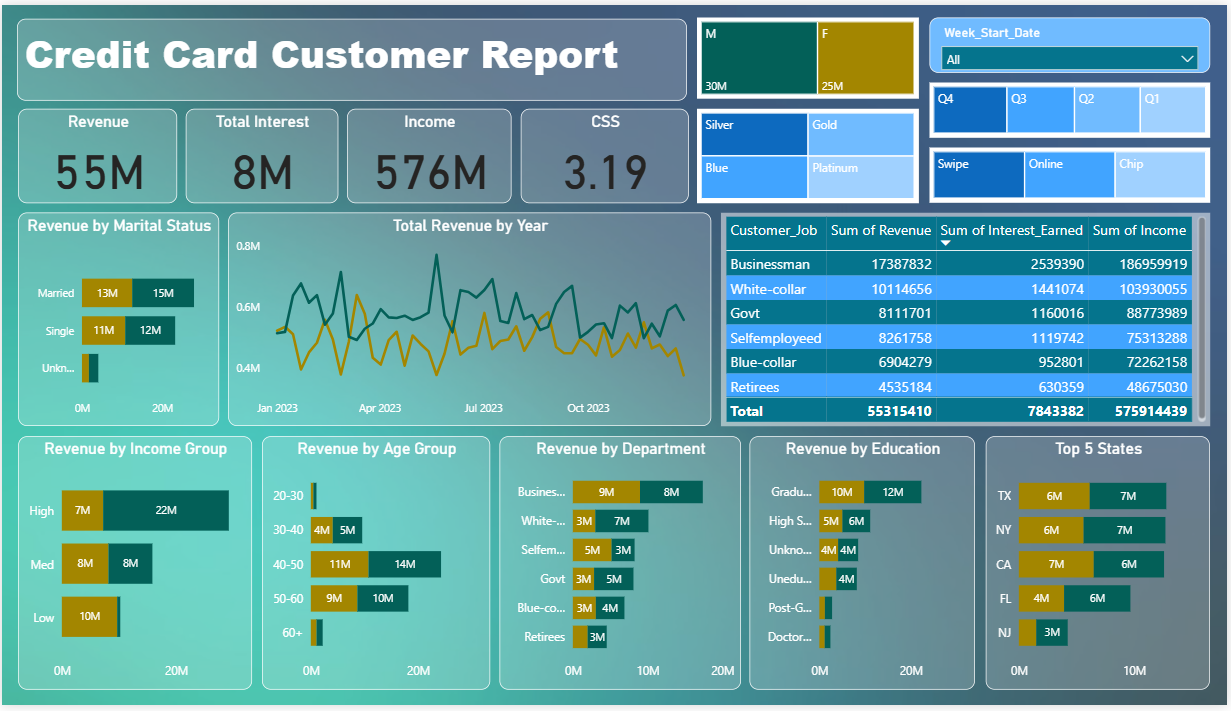
Introduction: This Power BI Credit Card Customer Report analyzes a full credit card portfolio across $55M in revenue, $8M in interest earned, and $576M in customer income — giving financial services analysts and credit risk teams a 360-degree view of customer value by job type, income group, age band, education level, marital status, geography, and card category. With weekly time-series tracking and multi-dimensional demographic segmentation, it is the reference template for retail banking and fintech teams building customer profitability dashboards on credit card data.
What's Inside This Template
Top KPI Banner
| MetricValue | |
| Revenue | $55M |
| Total Interest | $8M |
| Income | $576M |
| CSS (Customer Satisfaction Score) | 3.19 |
The $8M interest on $55M revenue = 14.5% interest contribution — meaning the majority of revenue (85.5%) comes from non-interest sources: interchange fees, annual fees, and other transaction revenue. This is the profile of a transactor-heavy portfolio rather than a revolver-heavy one. Revolvers (customers who carry balances and pay interest) are the most profitable segment in credit card economics; at 14.5% interest share, this portfolio is undermonetizing its balance-carrying customers relative to industry norms where interest typically represents 50–70% of credit card revenue.
CSS at 3.19/5 follows the same pattern as the coffee shop dashboard — below the 3.5 threshold that typically indicates neutral customer experience. In financial services, CSS below 3.5 correlates with elevated churn risk and reduced card-of-wallet share.
Filter Panel (top right):
- Gender: M (30M) | F (25M) — toggleable
- Card Category: Silver | Gold | Blue | Platinum
- Quarter: Q4 | Q3 | Q2 | Q1
- Transaction Type: Swipe | Online | Chip
These four filter dimensions allow full cross-segmentation: e.g., "Female Platinum cardholders transacting Online in Q4" — enabling targeted segment analysis without any DAX modification.
Revenue by Marital Status
| StatusMaleFemale | ||
| Married | $13M | $15M |
| Single | $11M | $12M |
| Unknown | ~$1M | — |
Female Married cardholders generate the highest revenue at $15M — outperforming Male Married ($13M) by 15.4%. Across both Married and Single segments, female cardholders outspend male cardholders. This is counterintuitive relative to the gender KPI split (M: $30M, F: $25M) — the apparent male revenue dominance in the top-line KPI likely reflects higher male cardholder count rather than higher per-cardholder spending.
Total Revenue by Year (Weekly Time Series — Jan–Dec 2023)
The dual-line chart tracks two series (likely Male vs Female, or two card categories) weekly across 2023. Key patterns:
- January–March: High volatility with multiple sharp spikes reaching ~0.8M weekly — likely post-holiday spending behavior and new year promotional activity
- April–June: Volatility moderates, baseline around 0.5–0.6M weekly
- July–September: Further compression to 0.4–0.5M range with reduced spikes — summer spending normalization
- October–December: Both lines converge and trend downward toward 0.4M — suggesting either seasonal decline or the dataset captures incomplete Q4 data
The two lines diverge most sharply in Q1 (Jan–Mar spikes) and converge in Q3–Q4 — the divergence period is when gender or segment spending behavior differs most, making Q1 the highest-value targeting window for differentiated marketing.
Revenue by Job Type (Table)
| Customer JobRevenueInterest EarnedIncome | |||
| Businessman | $17,387,832 | $2,539,390 | $186,959,919 |
| White-collar | $10,114,656 | $1,441,074 | $103,930,055 |
| Govt | $8,111,701 | $1,160,016 | $88,773,989 |
| Self-employed | $8,261,758 | $1,119,742 | $75,313,288 |
| Blue-collar | $6,904,279 | $952,801 | $72,262,158 |
| Retirees | $4,535,184 | $630,359 | $48,675,030 |
| Total | $55,315,410 | $7,843,382 | $575,914,439 |
Businessman dominates at $17.4M revenue (31.4% of total) — more than White-collar + Govt combined ($18.2M). The Businessman segment's interest-to-revenue ratio: $2.54M / $17.4M = 14.6% — nearly identical to the portfolio average, suggesting businessmen are transactors (spending high but not revolving balances disproportionately).
Self-employed vs Govt comparison is revealing: Self-employed generates slightly more revenue ($8.26M vs $8.11M) but earns less interest ($1.12M vs $1.16M) despite having lower income ($75.3M vs $88.8M). Self-employed customers spend more relative to their income but carry less revolving balance — a high-spend, low-risk profile.
Blue-collar interest-to-revenue ratio: $952K / $6.9M = 13.8% — slightly below average, but Blue-collar customers have the lowest income ($72.3M) relative to revenue generated, indicating higher credit utilization relative to income — the segment most likely to carry balances and generate interest if credit limits are managed appropriately.
Retirees at $4.5M revenue on $48.7M income = 9.3% revenue-to-income ratio — the lowest of any segment. Retirees are the most conservative spenders relative to their income, generating the least revenue per dollar of income despite presumably having the most financial stability.
Revenue by Income Group
| Income GroupMaleFemale | ||
| High | $7M | $22M |
| Medium | $8M | $8M |
| Low | $10M | — |
The most striking finding in the entire dashboard: High-income Female cardholders generate $22M vs High-income Male cardholders at only $7M — a 3.1x gap. This is the inverse of what traditional credit card demographics would predict. High-income female customers in this portfolio are dramatically outspending their male counterparts. This could reflect: higher average spend per transaction by high-income women, more female cardholders in the High income tier, or a product/rewards structure that disproportionately appeals to high-income female spending categories (travel, lifestyle, premium retail).
Low-income Male cardholders at $10M — generating more revenue than High-income Males ($7M) — confirms the male revenue pattern is driven by volume at lower income tiers, not by high-value spenders. Female revenue is concentrated at the top of the income distribution; male revenue is distributed more evenly.
Revenue by Age Group
| Age GroupMaleFemale | ||
| 20–30 | ~$1M | ~$1M |
| 30–40 | $4M | $5M |
| 40–50 | $11M | $14M |
| 50–60 | $9M | $10M |
| 60+ | ~$1M | ~$1M |
40–50 is the dominant age group at $11M (M) + $14M (F) = $25M — 45.2% of total portfolio revenue from a single decade cohort. The 40–50 age band is the classic credit card sweet spot: peak earning years, established spending habits, family expenditure (mortgages, children's education, travel), and highest credit limits. Revenue drops sharply at 60+ (near-zero for both genders), confirming this portfolio has minimal penetration of the retiree demographic despite Retirees being the 6th job category in the table.
Female 40–50 at $14M outperforms Male 40–50 at $11M by 27% — the gender gap is widest in the highest-value age cohort, amplifying the High-income female finding above.
Revenue by Department (Job repeat — alternative view)
| SegmentMaleFemale | ||
| Businessman | $9M | $8M |
| White-collar | $3M | $7M |
| Self-employed | $5M | $3M |
| Govt | $3M | $5M |
| Blue-collar | $3M | $4M |
| Retirees | $3M | — |
White-collar Female ($7M) vs White-collar Male ($3M) — a 2.3x gap — confirms the female outperformance pattern extends beyond high-income to professional job categories. Female white-collar workers are this portfolio's second-highest female revenue segment after Businesswomen. Self-employed Male ($5M) vs Self-employed Female ($3M) is the only segment where male outperforms female significantly — consistent with the demographic reality that self-employment skews male in most markets.
Revenue by Education
| EducationMaleFemale | ||
| Graduate | $10M | $12M |
| High School | $5M | $6M |
| Unknown | $4M | $4M |
| Uneducated | $4M | — |
| Post-Graduate | ~$2M | ~$2M |
| Doctorate | ~$1M | — |
Graduate-level customers generate $22M combined (39.9% of total) — the education tier with highest revenue, not Post-Graduate or Doctorate. This counterintuitive result (graduates outperforming higher education tiers) reflects volume: there are simply more graduate-level cardholders than post-graduates or doctorates. Female Graduates at $12M outperform Male Graduates at $10M — the female outperformance pattern is consistent across education tiers.
Doctorate holders generating near-zero revenue despite presumably high income is a segment penetration failure — highly educated, high-income professionals are either underrepresented in this portfolio or choosing competitor products.
Top 5 States
| StateMaleFemale | ||
| TX | $6M | $7M |
| NY | $6M | $7M |
| CA | $7M | $6M |
| FL | $4M | $6M |
| NJ | $3M | — |
TX, NY, and CA are the top three states — the three largest US states by population and economic activity. CA is the only state where Male ($7M) outperforms Female ($6M) — every other top state shows female revenue equal to or above male. FL Female ($6M) vs FL Male ($4M) — a 50% gap — is the widest state-level gender gap in the top 5.
Key Insights
- High-income Female cardholders at $22M vs High-income Male at $7M (3.1x gap) is the single most strategically important finding in this dashboard. This is not a marginal difference — it is a fundamental portfolio characteristic that should reshape product design, rewards structure, marketing spend allocation, and acquisition targeting. If the portfolio's highest-value customers are overwhelmingly high-income women, every dollar of acquisition marketing spent on high-income male prospects has 3.1x lower expected return than the same dollar spent on high-income female prospects.
- Interest at only $8M on $55M revenue (14.5%) confirms this is a transactor-dominated portfolio — structurally less profitable than a revolver-heavy book. The Blue-collar segment (lowest income, $6.9M revenue) is the most likely revolver candidate; targeted credit limit and APR management for this segment could increase interest revenue without acquiring new customers. Moving the portfolio interest share from 14.5% to 20% would add approximately $3M in annual revenue at current portfolio size.
- CSS at 3.19 combined with Q3–Q4 revenue compression creates a churn risk narrative. Declining weekly revenues in H2 2023 alongside below-threshold customer satisfaction suggests customers are reducing card usage over time — the early stage of passive churn (not cancelling but spending less). A 10% reduction in spend frequency from the 40–50 age cohort ($25M) would cost $2.5M in annual revenue — more than 30% of total interest earned.
- The 40–50 age group generates 45.2% of portfolio revenue from what is presumably 20–25% of the cardholder base — the classic 80/20 concentration. This cohort's spending profile (peak earnings, family spend, travel, home improvement) defines what rewards and benefits the portfolio must offer to retain them. Any rewards devaluation — reduced cashback, reduced travel points, increased annual fees — will disproportionately affect retention in this cohort.
- Businessman segment at 31.4% of revenue ($17.4M) on 14.6% interest ratio — businessmen are high-spending transactors, not revolvers. The strategic opportunity is in business-specific rewards (airline lounges, business travel, software subscriptions, expense management tools) that increase card-of-wallet share for business expenses. If Businessmen move even 20% more of their business spend to this card, the segment revenue grows by $3.5M without acquiring a single new customer.
- Doctorate holders generating near-zero revenue despite high income is a clear acquisition gap. Doctoral-level professionals (physicians, academics, lawyers, researchers) represent a high-income, stable-employment, low-default-risk demographic that this portfolio has failed to penetrate. A targeted product — premium card with education/research benefits, medical professional rewards, or academic institution partnerships — could unlock this segment without competing on generic mass-market terms.
Who This Template Is For
- Credit Card Portfolio Managers and Retail Banking Analysts who need a demographic-segmented revenue dashboard showing customer value by job type, age, income, education, marital status, and geography — with weekly time-series tracking and multi-filter capability for targeted segment analysis
- CMOs and Customer Acquisition Teams at banks and fintech companies using credit card data to identify highest-value customer segments for acquisition targeting, rewards optimization, and retention investment prioritization
- BI Developers building financial services customer analytics who need a production-ready Power BI template combining KPI cards, weekly revenue time-series, demographic bar charts, job-type revenue table, and geographic top-5 ranking with gender-toggle filtering
How to Use
- Download the PBIX file
- Open in Power BI Desktop
- Connect your credit card customer data source — the model requires a customer table with gender, card category, marital status, job type, income group, age group, education level, state, transaction type, revenue, interest earned, income, and satisfaction score fields
- Use the Gender, Card Category, Quarter, and Transaction Type filters to cross-segment all demographic visuals simultaneously; the weekly revenue timeline and job-type table update to reflect any filter combination
"The job type revenue table in this dashboard uses a native Power BI matrix. To add expandable customer segment hierarchies (Job → Income Group → Card Category), variance-to-prior-quarter columns, and traffic-light conditional formatting flagging segments below revenue or interest targets — Flexa Tables is a Microsoft-certified Power BI visual purpose-built for structured customer portfolio reporting with full drill-down and conditional formatting control."
Other Templates
 Free Sales & Revenue
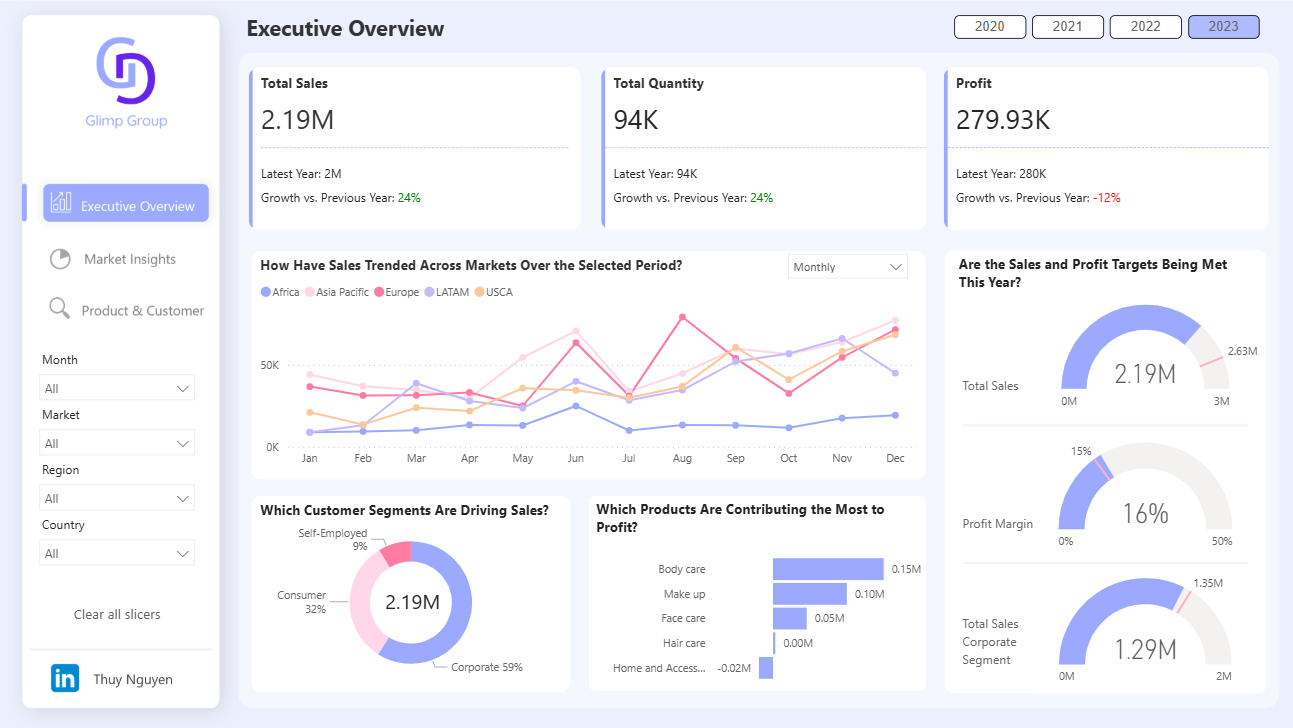
Power BI Executive Overview Dashboard Template — Global Sales & Profit Target Tracking (Free PBIX Download)
 Free Finance & Accounting
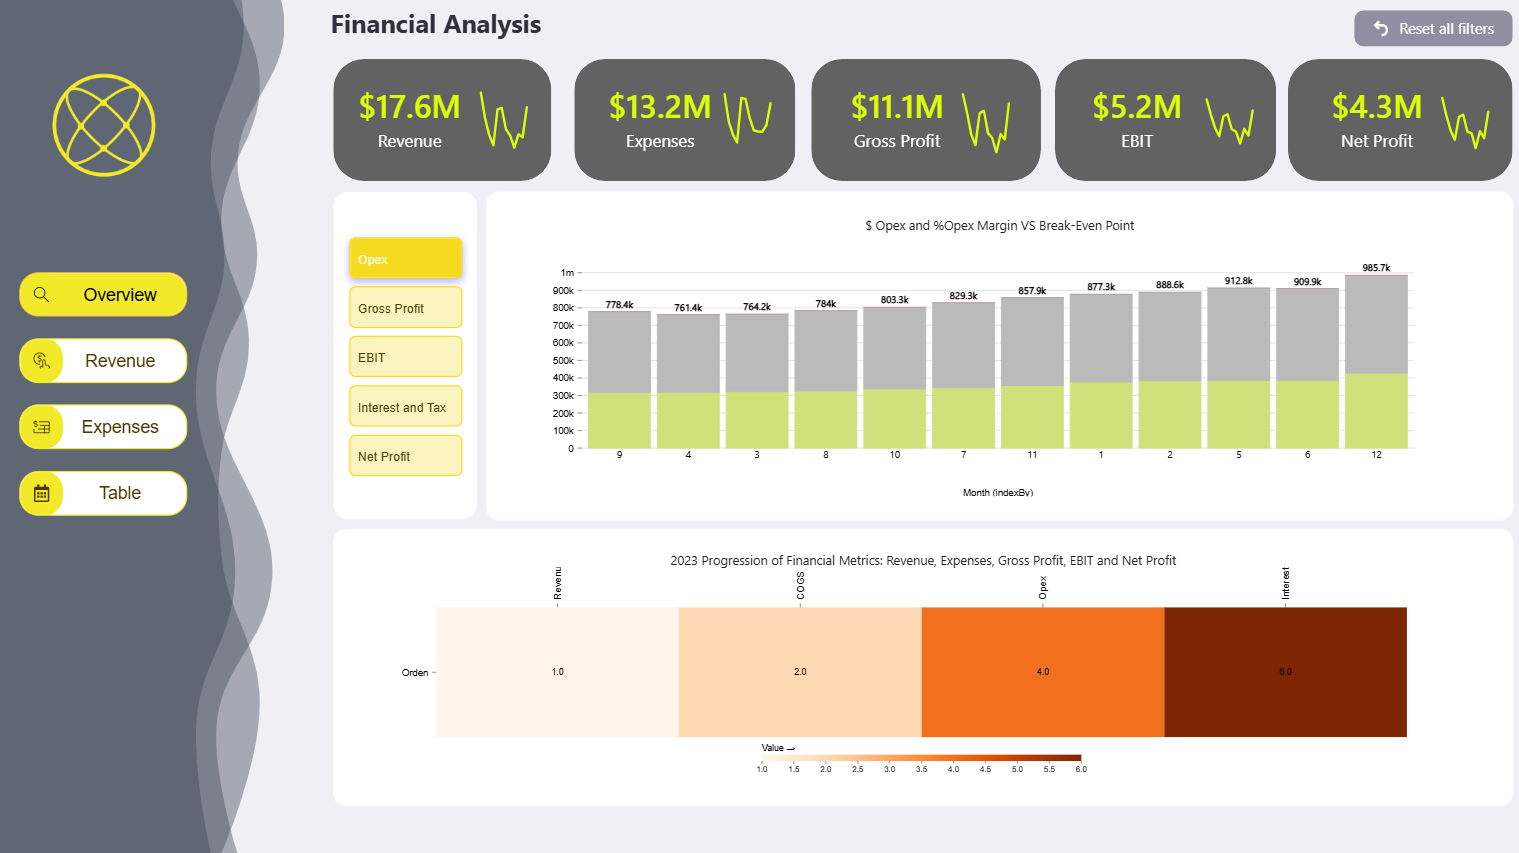
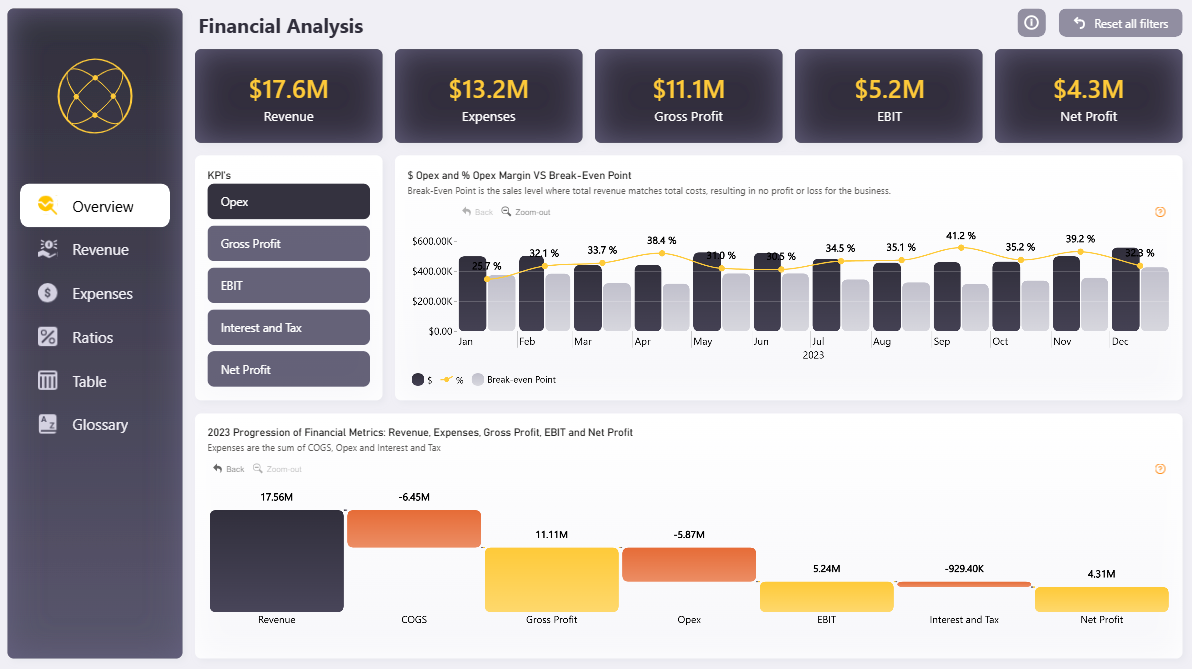
Financial Analysis Report
 Free Finance & Accounting
Power BI Financial Analysis Dashboard Template (Free PBIX Download)
If you find this website helpful, share it with friends and colleagues to boost their Power BI skills and work efficiency!
Like this site? Share it