
FP&A Dashboard – Budget, Actual & Forecast Analysis
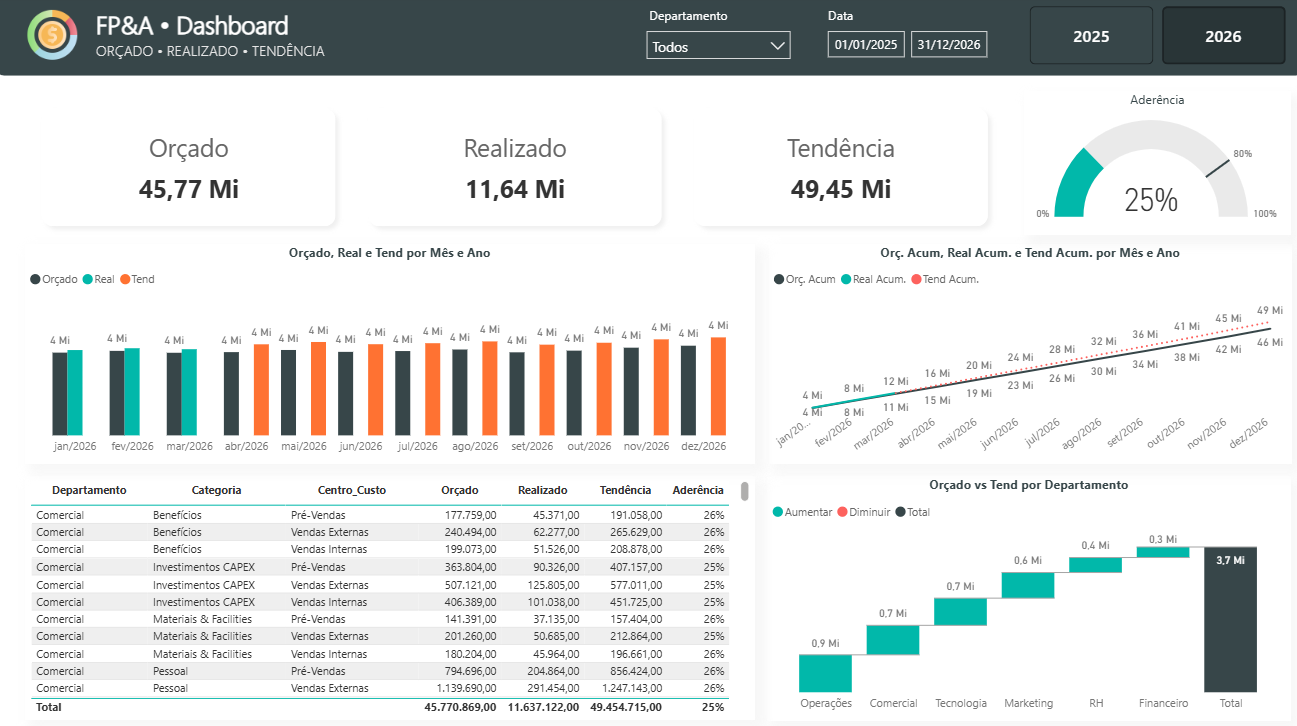
Designed for FP&A teams, finance managers and business leaders, the dashboard helps track financial performance, identify budget deviations and understand how spending is evolving throughout the year.
Key analyses included:
- Total Budget
- Actual results
- Forecast / Year-end projection
- Budget adherence percentage
- Monthly Budget vs Actual vs Forecast
- Cumulative financial performance
- Budget and forecast trends over time
- Department-level budget analysis
- Variance contribution by department
- Financial breakdown by category
- Cost center analysis
- Detailed financial performance table
- Year and department filters
The dashboard makes it easier to identify overspending, monitor budget execution and anticipate year-end financial results based on current performance trends.
Ideal for FP&A teams, Controllers, CFOs, finance departments and organizations looking to improve budgeting, forecasting and financial performance monitoring.
See more on: https://www.youtube.com/watch?v=o7WqqmTRtW0
Reviews
No reviews yet — be the first to review this template.
Other Templates
If you find this website helpful, share it with friends and colleagues to boost their Power BI skills and work efficiency!
Like this site? Share it