
Financial Performance Overview
42 Downloads

Description
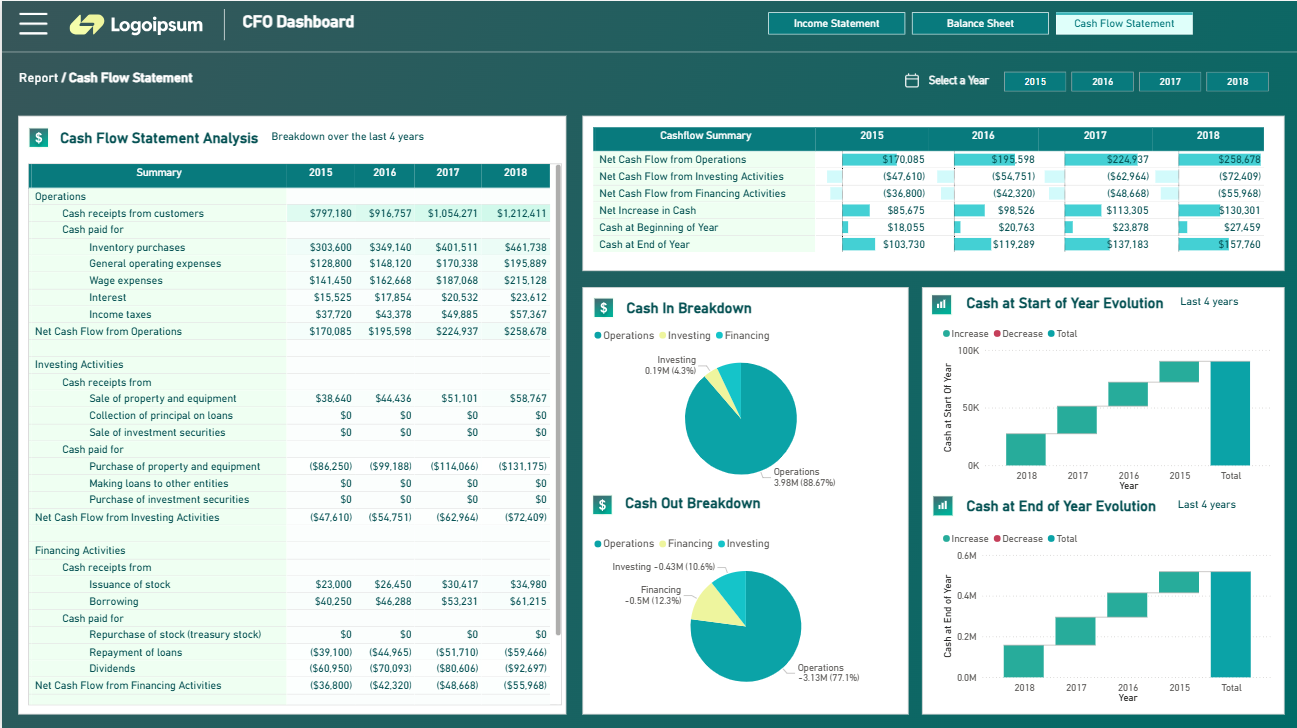
Using Microsoft Power BI, we move traditional financial reporting to modern BI dashboards and automate the reporting process, enhancing overall efficiency and reducing the time and it takes it takes to access vital finance data.
This financial dashboard consists of the following views and capabilities.
- Financial Overview
- Main KPIs to track P&L
- Dynamically switch between two period scenarios (YTD or MTD)
- Compare using dynamic benchmarks (vs Budget or vs Last year)
- Assets, liabilities and expenses summary
- Income Statement
- KPI Funnel
- Month-over-Month Trend
- Switch between graphical and table view
- Balance Sheet
- Full tabular view of balance sheet for export
Reviews
No reviews yet — be the first to review this template.
Other Templates
Free Finance & Accounting
Free Sales & Revenue

$1Finance & Accounting
If you find this website helpful, share it with friends and colleagues to boost their Power BI skills and work efficiency!
Like this site? Share it