
Power BI Supply Chain & Logistics Dashboard Examples
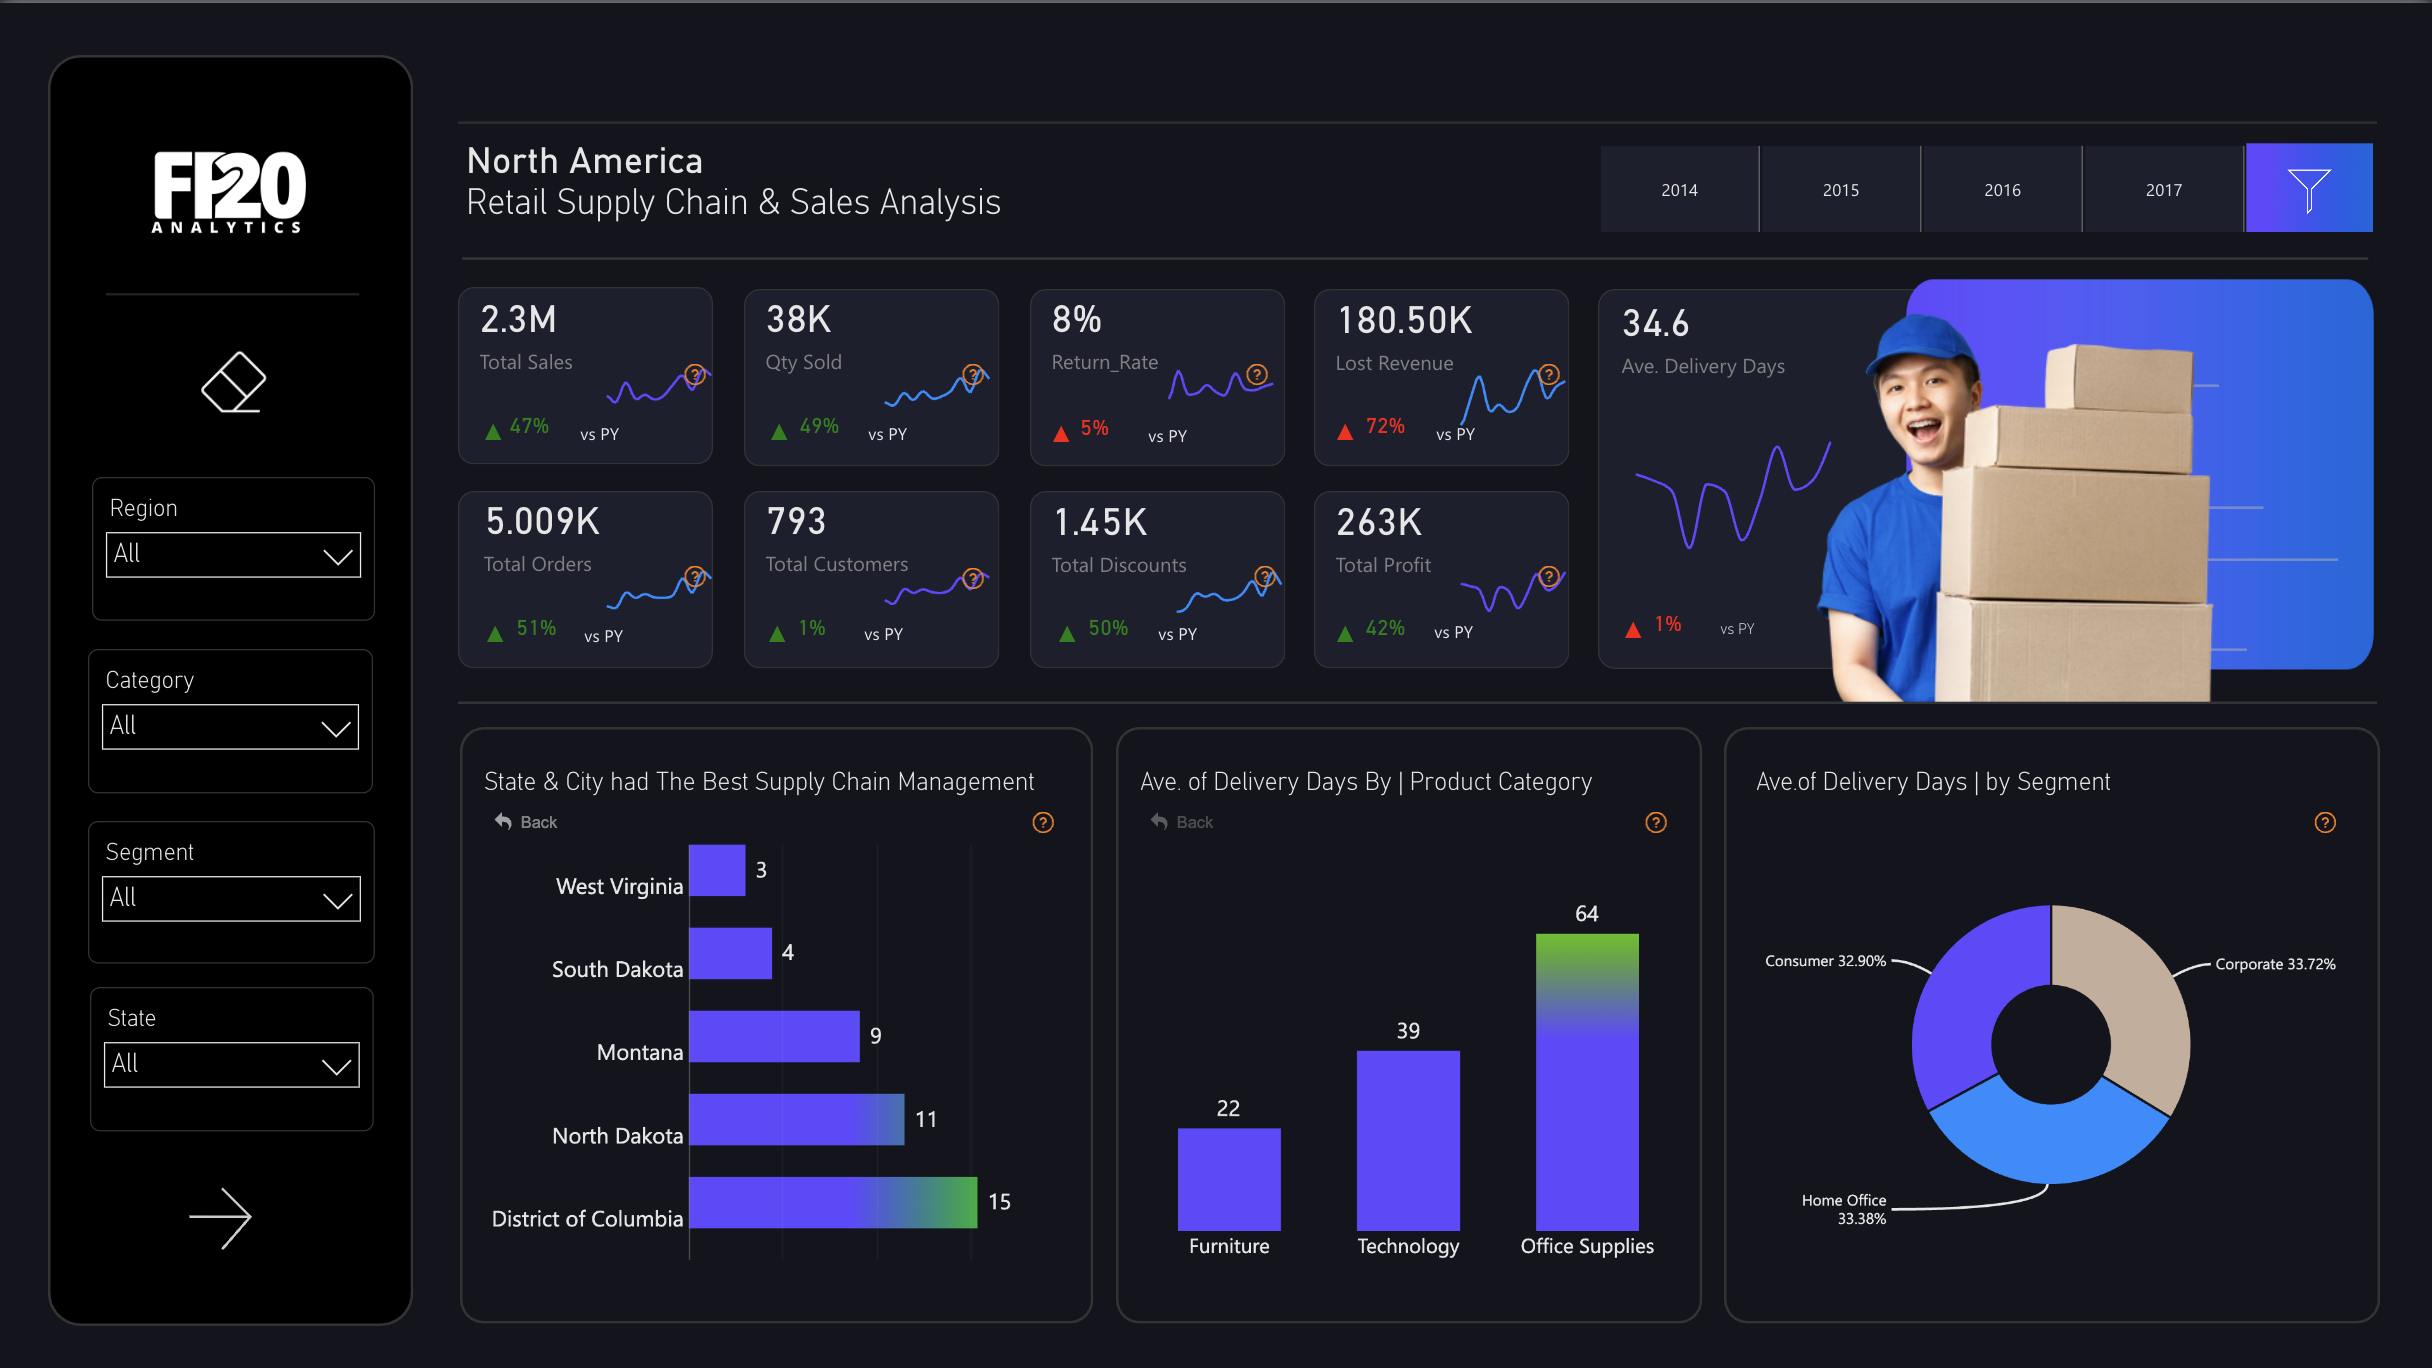
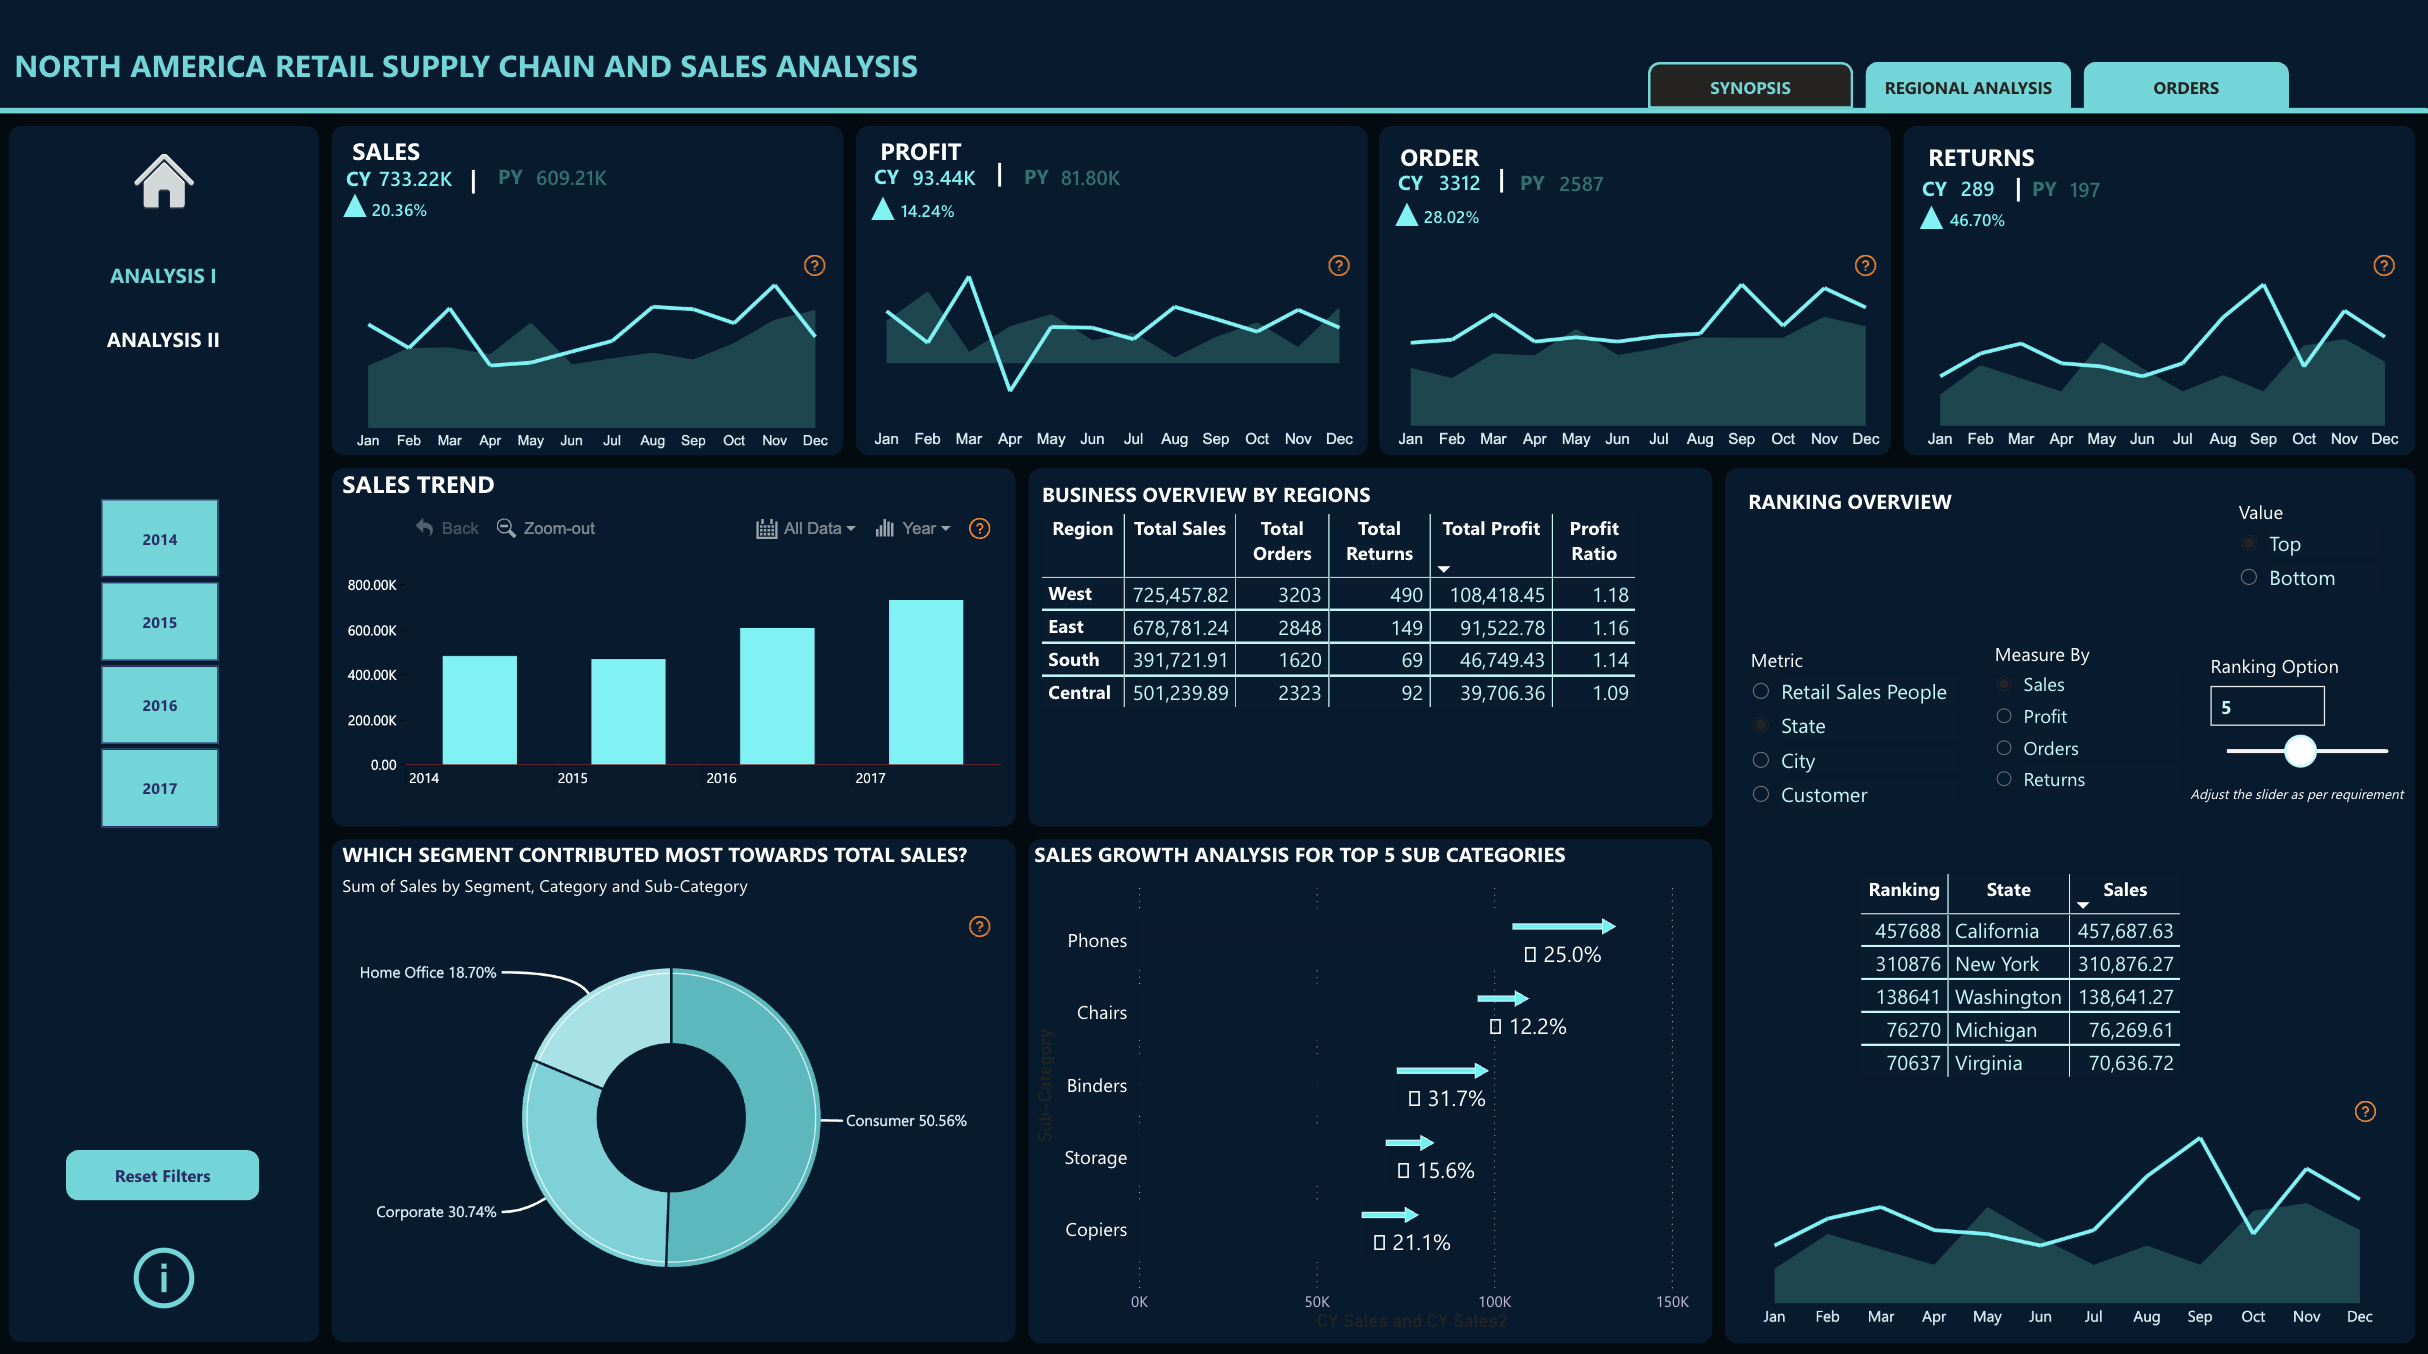
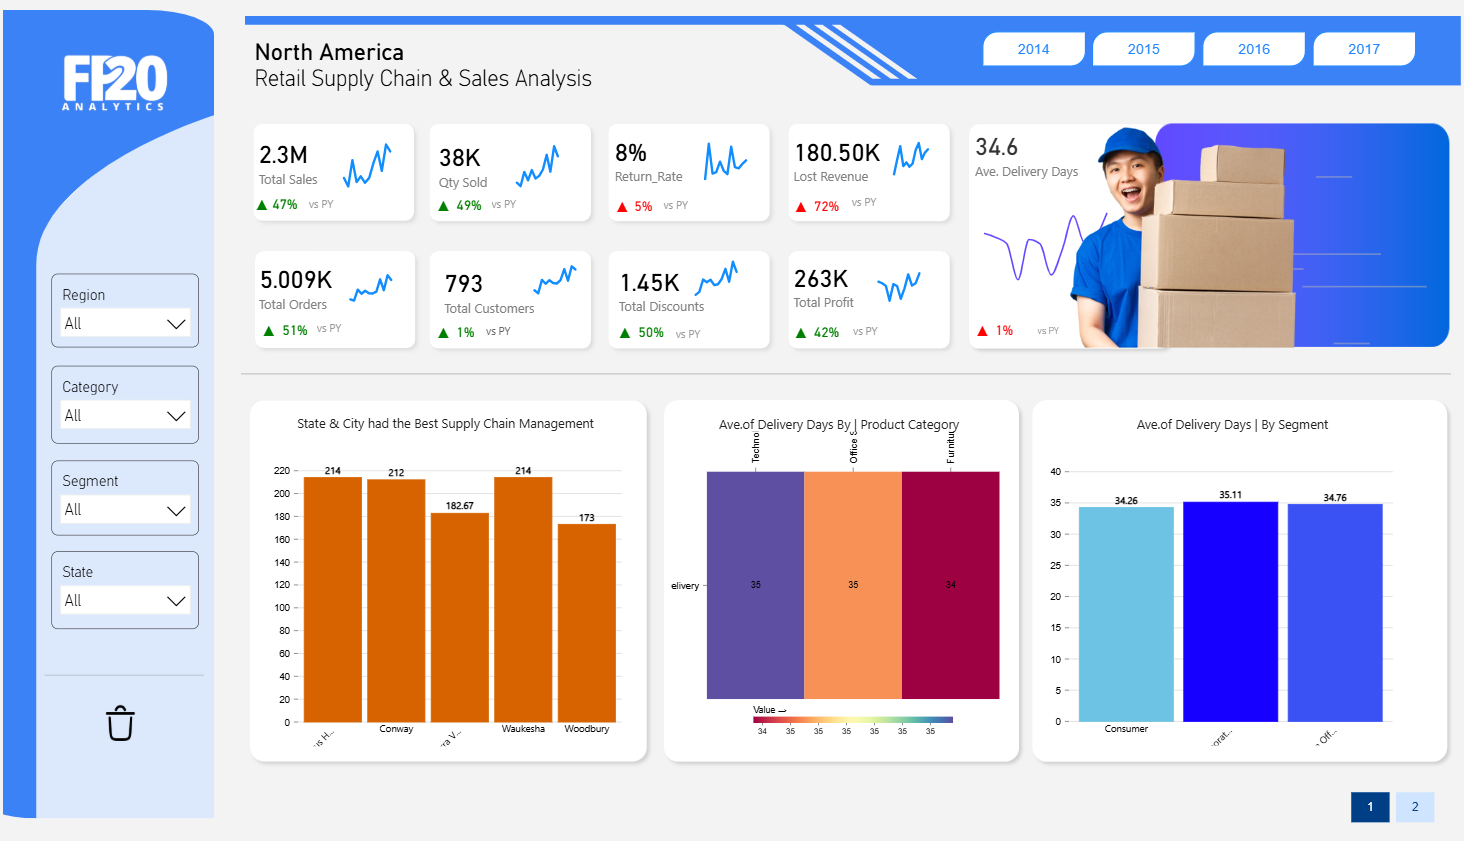
Supply chain dashboards have to reconcile volumes, lead times and service levels in one view. The templates below cover inventory positions and turnover, warehouse throughput, on-time shipping performance and procurement spend — with the slowly-changing calculations (stock on hand over time, rolling lead-time averages) already implemented.
They work well as operational review dashboards or as DAX references for inventory math that is easy to get wrong.
6 templates in Supply Chain & Logistics
Browse all templates →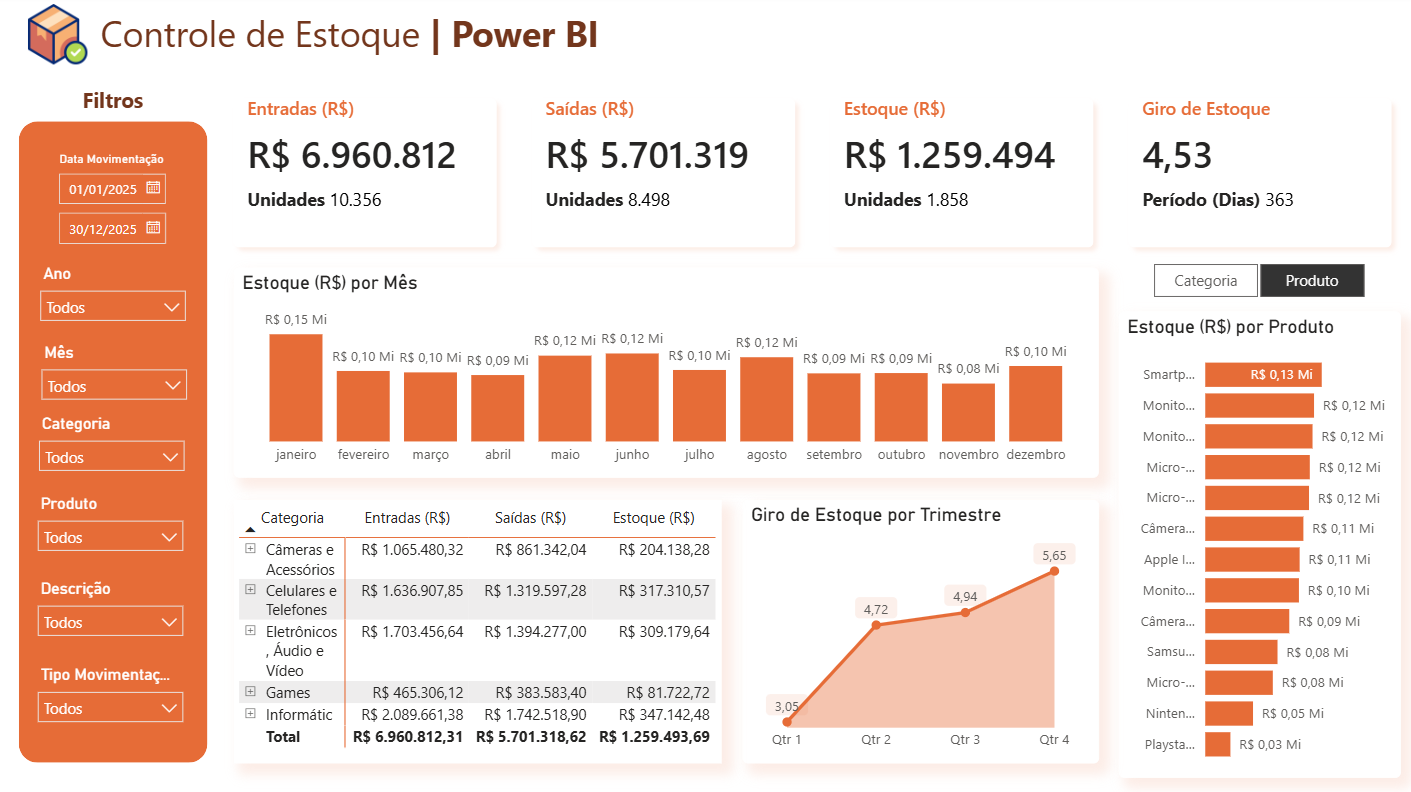
.png?alt=media&token=ec01385f-3ae6-422a-9e2f-2f4065086546)
Frequently asked questions
Do the templates handle stock-on-hand over time?
Yes — inventory templates implement the semi-additive stock measures (closing balance, average stock, turnover) that naive SUM aggregations break on.
Can I track supplier or carrier performance?
The logistics templates include on-time-in-full style measures by supplier/carrier that you can re-point at your own shipment table.
What data do I need to use these dashboards?
A movements or transactions table (receipts, issues, shipments) plus item and location dimensions. The PBIX shows the expected shape — most ERPs export it directly.