Power BI Executive Overview Dashboard Template — Global Sales & Profit Target Tracking (Free PBIX Download)
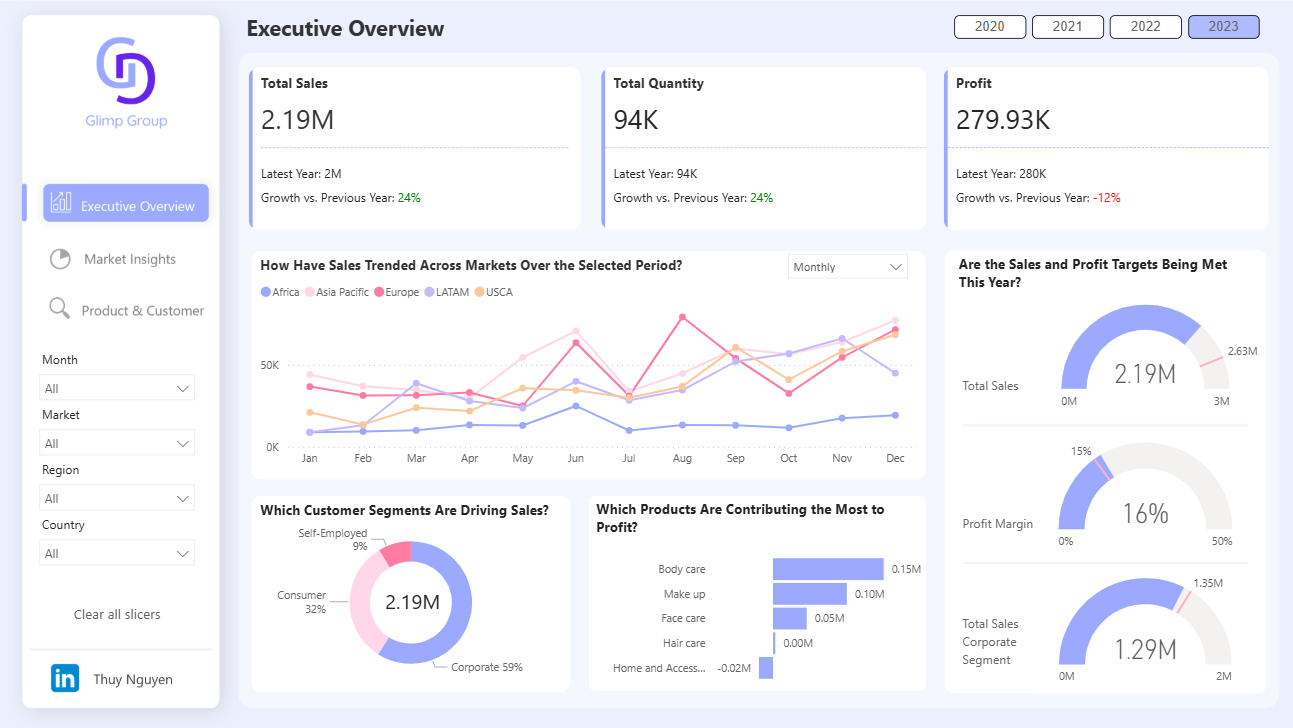
Introduction: This Power BI Executive Overview dashboard delivers a board-level view of a beauty/personal care brand's commercial performance across five global markets (Africa, Asia Pacific, Europe, LATAM, USCA) for 2023. Combining YoY growth tracking, multi-market monthly trend lines, customer segment breakdown, product profit contribution, and gauge-style target attainment visuals, it answers the three questions every executive asks in a single page: How are we growing? Who is buying? Are we hitting our targets? A three-tab structure (Executive Overview, Market Insights, Product & Customer) positions this as a full strategic reporting suite, not just a summary dashboard.
What's Inside This Template
Year Selector: 2020 | 2021 | 2022 | 2023 (active) — enables instant 4-year historical comparison by recontextualizing all visuals to the selected year.
Filters: Month | Market | Region | Country — four cascading slicers that drill from global to country-level in any combination.
Top KPI Banner — with YoY Growth
| MetricValueLatest YearGrowth vs PY | |||
| Total Sales | $2.19M | $2M | +24% ✓ |
| Total Quantity | 94K | 94K | +24% ✓ |
| Profit | $279.93K | $280K | -12% ✗ |
The simultaneous +24% revenue growth and -12% profit decline is the single most important tension in this dashboard. Sales volume is accelerating strongly — but profit is contracting. Growing revenue while shrinking profit means either: cost inflation is outpacing price increases, the business is buying growth through discounting, the product mix is shifting toward lower-margin categories, or SG&A/overhead is scaling faster than revenue. The dashboard's product profit contribution chart below begins to answer which of these is the driver.
Revenue and Quantity growing at identical rates (+24% each) confirms average selling price is flat YoY — no pricing improvement is contributing to the revenue growth. All 24% growth is pure volume expansion. In a market where costs are rising, volume-only growth without price increases is structurally margin-dilutive — which explains the -12% profit decline.
How Have Sales Trended Across Markets Over the Selected Period?
Five-line monthly chart (Jan–Dec 2023), one line per market:
| MarketPatternPeak | ||
| Europe (pink/red) | Dominant, volatile | ~$60K in Jun, ~$55K in Aug |
| LATAM (purple) | Second tier, steady climb | ~$45K by year end |
| USCA (orange) | Parallel to LATAM | ~$40K by year end |
| Asia Pacific (light pink) | Mid-range, stable | ~$30–35K |
| Africa (blue) | Lowest, flat | ~$5–10K throughout |
Europe is the dominant market by a significant margin — peaking at ~$60K in June and showing the highest volatility (large Jun and Aug spikes with dips in between). The June spike (~$60K) is approximately 6x Africa's entire monthly volume, confirming extreme geographic concentration.
Africa's near-flat line throughout 2023 at $5–10K is structurally concerning for a global beauty brand. The continent represents enormous untapped market potential — the flat line here indicates either minimal distribution investment, no commercial presence beyond token markets, or structural access barriers (logistics, regulation, pricing power). Africa's trajectory will not improve without deliberate market development investment.
LATAM and USCA converging toward $40–45K by December — both markets are growing in parallel through H2, suggesting similar demand dynamics and potentially shared distribution infrastructure or commercial strategy.
Which Customer Segments Are Driving Sales?
| SegmentShare | |
| Corporate | 59% |
| Consumer | 32% |
| Self-Employed | 9% |
Corporate at 59% of $2.19M = ~$1.29M — confirmed by the gauge chart showing "Total Sales Corporate Segment: $1.29M vs $1.35M target." The business is B2B-first: corporate buyers (salons, spas, beauty retailers, hotel chains) generate the majority of revenue, with direct-to-consumer at only 32%. This segment structure has significant implications:
- Corporate accounts have higher order values but concentrated churn risk
- Consumer at 32% provides direct brand building but lower volume per customer
- Self-employed (9%) likely represents independent beauty professionals and freelance makeup artists — a high-loyalty, word-of-mouth segment despite small revenue share
The B2B concentration (59%) makes total revenue highly sensitive to corporate account retention — losing two or three major corporate clients could create a revenue cliff that consumer growth cannot quickly offset.
Which Products Are Contributing the Most to Profit?
| ProductProfit Contribution | |
| Body Care | $0.15M |
| Make Up | $0.10M |
| Face Care | $0.05M |
| Hair Care | ~$0.00M |
| Home and Accessories | -$0.02M |
Home and Accessories is the only loss-making product category at -$0.02M. This is a critical finding: a product line that is actively destroying portfolio profit. In the context of -12% overall profit decline, every dollar of loss from Home and Accessories compounds the margin erosion from the top-line cost pressure. The category should be immediately reviewed for either repricing, range rationalization, or discontinuation.
Hair Care at near-zero profit contribution despite presumably generating meaningful revenue is the second warning signal — the category is revenue-neutral at best, meaning its COGS + SG&A consumes essentially all of its revenue. Combined with Home and Accessories, two of five product categories are failing to generate positive profit contribution.
Body Care ($0.15M) and Make Up ($0.10M) together generate $0.25M — nearly 90% of the $0.28M total portfolio profit. These two categories are the profitability engine; every other category either barely contributes or actively subtracts. If Body Care and Make Up face margin pressure (input cost increases, pricing competition), the entire portfolio profitability would collapse.
Are the Sales and Profit Targets Being Met This Year? (Gauge Charts)
Three gauge dials providing visual target attainment:
| MetricActualTargetAttainment | |||
| Total Sales | $2.19M | $2.63M | 83.3% — below target |
| Profit Margin | 16% | 15% (estimated midpoint) | Near target |
| Total Sales Corporate | $1.29M | $1.35M | 95.6% — very close |
Total Sales at 83.3% of $2.63M target — despite +24% YoY growth, the business is still $440K short of its sales target. This means the target was set for even higher growth than 24% — an ambitious target that the strong growth rate failed to meet. For a business simultaneously missing revenue targets and declining in profit, the pressure to close both gaps simultaneously creates a conflict: chasing revenue through discounting would further compress the already -12% declining profit.
Corporate Segment at 95.6% of $1.35M target ($1.29M actual) — the closest target to attainment in the portfolio. The $60K gap to corporate target is achievable within one or two mid-size account wins. Since Corporate is 59% of all revenue, closing this $60K gap would also contribute approximately $60K to the total sales gap of $440K.
Key Insights
- +24% revenue growth with -12% profit decline is a deteriorating unit economics story, not a growth story. The business is scaling volume without scaling profitability — every additional dollar of revenue is generating less profit than the previous year. If this trend continues into 2024 and beyond, the business will eventually reach a point where revenue growth consumes all margin. The product profit chart identifies Home and Accessories (-$0.02M) and Hair Care (~$0M) as the immediate surgical targets — but the root cause is likely pricing and cost structure across the full portfolio.
- Home and Accessories as the only loss-making category should be discontinued or fundamentally repriced before the next planning cycle. At -$0.02M profit contribution, it is small in absolute terms but symbolically important: a beauty brand's core adjacency categories (body, face, makeup, hair) should all be profitable. Home and Accessories is likely a range extension that dilutes commercial focus and consumes sales bandwidth without delivering margin return. Removing it would simplify the portfolio, reduce SG&A overhead, and eliminate the loss contribution.
- Europe's dominance ($60K peak monthly) against Africa's flat $5–10K creates a geographic concentration risk that the flat Africa line understates. If European demand softens due to economic headwinds (high inflation, energy costs, consumer confidence decline in 2023–2024), the portfolio has no geographic cushion. LATAM and USCA are growing but at 67–75% of Europe's peak volume. Africa, the logical next growth market for beauty brands building long-term emerging market presence, is essentially absent from commercial performance.
- Corporate at 59% ($1.29M) with only $60K gap to target is the highest-leverage near-term revenue opportunity. A single large corporate account — a hotel chain, spa network, or beauty retailer — could close the entire gap. The sales focus for Q1 2024 should be disproportionately on one or two high-value corporate prospect conversations rather than broad consumer acquisition.
- Body Care and Make Up generating 89% of portfolio profit ($0.25M of $0.28M) from presumably less than 50% of revenue confirms the classic 80/20 concentration in FMCG product portfolios. Category management investment — new SKUs, pack size innovation, pricing tier expansion — should be concentrated almost entirely in Body Care and Make Up. Hair Care and Home and Accessories are absorbing resources that would generate higher returns in the two profitable categories.
- Revenue and quantity growing at identical rates (+24%) with flat ASP means the pricing power problem is structural, not cyclical. A beauty brand with genuine brand equity should be able to grow ASP 3–5% annually through new product launches, premiumization, and channel mix improvement. Flat ASP across a full year of 24% volume growth suggests either: the brand is competing primarily on price, product innovation is not driving premium uptick, or the corporate segment is negotiating flat-or-declining per-unit pricing as a condition of volume commitments.
Who This Template Is For
- CEOs and Commercial Directors at beauty, personal care, or consumer goods brands managing multi-market international portfolios who need a single executive page showing YoY growth, market trend comparison, segment mix, product profitability, and target attainment without requiring drill-through navigation
- Finance and Strategy Analysts building annual performance reviews that combine revenue, profit, and target attainment in a visually compelling format — replacing static PowerPoint slides with an interactive Power BI report filterable by market, region, and country
- BI Developers building executive reporting suites for B2B/B2C hybrid brands who need a three-tab architecture (Executive Overview, Market Insights, Product & Customer) with gauge-style target dials, multi-market line chart, customer segment donut, and product profit contribution horizontal bar in a single cohesive layout
How to Use
- Download the PBIX file
- Open in Power BI Desktop
- Connect your sales data source — the model requires a transactions table with date, market, region, country, customer segment (Corporate/Consumer/Self-Employed), product category, revenue, quantity, cost, and profit fields; target values require a separate targets table linked by year and metric
- Use the Year selector (2020–2023) to compare across four years; use Month, Market, Region, and Country slicers to drill from global summary to country-level detail; navigate to Market Insights and Product & Customer tabs for deeper analytical views
"The product profit contribution chart and customer segment breakdown in this dashboard use native Power BI bar charts and donuts. To display your full product and segment matrix as a structured table — with market columns, YoY variance rows, profit contribution per segment per market, and conditional formatting flagging loss-making categories — Flexa Tables is a Microsoft-certified Power BI visual built for exactly this kind of multi-dimensional executive financial reporting."
Other Templates
 Free Sales & Revenue
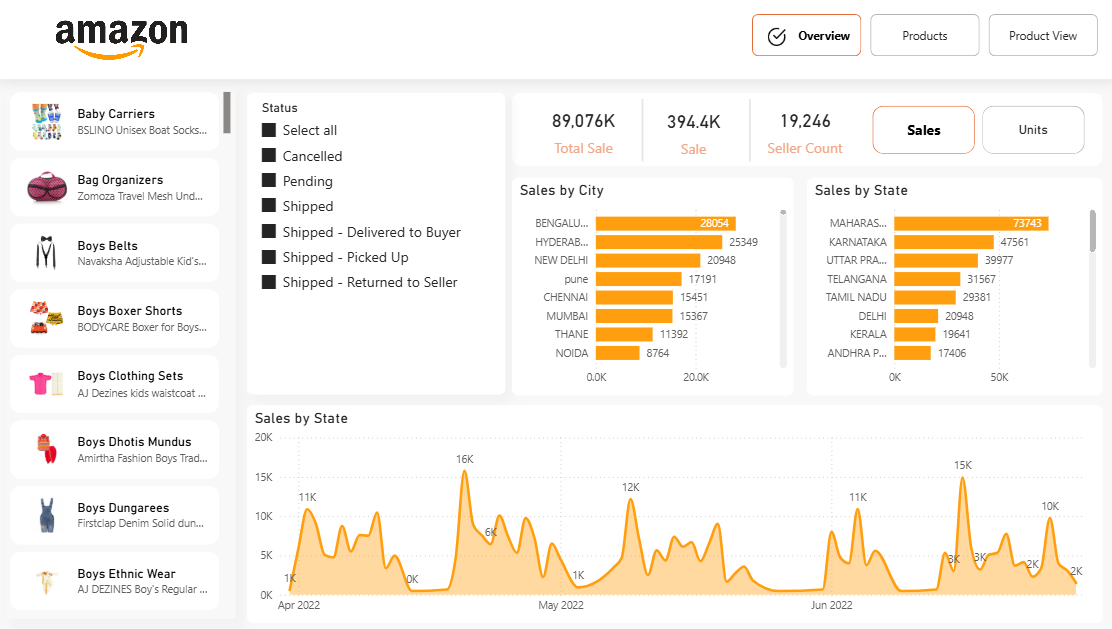
Power BI Amazon India E-Commerce Sales Dashboard Template (Free PBIX Download)
 Free Sales & Revenue
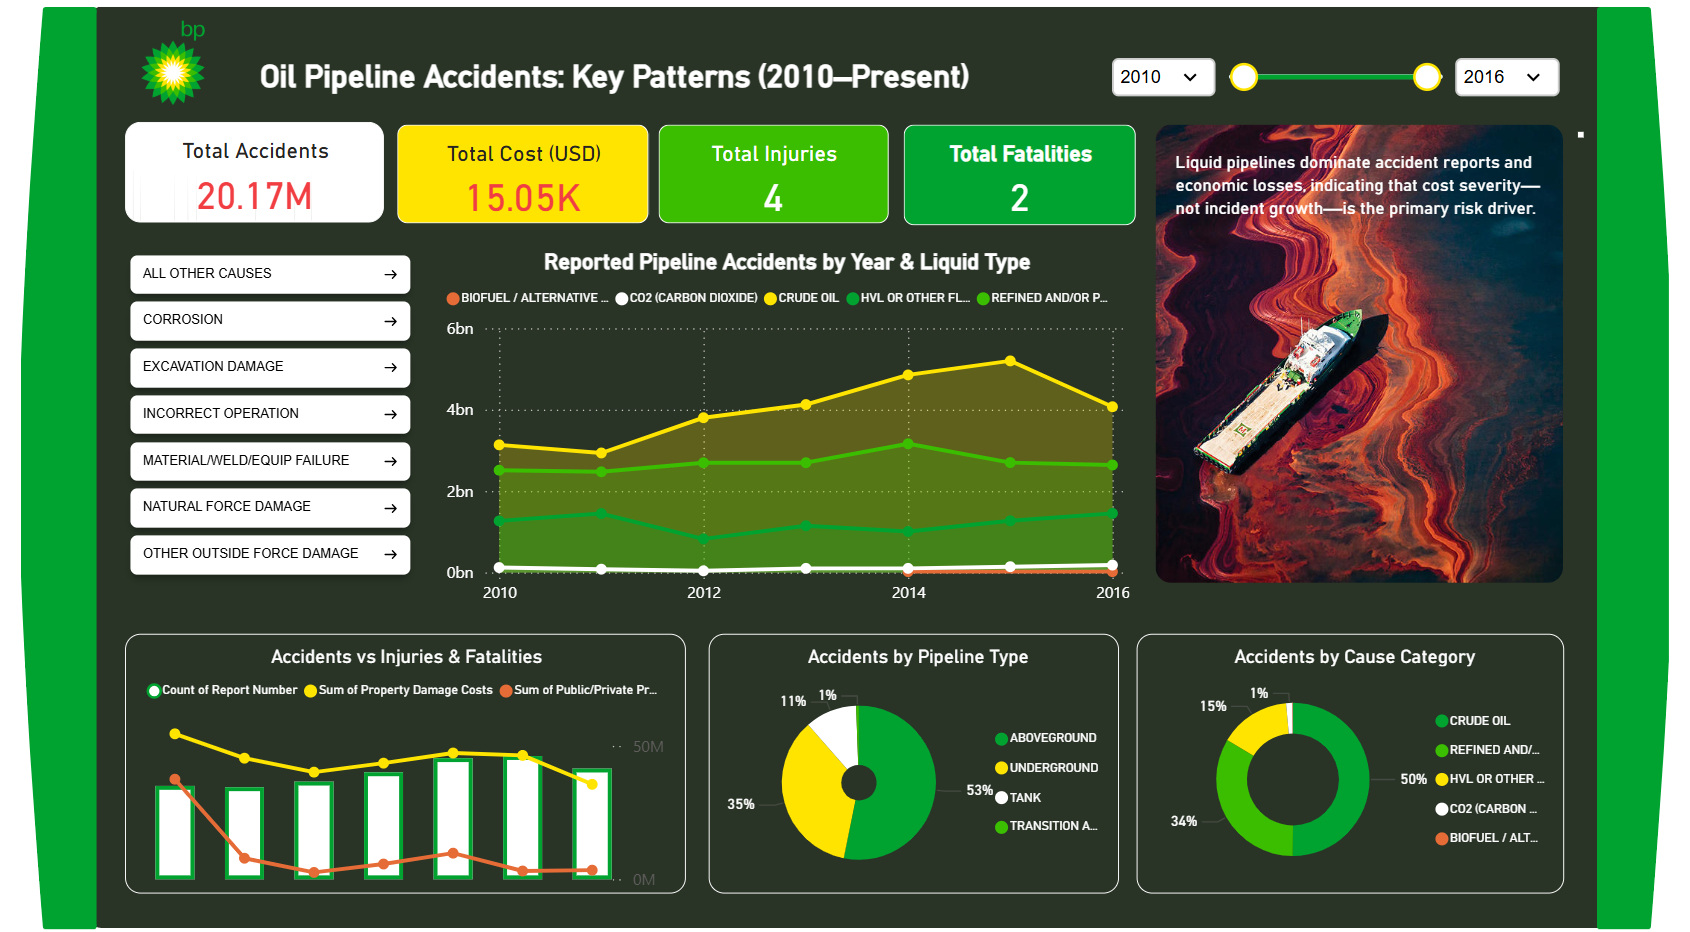
BP Oil Pipeline Accidents: Key Patterns (2010–Present) – Key Insights
 Free Finance & Accounting
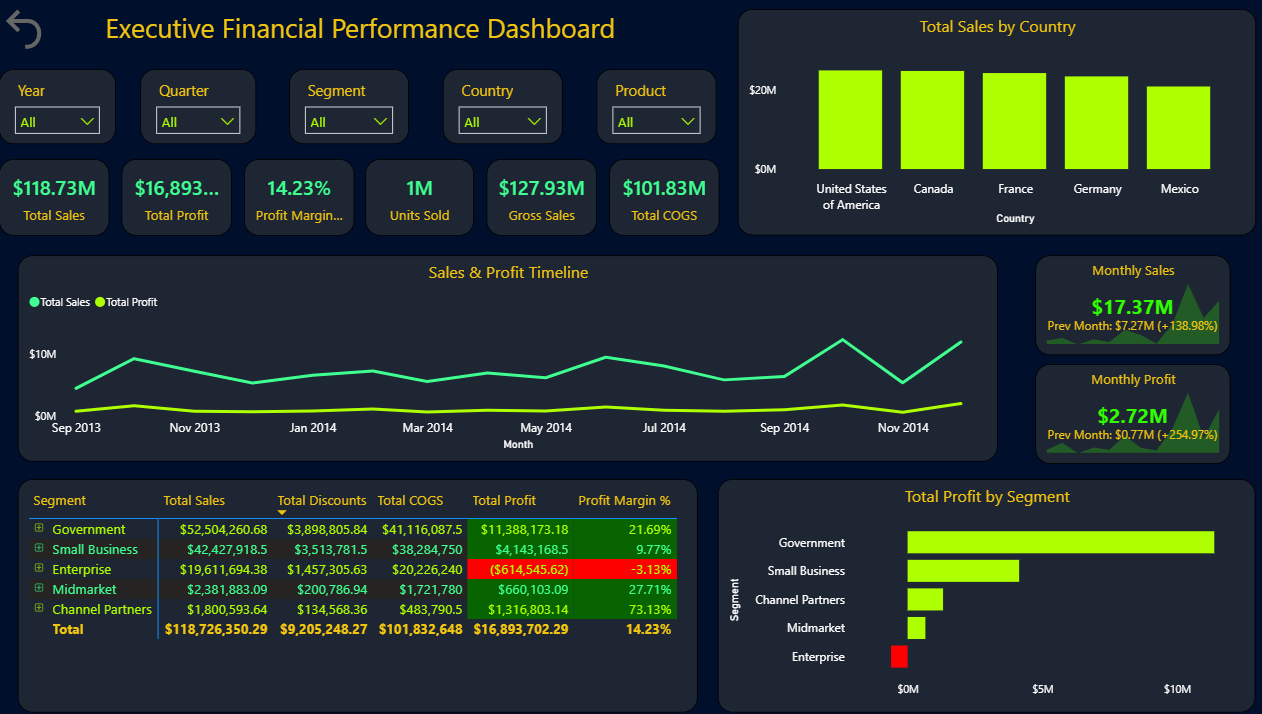
Power BI Executive Financial Performance Dashboard Template (Free PBIX Download)
If you find this website helpful, share it with friends and colleagues to boost their Power BI skills and work efficiency!
Like this site? Share it