Power BI Profit & Loss Dashboard Template (Free PBIX Download)
Introduction: This free Power BI P&L dashboard template gives finance teams a complete view of business performance across trading, operating, and non-operating accounts — all in a single page. Built for multi-country, multi-year reporting, it lets analysts slice revenue, costs, and profit margins instantly without rebuilding reports from scratch.
What's Inside This Template
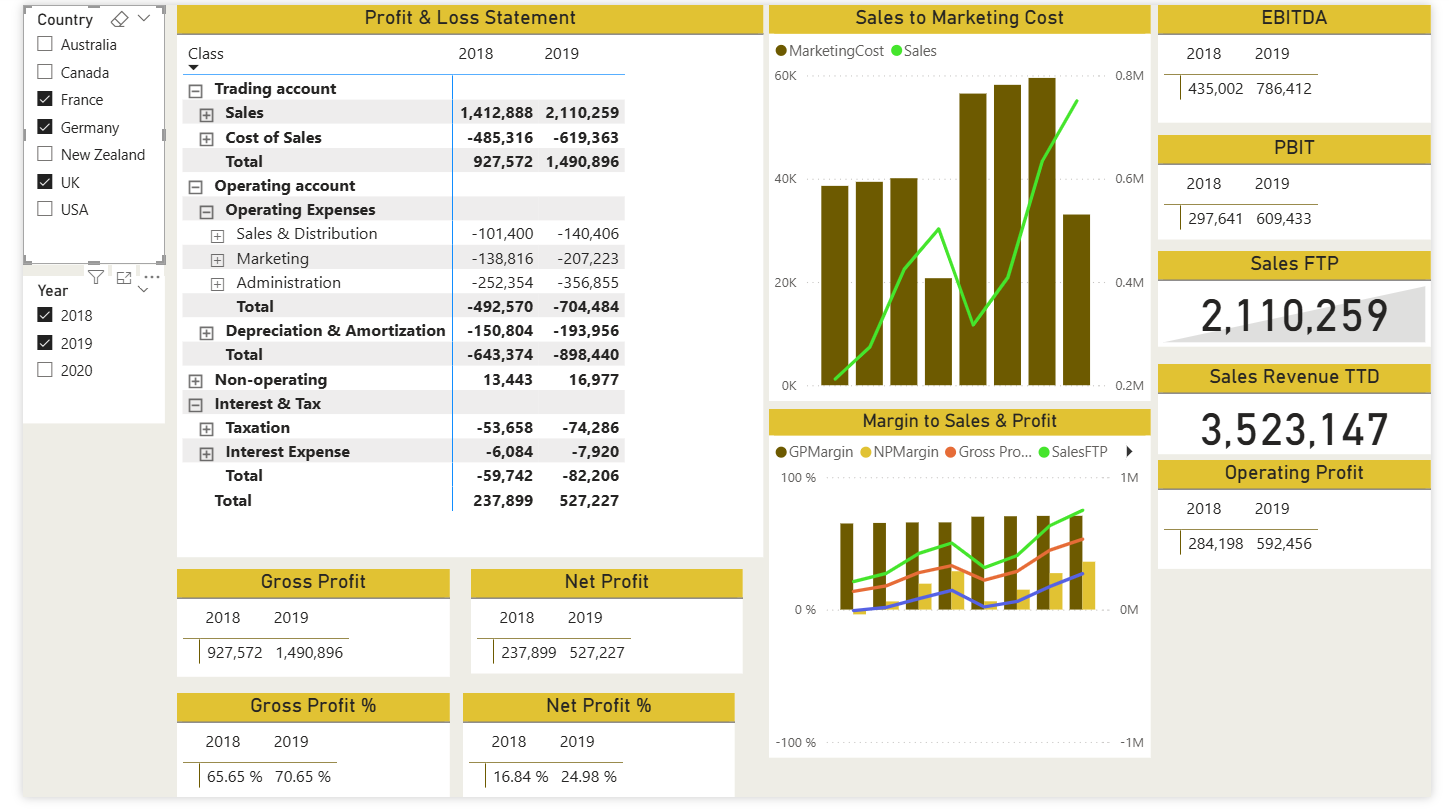
Profit & Loss Statement Table The core visual is a hierarchical P&L matrix covering the full income statement structure:
- Trading Account — Sales revenue and Cost of Sales, calculating Gross Profit
- Operating Account — Operating Expenses broken down into Sales & Distribution, Marketing, and Administration; plus Depreciation & Amortization
- Non-operating & Interest/Tax — captures items below operating profit for a clean path to Net Profit
The table supports drill-down by expanding/collapsing account groups, with 2018 vs 2019 side-by-side for instant year-over-year comparison.
KPI Cards (Right Panel) Six KPI cards give executives a snapshot without reading the table:
- EBITDA: 435,002 (2018) → 786,412 (2019) — +80.8% growth
- PBIT: 297,641 → 609,433 — profit before interest and tax nearly doubled
- Sales FTP: 2,110,259 — full-period sales figure
- Sales Revenue TTD: 3,523,147 — cumulative revenue to date
- Operating Profit: 284,198 → 592,456 — +108% YoY, the strongest growth signal in the dashboard
- Gross Profit / Net Profit: side-by-side cards with absolute values
Sales to Marketing Cost Chart A dual-axis combo chart overlays Marketing Cost (bars) against Sales revenue (line). The 2019 data shows sales accelerating sharply while marketing spend grows at a slower pace — indicating improving marketing efficiency and ROI in the back half of the year.
Margin Trend Chart Four margin lines tracked over time:
- Gross Profit Margin
- Net Profit Margin
- Operating Margin (Gross Pro...)
- Sales FTP margin
The chart reveals margin compression in mid-year followed by recovery — useful for identifying which cost category drove the dip.
Gross Profit % and Net Profit %
- Gross Profit Margin improved from 65.65% to 70.65% — a 5-point gain, signaling better cost of goods control or favorable product mix
- Net Profit Margin jumped from 16.84% to 24.98% — nearly 8 points, meaning the business became significantly more efficient at converting revenue to bottom-line profit in 2019
Key Insights From the Data
- Revenue grew 49% YoY (1.41M → 2.11M) but Net Profit grew 121% (237K → 527K) — expenses scaled slower than revenue, which is the ideal operating leverage story.
- Operating Expenses increased 43% (-492K → -704K) against 49% revenue growth — management kept opex growth below revenue growth, which drove margin expansion.
- Marketing spend rose 49% (-138K → -207K), exactly in line with revenue growth — neither over-investing nor under-investing relative to sales output.
- EBITDA margin went from ~30.8% to ~37.3% — a business moving from growth phase into profitability optimization.
- The country filter (France, Germany, UK selected; Australia, Canada, New Zealand, USA excluded) shows this is a multi-region business — the template supports instant country-level P&L slicing without DAX modification.
Who This Template Is For
- Finance Analysts who need a ready-to-use P&L structure they can connect to their own data source in minutes
- CFOs and Finance Managers presenting monthly/annual performance to leadership without needing a BI developer
- Accountants moving from Excel-based P&L reports to interactive Power BI dashboards
How to Use This Template
- Download the PBIX file
- Open in Power BI Desktop
- Replace the sample data source with your own (Excel, SQL, or any supported connector)
- The hierarchy, KPI cards, and charts update automatically
"Want to add dynamic pivoting and variance analysis to your P&L report? Explore Flexa Tables — a Microsoft-certified Power BI visual built for financial reporting."
Other Templates
 Free Finance & Accounting
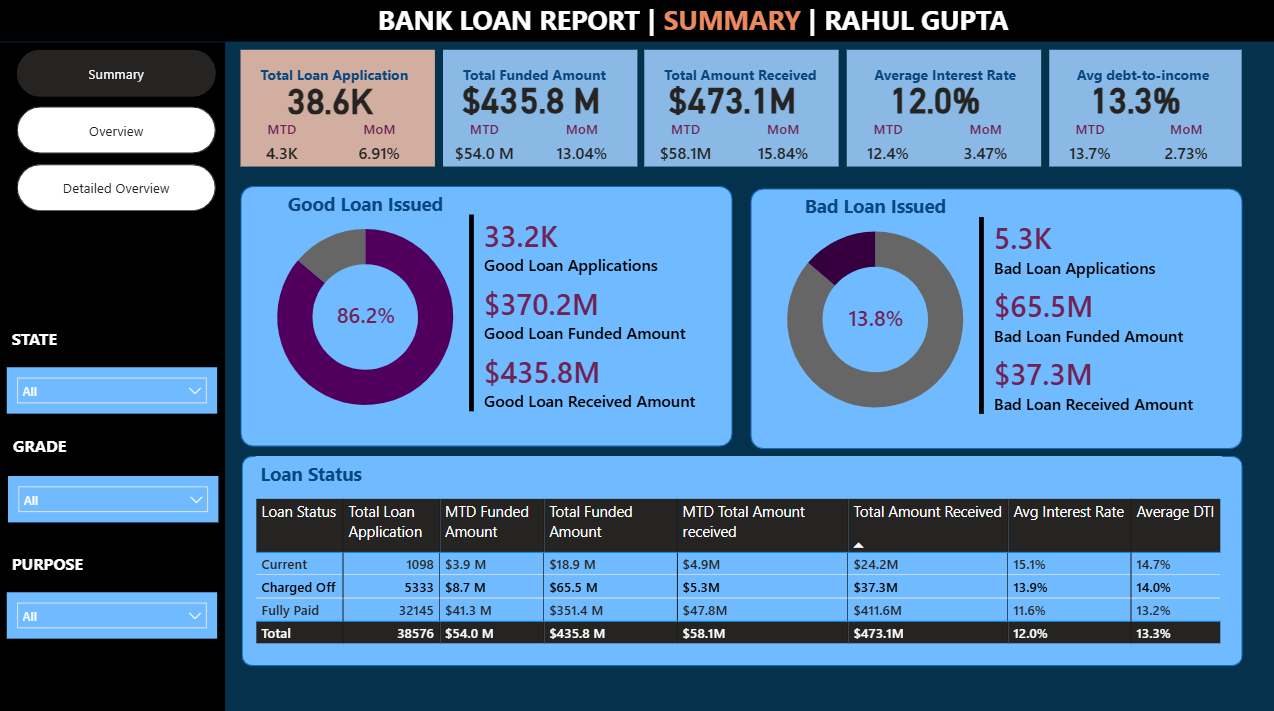
Power BI Bank Loan Report Dashboard Template (Free PBIX Download)
 Free Finance & Accounting
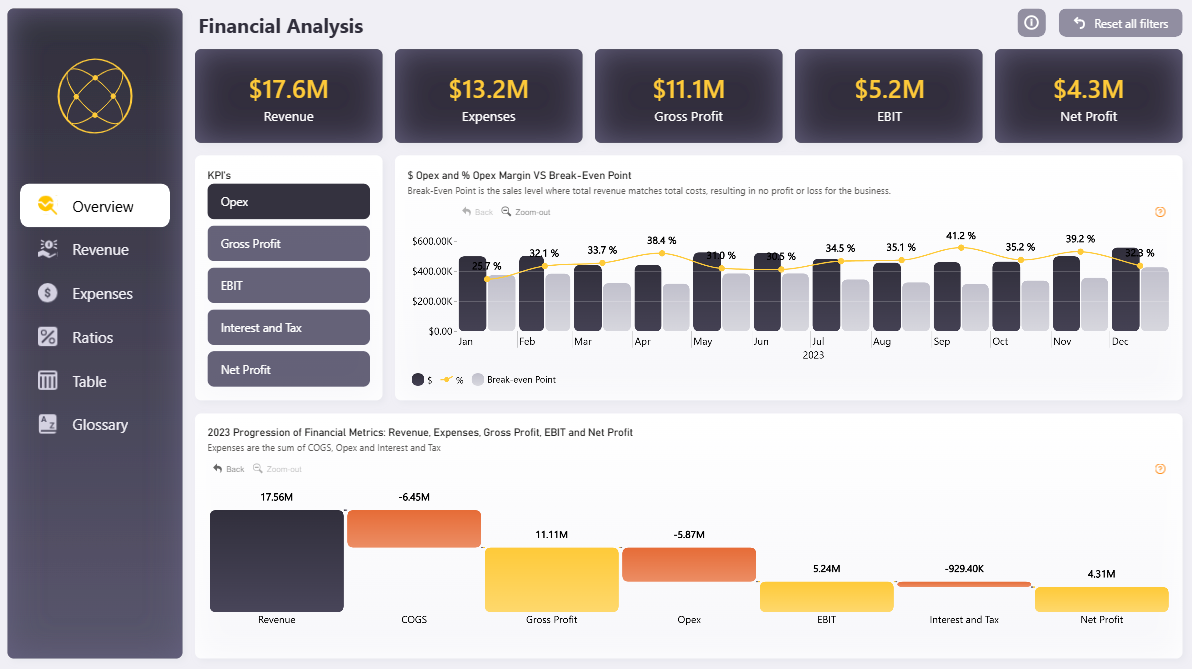
Power BI Financial Analysis Dashboard Template (Free PBIX Download)
 Free Sales & Revenue
Power BI Sales Dashboard with Variance Analysis — Contoso BI Template (Free PBIX Download)
If you find this website helpful, share it with friends and colleagues to boost their Power BI skills and work efficiency!
Like this site? Share it