Financial Analysis Report
1835 Downloads
Description
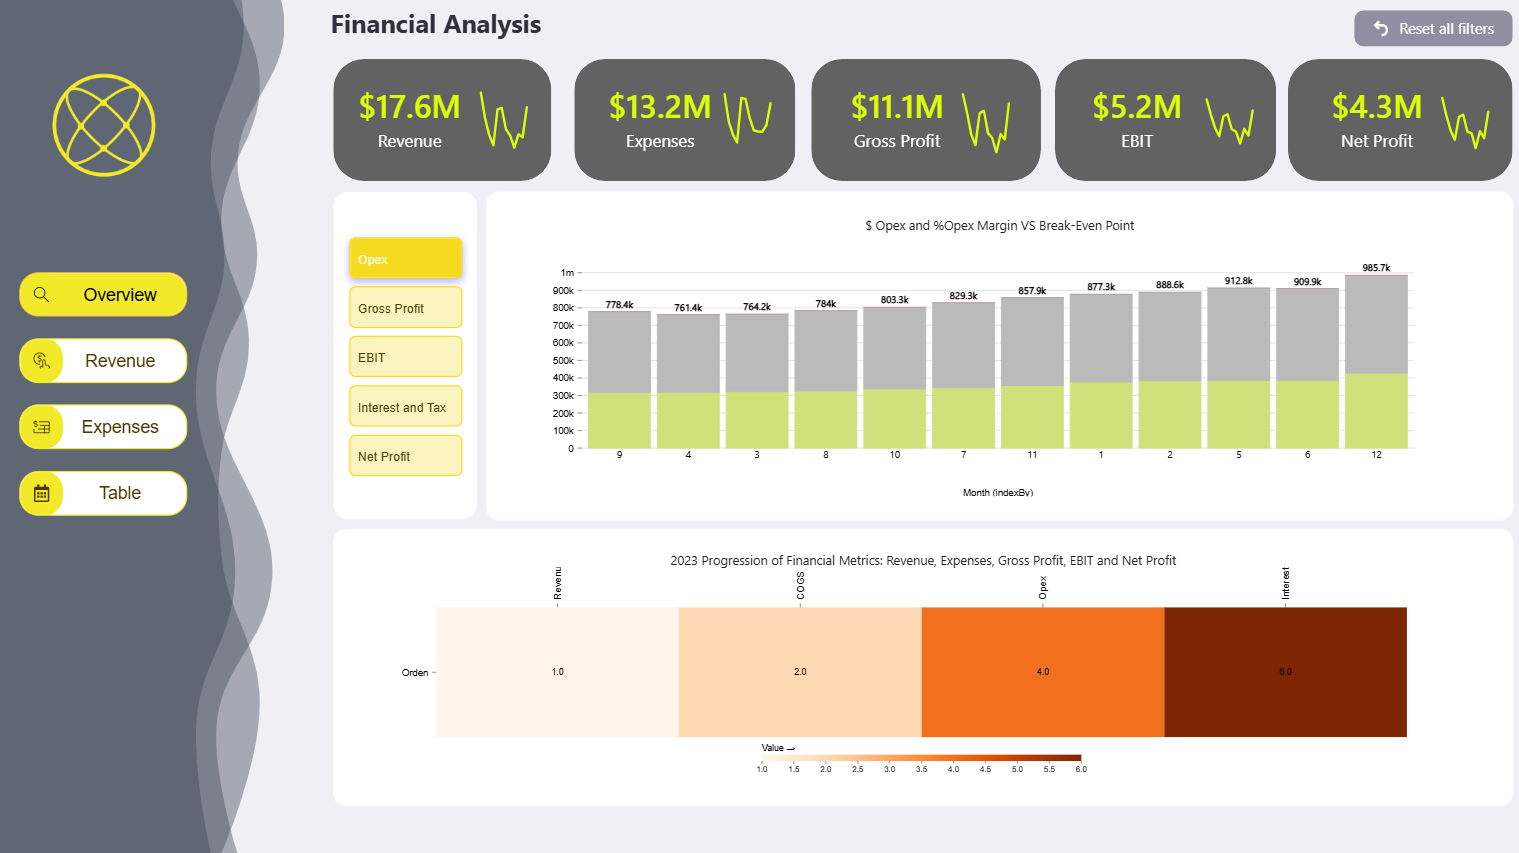
The financial analysis dashboard provides the following insights for 2023:
- Revenue: $17.6M, showing a fluctuating trend over the year.
- Expenses: $13.2M, with a similar variable pattern.
- Gross Profit: $11.1M, indicating a consistent margin after expenses.
- EBIT: $5.2M, reflecting operational profitability with some volatility.
- Net Profit: $4.3M, the final profit after all deductions, also showing variability.
- Opex & %Opex Margin vs Break-Even Point: Operating expenses range from 778K to 985K across months, with %Opex margins generally exceeding the break-even point, peaking at 985K in month 12.
- 2023 Progression of Financial Metrics:
- Revenue: 1.0 (moderate).
- COGS: 2.0 (significant).
- Expenses: 4.0 (high).
- Interest & Tax: 0.0 (minimal).
- Net Profit: 0.6 (moderate).
The dashboard is designed using Flexa Design, Flexa Tables, and Flexa Charts from Flexa Intel.
Other Templates
 Free Finance & Accounting
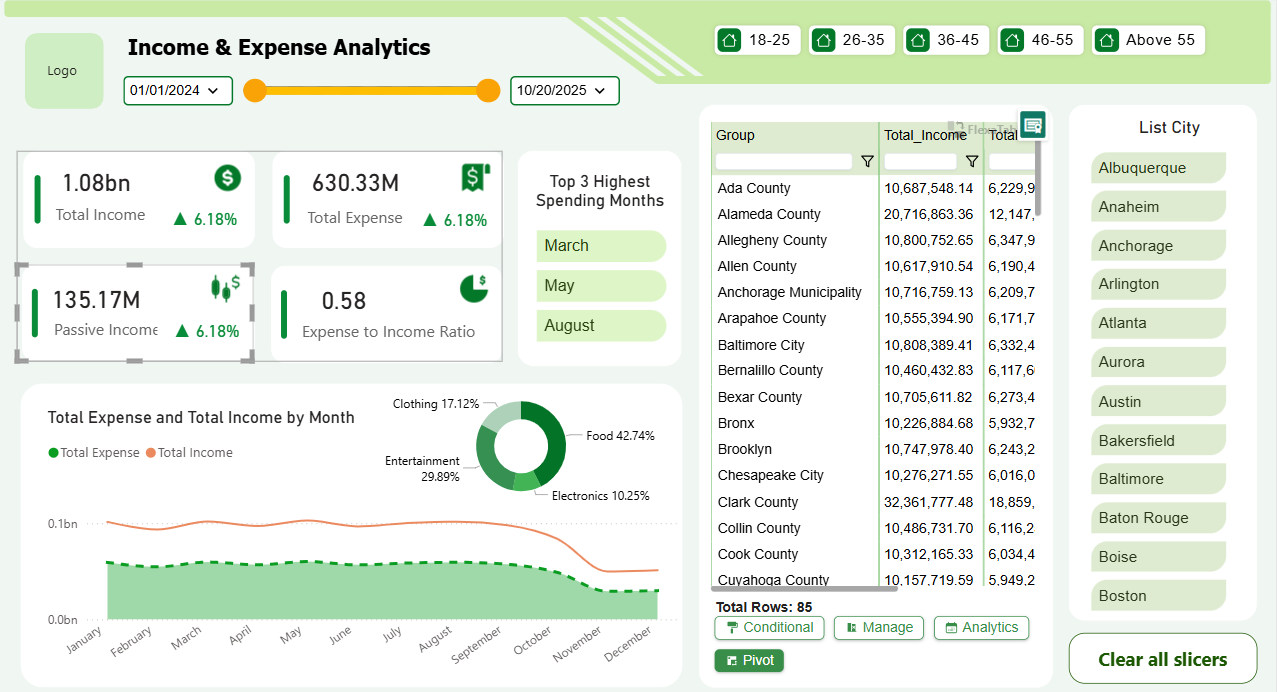
Income & Expense Analytics Dashboard – Key Insights (Jan 1, 2024 – Oct 20, 2025)
1.2k
 Free Sales & Revenue
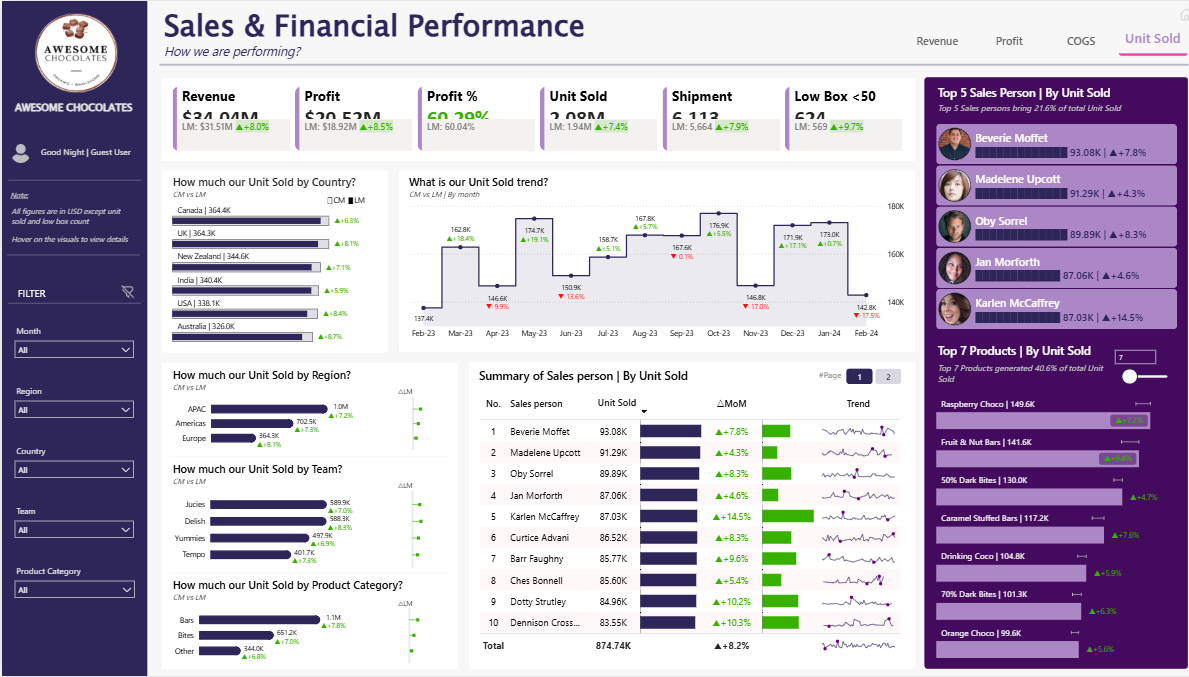
Power BI Sales & Financial Performance Dashboard Template — FMCG Retail Analytics (Free PBIX Download)
100
 Free Finance & Accounting
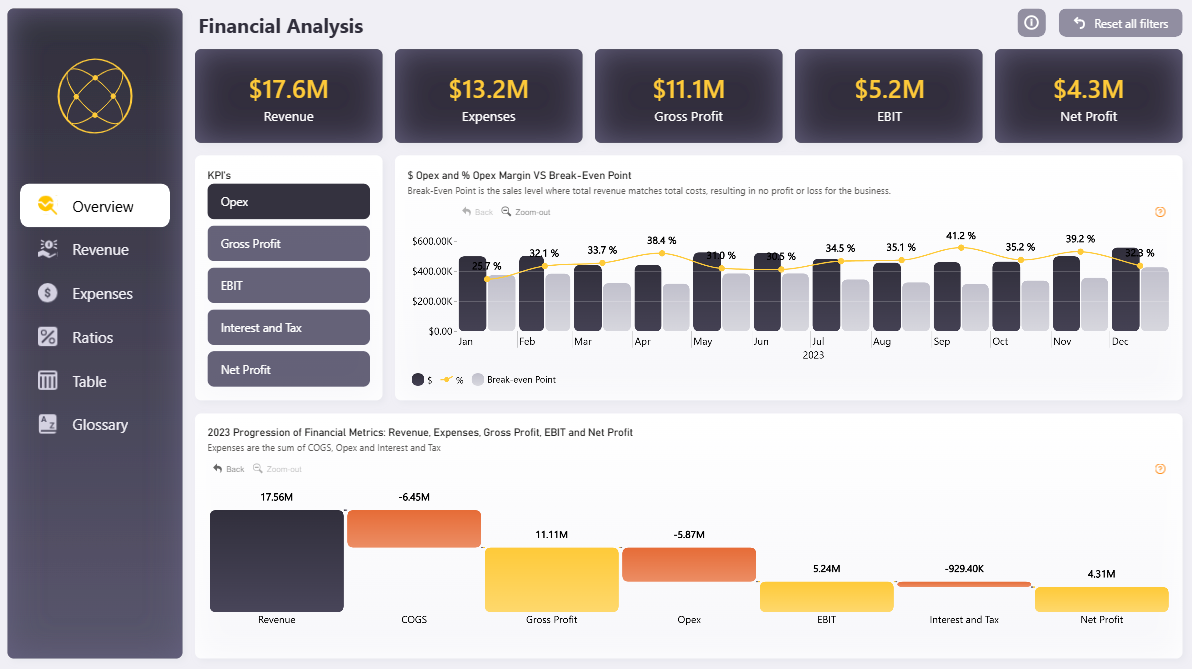
Power BI Financial Analysis Dashboard Template (Free PBIX Download)
120
If you find this website helpful, share it with friends and colleagues to boost their Power BI skills and work efficiency!
Like this site? Share it