
Power BI Executive Dashboard Examples
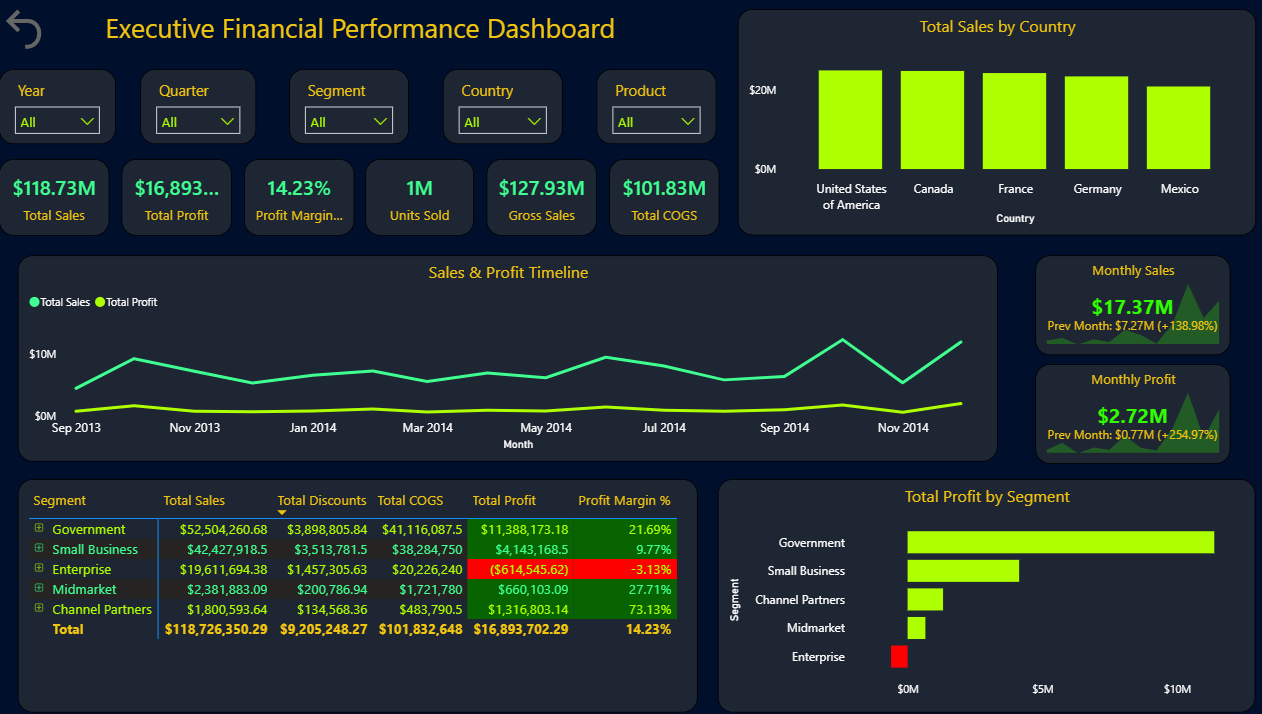
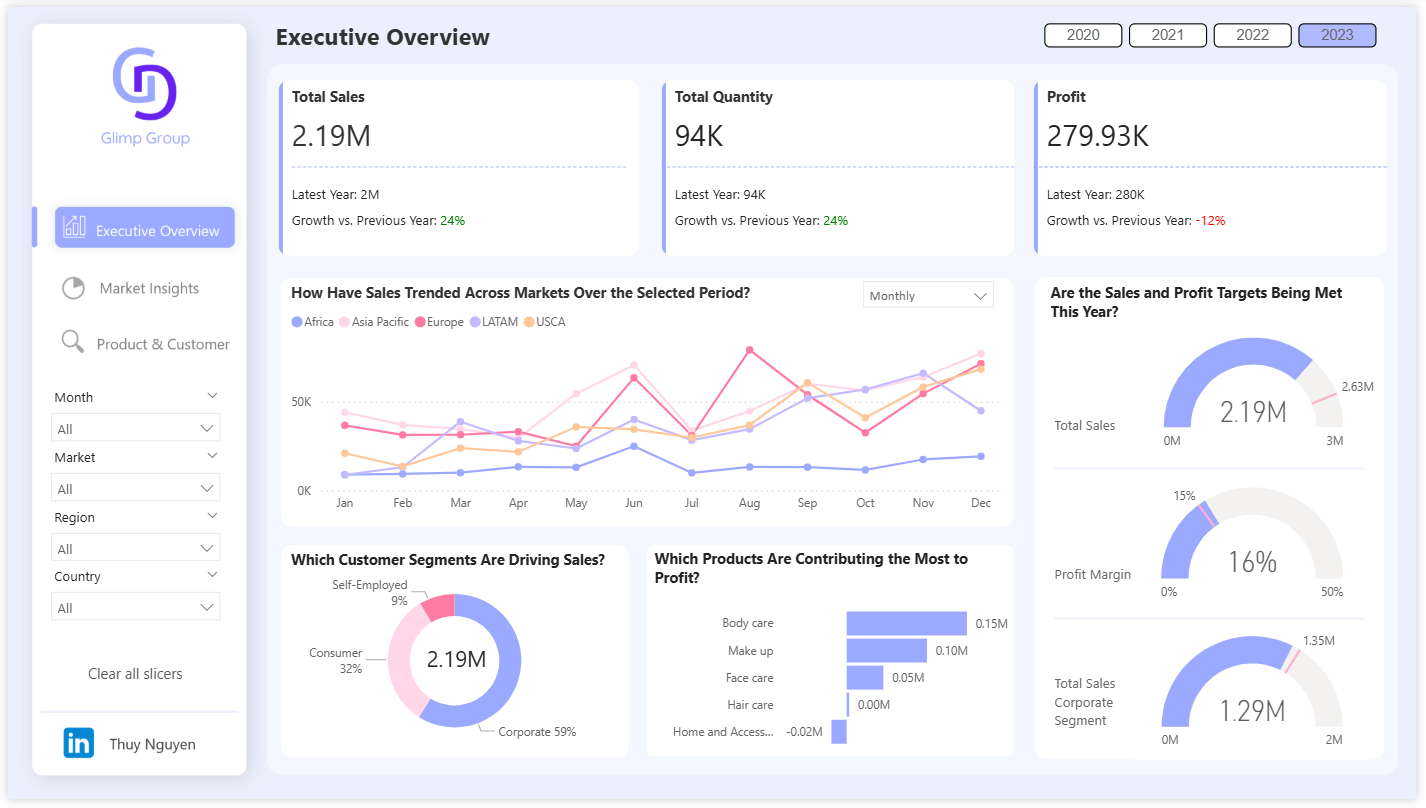
An executive dashboard earns its place by answering "are we on track?" in ten seconds — and surviving the follow-up drill-down. These templates ship C-level KPI overviews, cross-functional scorecards and financial summaries with disciplined layouts: few numbers, clear targets, consistent period comparisons.
They are deliberately restrained designs you can extend, rather than dashboards crammed with every visual Power BI offers.
4 templates in Executive / C-Level
Browse all templates →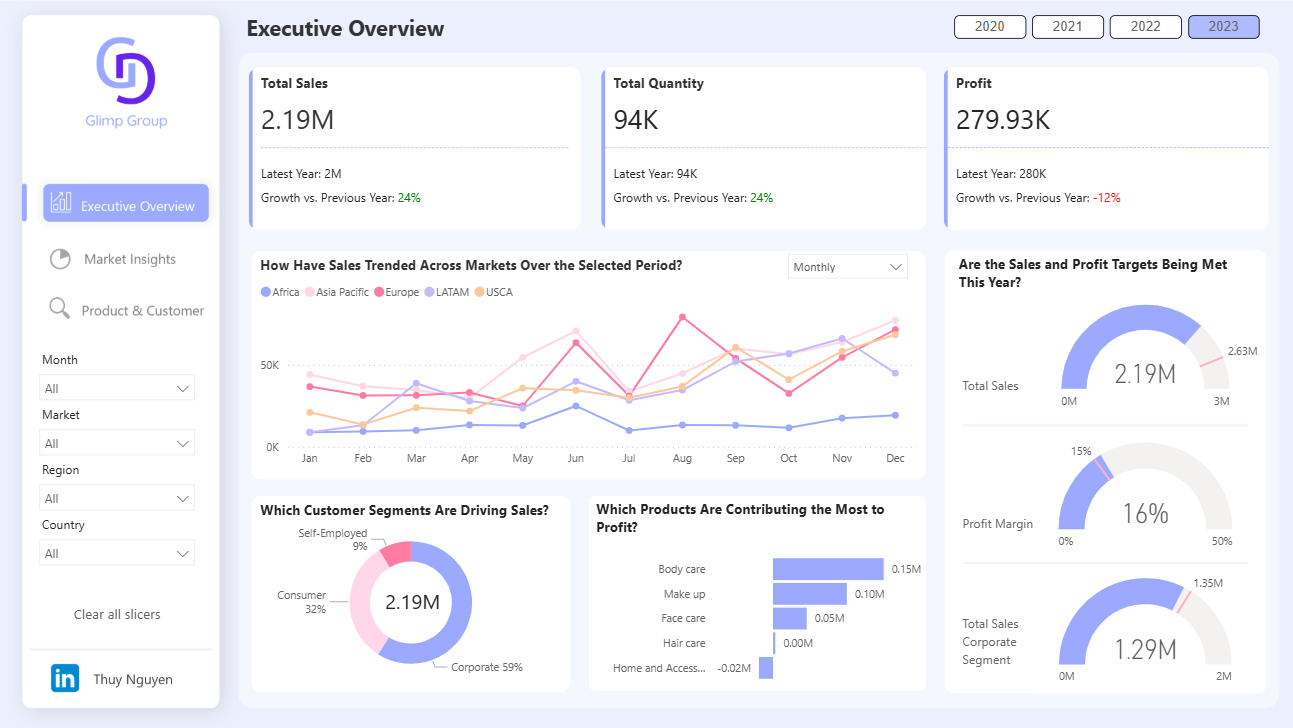
Frequently asked questions
What KPIs do the executive templates include?
Revenue, margin, cash, headcount and a customizable scorecard block — each with target, prior-period and trend context. Swap in the KPIs your leadership actually reviews.
Can each executive see only their business unit?
Yes — the models are RLS-ready: add row-level security roles on the org dimension and one report serves every unit with filtered data.
How do I keep an executive dashboard fast?
The templates pre-aggregate heavy tables and keep visuals per page low — patterns worth keeping when you extend them. Import mode with incremental refresh covers most exec-reporting scales.