NextEra Energy: Shifting Power – Global Renewable Energy Transition Dashboard Insights (2003–2024)
927 Downloads
Description
Overall Growth and Current Capacity
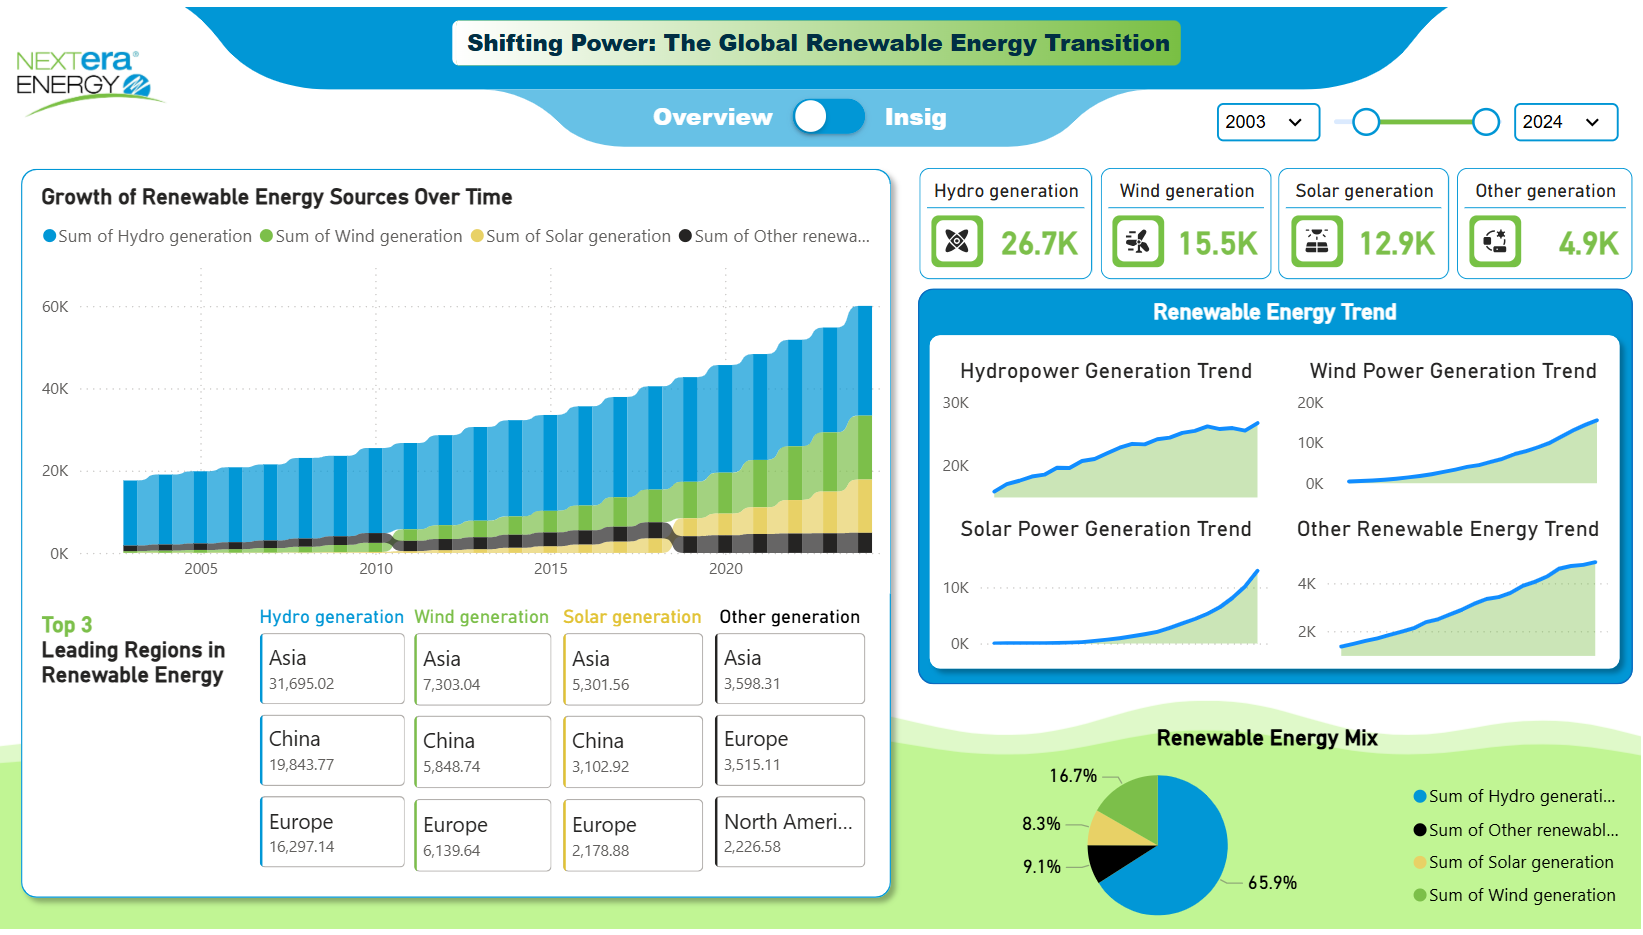
- Total Renewable Generation Capacity: ~55K (likely GW or similar unit) by 2024.
- Hydro: 26.7K (48%)
- Wind: 15.5K (28%)
- Solar: 12.9K (23%)
- Other renewables (bio, geo, etc.): 4.9K (9%)
- Stacked area chart shows steady exponential growth since ~2010, with hydro historically dominant but wind and solar rapidly closing the gap.
Renewable Energy Mix (Current Share)
- Hydro: 65.9% (still the largest single source)
- Wind: 16.7%
- Solar: 9.1%
- Other: 8.3% → Despite fastest growth in wind and solar, hydro remains the backbone of global renewables.
Individual Source Trends
- Hydropower: Long-established, steady growth with a plateau in recent years.
- Wind Power: Strong linear growth, accelerating post-2015.
- Solar Power: Classic exponential curve – slow until ~2015, then sharp takeoff.
- Other Renewables: Gradual but consistent increase.
Top Leading Regions (by Capacity)
| Rank | Hydro | Wind | Solar | Other |
| 1 | Asia (31.7K) | Asia (7.3K) | Asia (5.3K) | Asia (3.6K) |
| 2 | China (19.8K) | China (5.8K) | China (3.1K) | Europe (3.5K) |
| 3 | Europe (16.3K) | Europe (6.1K) | Europe (2.2K) | North America (2.3K) |
→ Asia (especially China) completely dominates across all renewable categories. → Europe is a strong second in most sources, particularly wind and “other”.Key Takeaways
- Asia/China Leadership: The global renewable transition is overwhelmingly driven by Asia, with China alone accounting for a massive share in hydro, wind, and solar.
- Diversifying Mix: While hydro still dominates (66%), wind + solar now represent ~26% and are growing fastest – signaling a shift toward variable but scalable sources.
- Exponential Late Bloomers: Solar and wind have driven most of the growth since 2015, reflecting falling costs and policy support.
- Regional Concentration: Unlike fossil fuels (spread across Middle East, Russia, US), renewables are heavily concentrated in Asia, creating new geopolitical/energy-security dynamics.
Recommendations
- Investment Focus: Prioritize wind and solar projects in Asia (especially China partnerships) for highest growth impact, while maintaining hydro assets for baseload stability.
- Policy Advocacy: Support continued subsidies and grid upgrades for variable renewables to accelerate the ongoing shift away from hydro dominance.
- Risk Mitigation: Diversify beyond Asia-heavy exposure by boosting Europe and North America wind/solar pipelines.
- Technology Push: Scale storage solutions (batteries, pumped hydro) to complement rapid wind/solar growth and ensure grid reliability.
Overall: The global renewable sector is in strong exponential growth phase, led decisively by Asia/China, with wind and solar rapidly gaining ground on traditional hydro dominance – a clear sign of successful cost declines and policy effectiveness in the energy transition.
Other Templates
 Free Sales & Revenue
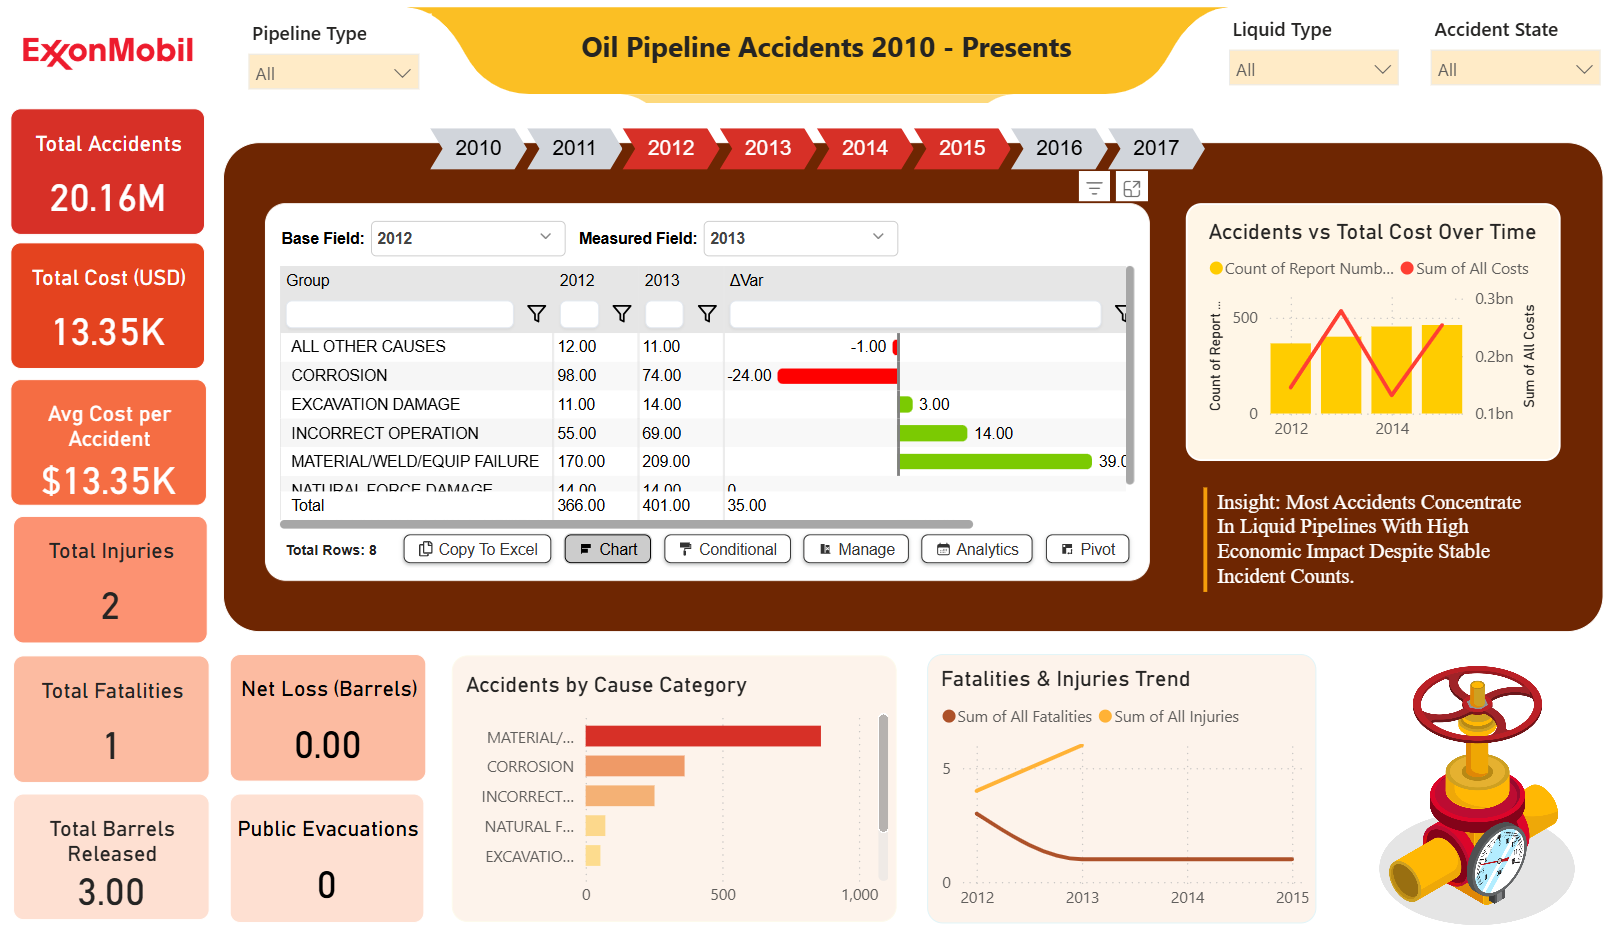
ExxonMobil Oil Pipeline Accidents Dashboard (2010–Present) – Key Insights
921
 Free Sales & Revenue
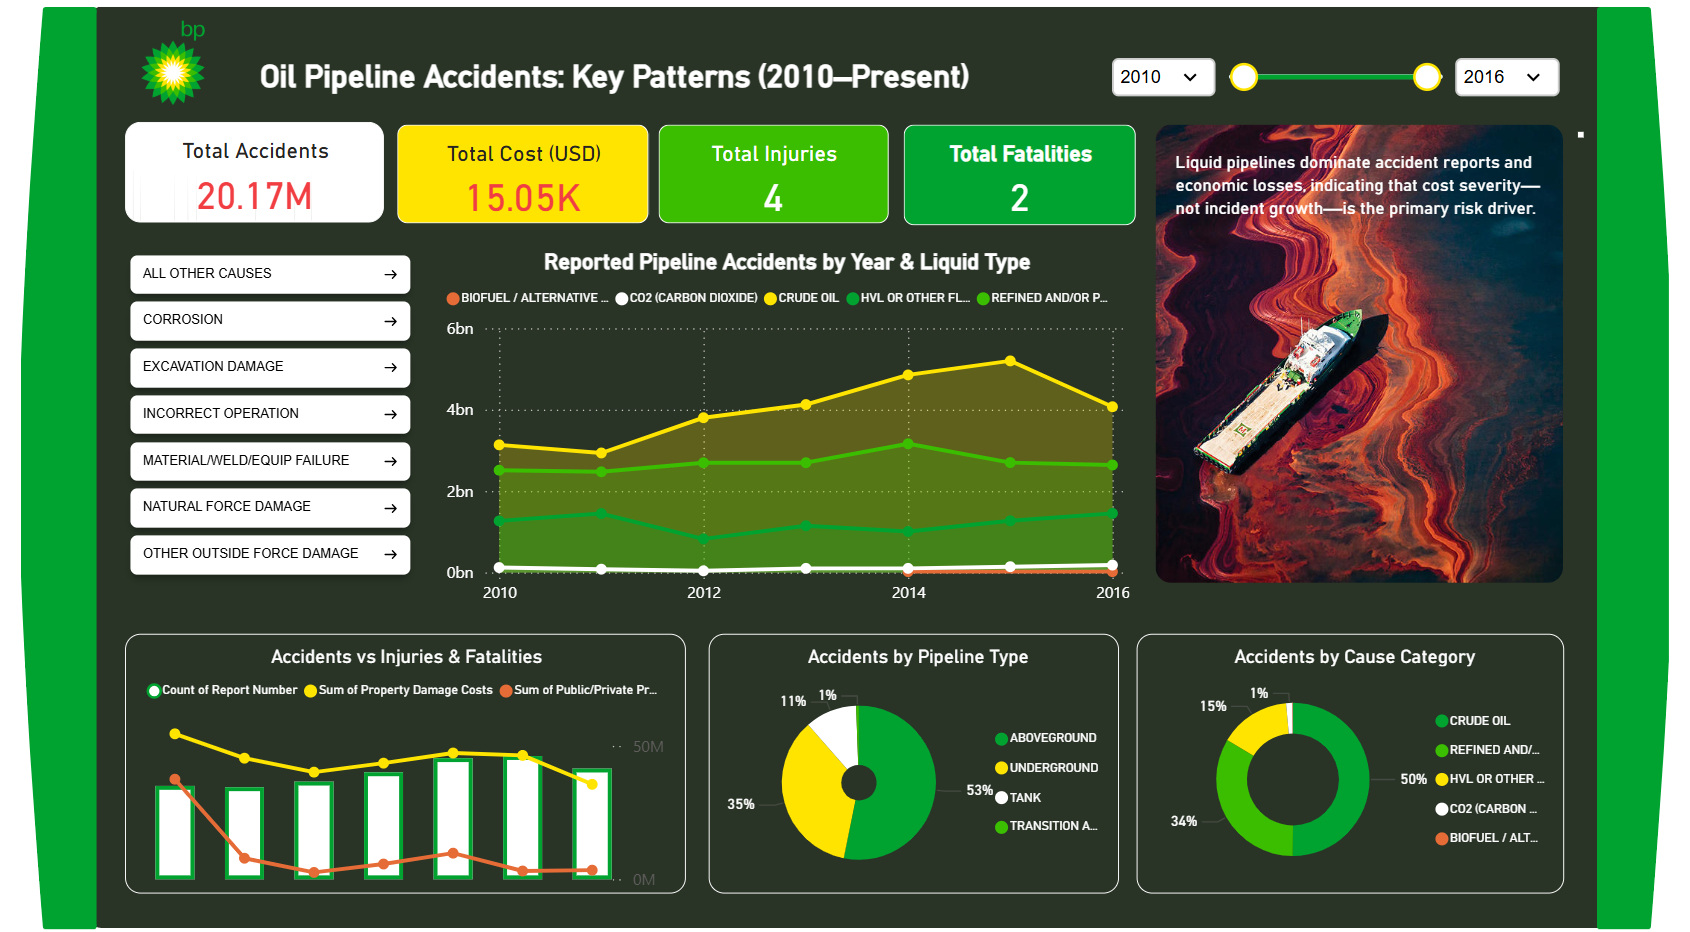
BP Oil Pipeline Accidents: Key Patterns (2010–Present) – Key Insights
866
 Free Operations & Production
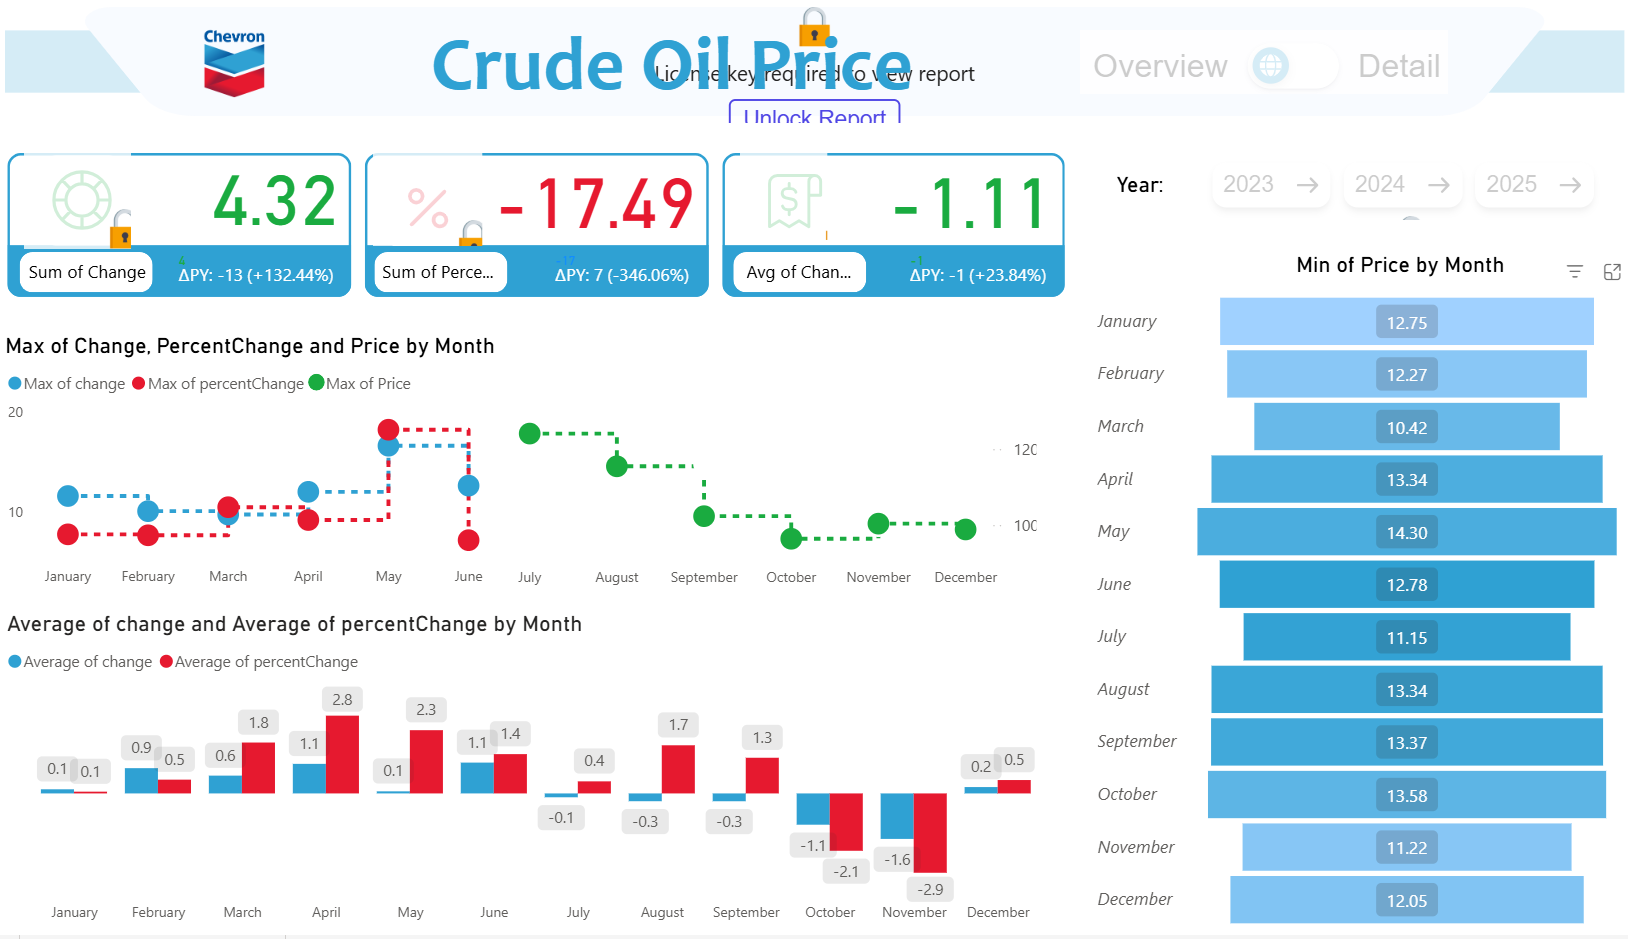
Chevron Crude Oil Price Dashboard – Key Insights (2023–2025)
950
If you find this website helpful, share it with friends and colleagues to boost their Power BI skills and work efficiency!
Like this site? Share it