Global Oil Production Report
672 Downloads
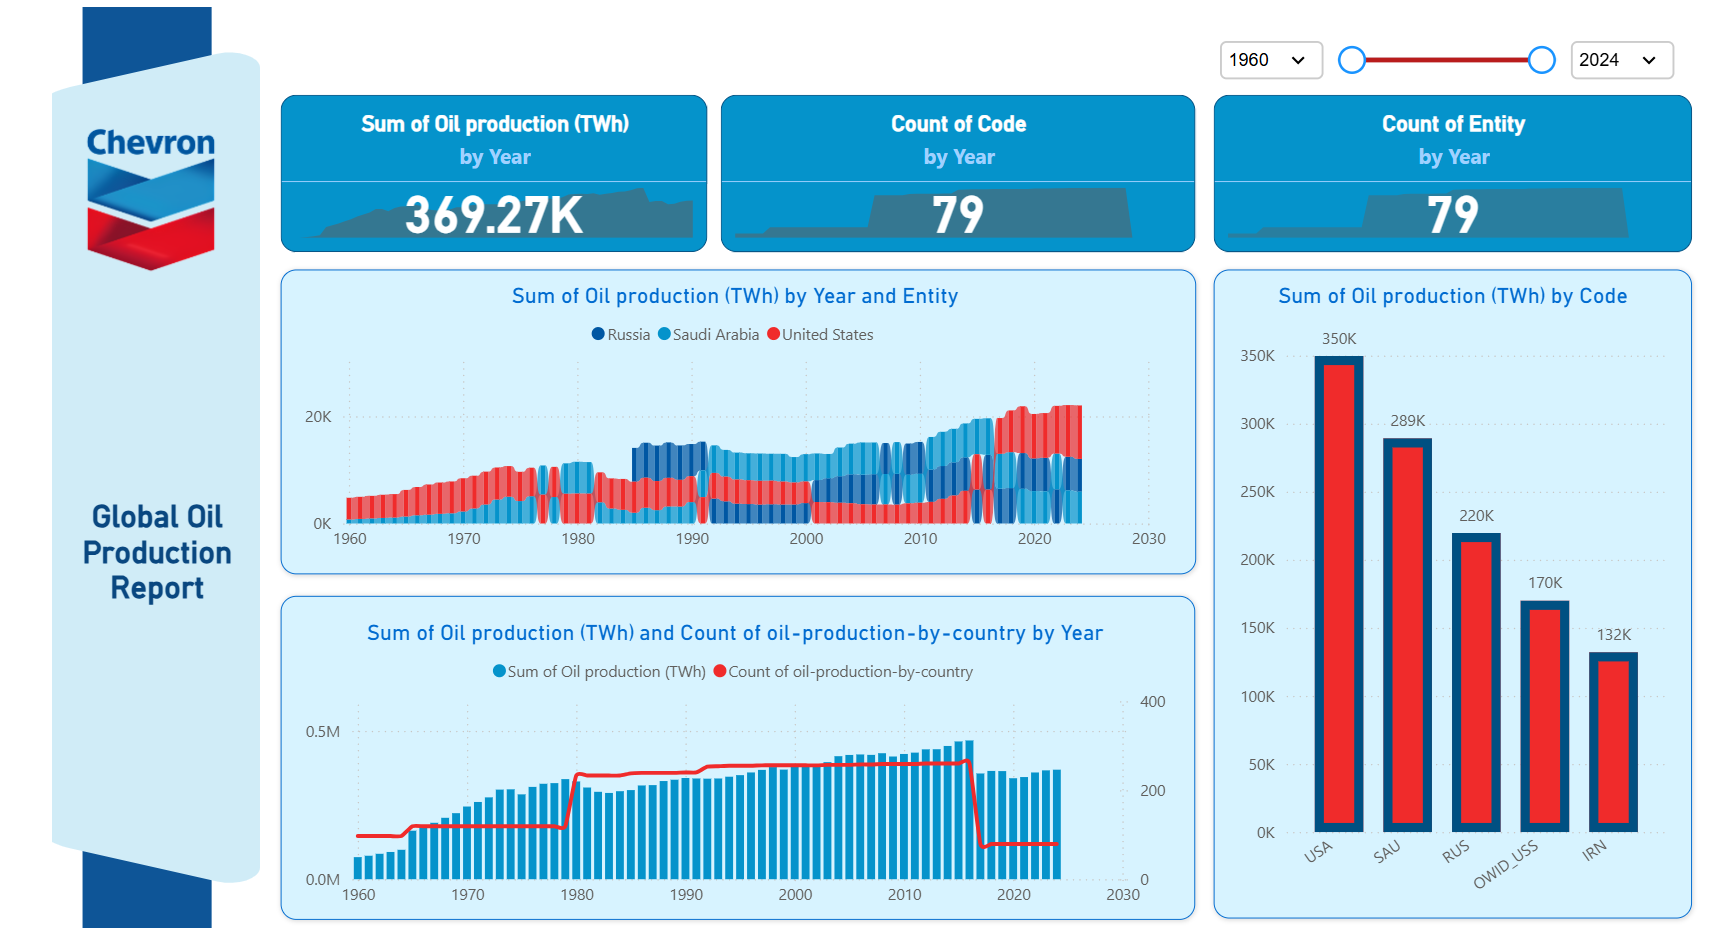
Description
1. Key Insights
A. Dominance of the "Big Three"
The data highlights that the United States (USA), Saudi Arabia (SAU), and Russia (RUS) are the primary drivers of global oil production.
- USA Leadership: The USA leads with a cumulative production of 350K TWh, significantly outperforming other nations.
- The Shale Surge: In the "Sum of Oil production by Year and Entity" chart, the red area (USA) shows an exponential increase starting around 2010. This corresponds with the American shale oil revolution.
B. Historical Production Trends
- Long-term Growth: Global production has followed a steady upward trajectory from 1960 (starting near 0.1M TWh) to a peak near 2018-2019.
- Geopolitical Impact: There is a visible fluctuation in Russian production (dark blue) during the early 1990s, likely reflecting the transition from the Soviet Union (OWID_USS) to the Russian Federation.
- Recent Volatility: The bottom-left chart shows a slight dip in total production around 2020, likely due to the global decrease in demand during the COVID-19 pandemic.
C. Data Anomalies (Critical Observation)
- Reporting Drop-off: In the "Sum of Oil production and Count by Year" chart, the red line (Count of oil-production-by-country) shows a sharp decline after 2015, dropping from nearly 300 entities to around 79.
- Impact: This suggests that recent data might only be tracking major producers, or there is a lag/gap in data collection for smaller nations in the current dataset.
2. Strategic Recommendations
A. Operational & Market Focus
- Monitor US Market Volatility: Since the USA is the largest producer, global prices are now highly sensitive to US domestic policy and infrastructure. Chevron should continue to prioritize investment in high-yield US basins (like the Permian) to maintain competitive advantage.
- Diversification of Supply: While the "Big Three" dominate, the "Count of Entity" shows 79 producing nations. Maintaining a footprint in emerging or stable secondary markets (like those in the Middle East or South America) is vital to hedge against regional geopolitical risks in Russia or the Middle East.
B. Data & Reporting Improvements
- Address the Reporting Gap: The sharp drop in the "Count of Entity" line needs investigation. If this is a data entry error or an incomplete dataset for 2020–2024, it could lead to an underestimation of total global supply.
- Refine KPIs: The dashboard currently uses "Sum of Oil production (TWh)." While TWh is useful for energy comparison, adding Barrels per Day (BPD) would align the report better with standard industry financial reporting.
C. Future Outlook & Transition
- Peak Oil Monitoring: As production levels show signs of plateauing in the most recent years (2020-2024), the company should use this data to calculate the "Reserve-to-Production" ratio to better forecast when to shift heavier investment toward renewable energy sectors.
Other Templates
 Free Operations & Production
Power BI Argentina Fuel Price Analysis Dashboard Template (Free PBIX Download)
52
 Free Supply Chain & Logistics
IBERDROLA Distribution of Renewable Energy Generation Dashboard – Key Insights (2005–2024)
968
 Free Operations & Production
PetroChina Global Energy: Oil Production Report – Key Insights (1991–2024)
826
If you find this website helpful, share it with friends and colleagues to boost their Power BI skills and work efficiency!
Like this site? Share it