IBERDROLA Distribution of Renewable Energy Generation Dashboard – Key Insights (2005–2024)
968 Downloads
Description
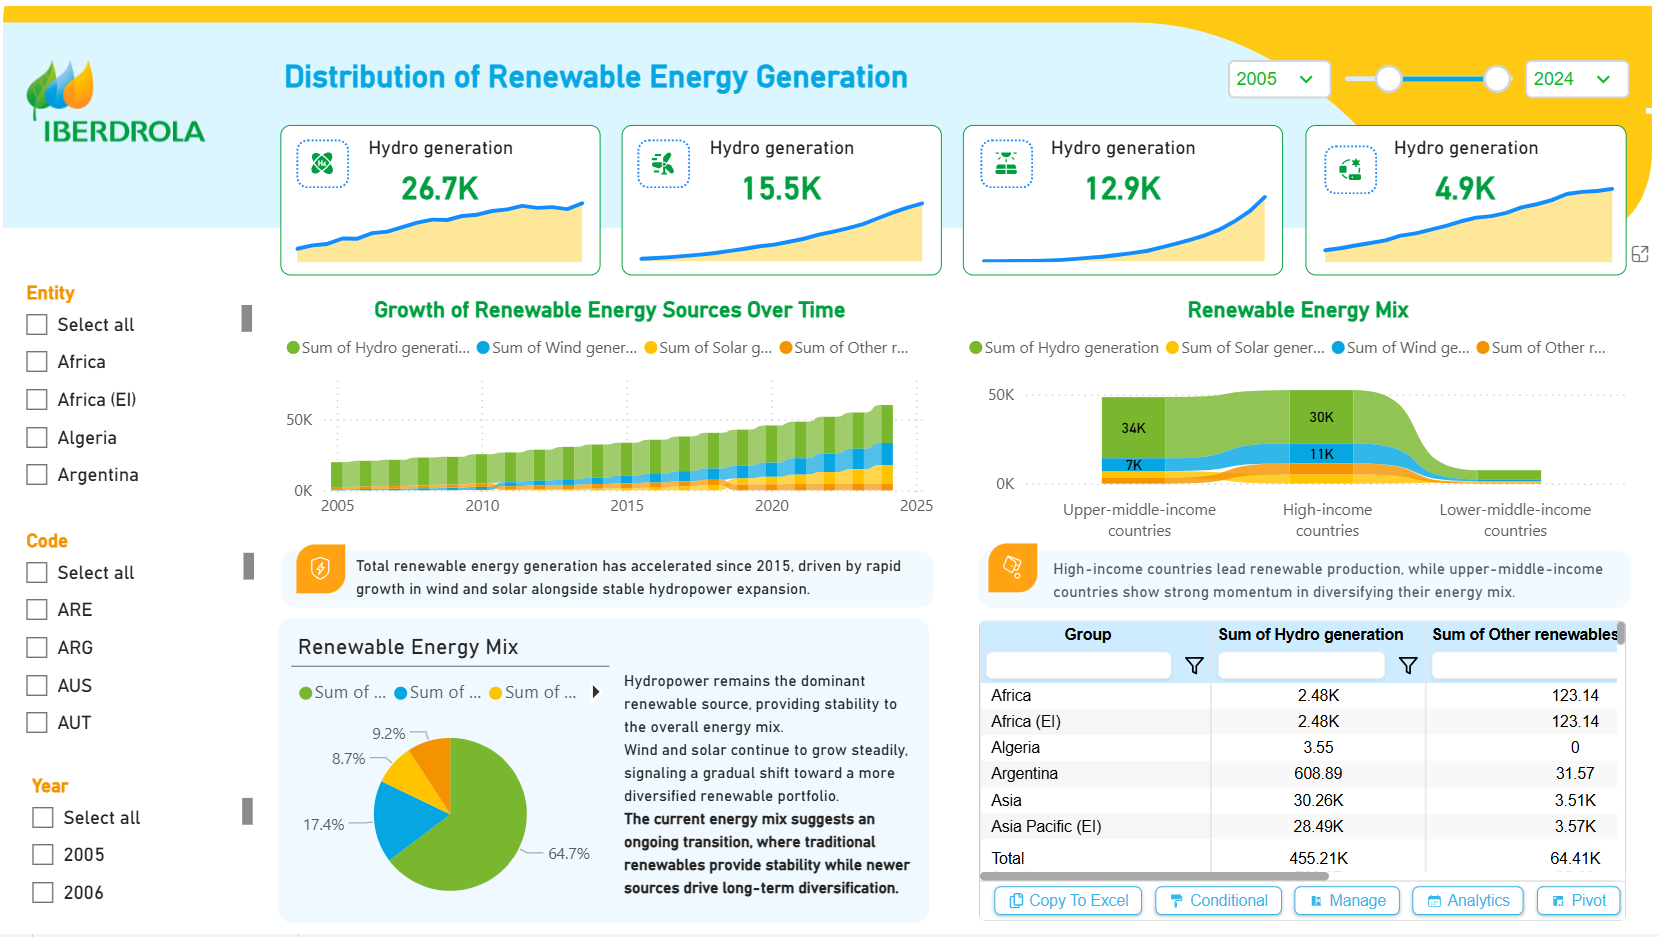
Overall Capacity Breakdown (2024)
- Hydro generation: 26.7K (dominant)
- Wind generation: 15.5K
- Solar generation: 12.9K
- Other generation: 4.9K
- Total: ~60K (likely GW)
Renewable Energy Mix
- Hydro: 64.7% (clear majority, providing baseload stability)
- Wind: 17.4%
- Solar: 8.7%
- Other: 9.2% → Hydro remains the cornerstone, but wind and solar together now represent ~26%, showing meaningful diversification.
Growth Trend Over Time
- Strong, consistent growth since 2005, with acceleration post-2015.
- Hydro (green) historically led and continues steady expansion.
- Wind (blue) and solar (orange) exhibit rapid growth, especially after 2015 – driving the recent surge in total capacity.
- Insight note: "Total renewable energy generation has accelerated since 2015, driven by rapid growth in wind and solar alongside stable hydropower expansion."
Income Group Distribution
- Upper-middle-income countries: 34K (largest block)
- High-income countries: 30K
- Lower-middle-income countries: 11K
- Unspecified/Other: 7K → Upper-middle-income nations (e.g., China, Brazil) lead total capacity, while high-income countries show strong momentum in diversifying their mix.
Regional Highlights (from Table)
- Asia Pacific: Significant hydro (28.5K–30.3K) and other renewables (3.5K).
- Africa: Hydro-focused (~2.5K).
- Argentina: Notable hydro (608K) and other (31.6K). → Hydro dominance is particularly pronounced in developing/emerging regions.
Key Takeaways
- Hydro Stability + New Sources Growth: Hydropower provides the reliable foundation (65% share), while wind and solar are the primary growth engines post-2015 – classic pattern of transitioning to a more diversified, scalable portfolio.
- Emerging Market Leadership: Upper-middle-income countries contribute the most capacity, reflecting massive hydro builds in Asia/Latin America and rapid wind/solar scale-up.
- Ongoing Diversification: The gradual shift from hydro-heavy to inclusion of variable renewables signals long-term resilience and alignment with global decarbonization trends.
- Regional Specialization: Hydro remains critical in water-rich emerging regions; wind/solar gains are more evenly spread.
Recommendations
- Maintain hydro assets for baseload reliability while aggressively scaling wind and solar to further reduce portfolio risk and capture cost declines.
- Prioritize projects in upper-middle-income markets (Asia Pacific, Latin America) for highest growth impact.
- Invest in storage and grid flexibility to integrate higher shares of variable wind/solar without compromising the stability hydro currently provides.
- Leverage high-income country expertise in wind/solar technology for partnerships in emerging markets.
Overall: Robust, hydro-anchored renewable growth with accelerating diversification driven by wind and solar – well-positioned for continued expansion, especially in upper-middle-income regions, while gradually building a more balanced and resilient energy mix.
Other Templates
 Free Sales & Revenue
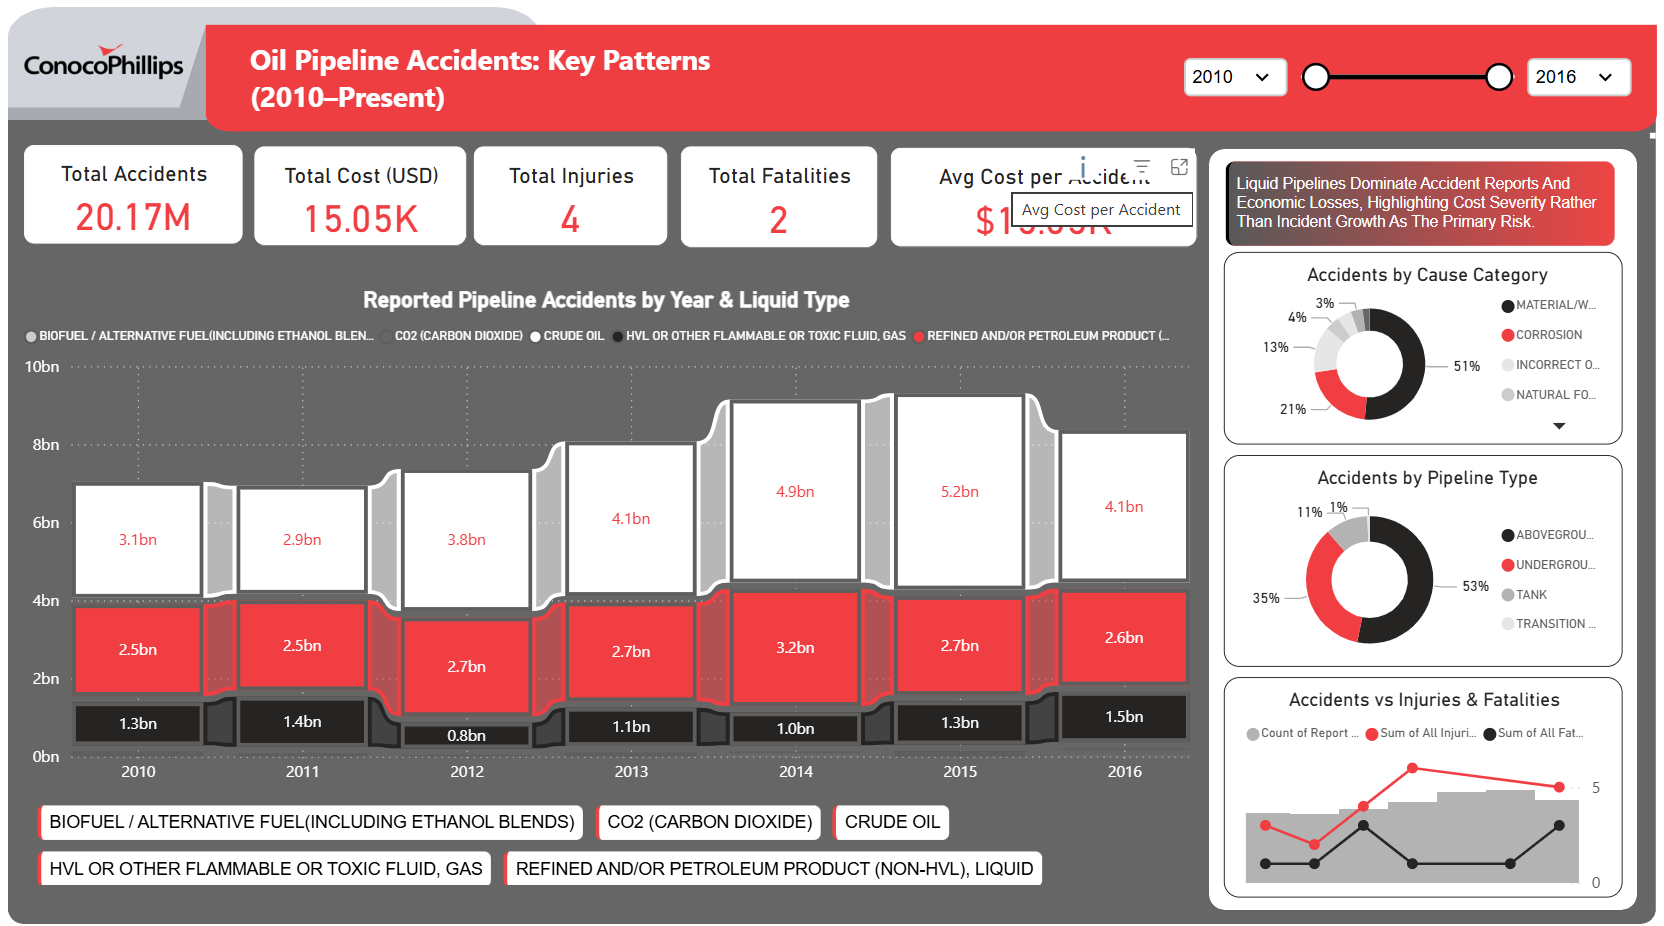
ConocoPhillips Oil Pipeline Accidents: Key Patterns (2010–Present) – Key Insights
871
 Free Operations & Production
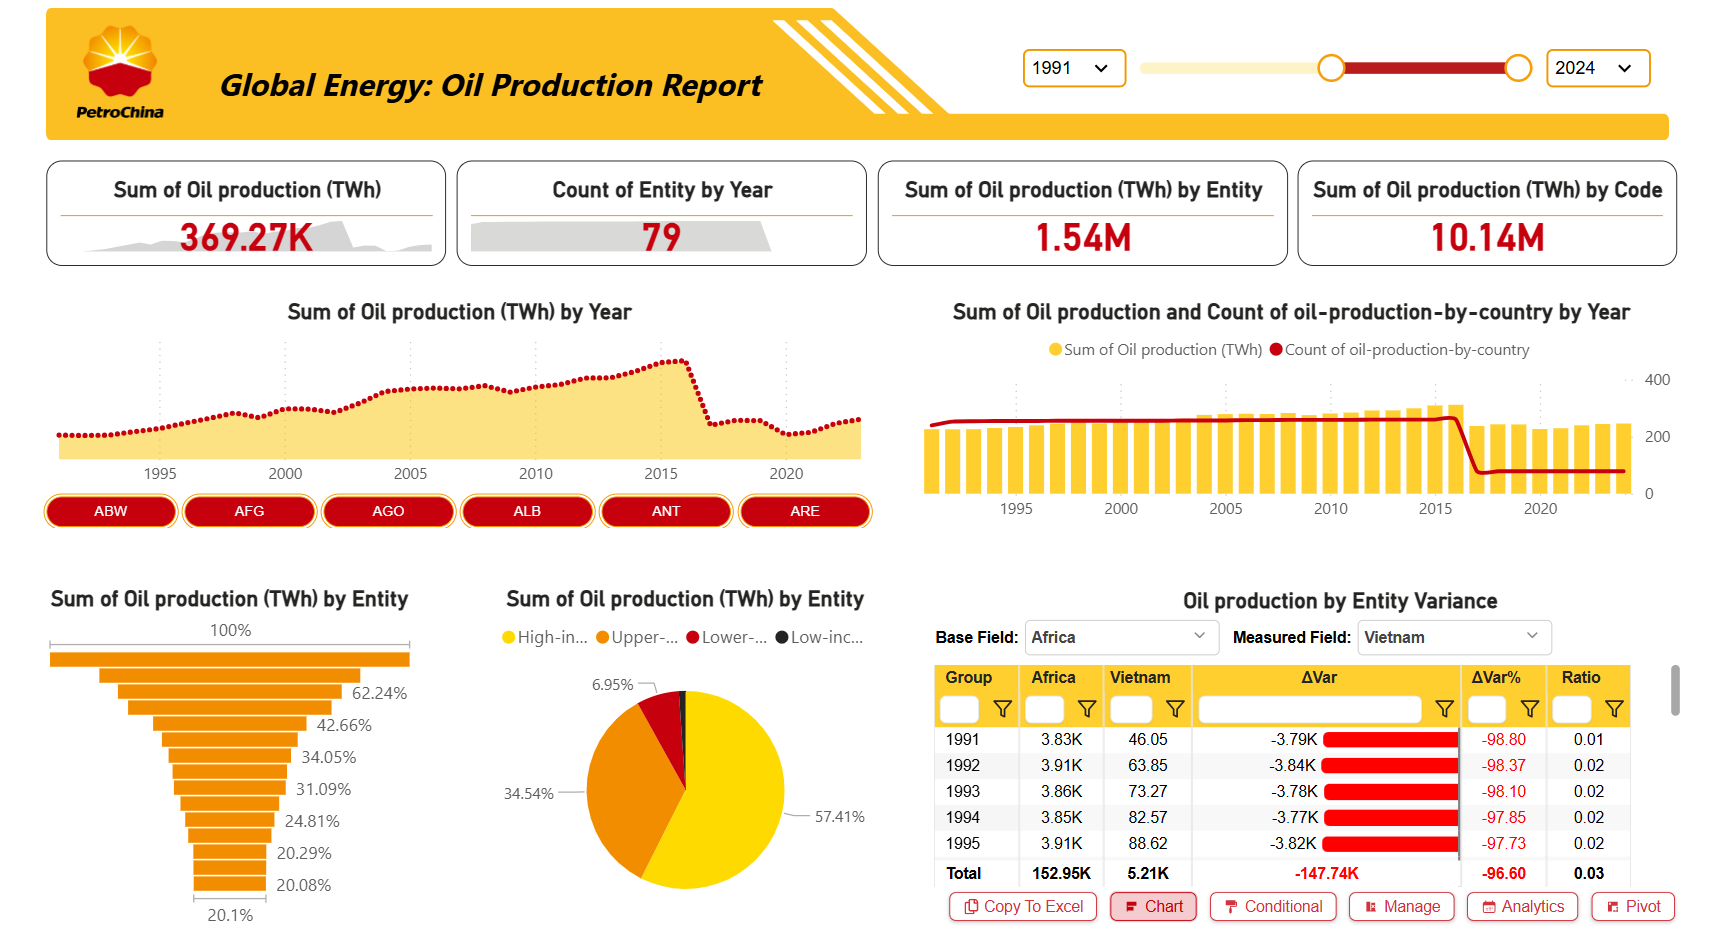
PetroChina Global Energy: Oil Production Report – Key Insights (1991–2024)
826
 Free Operations & Production
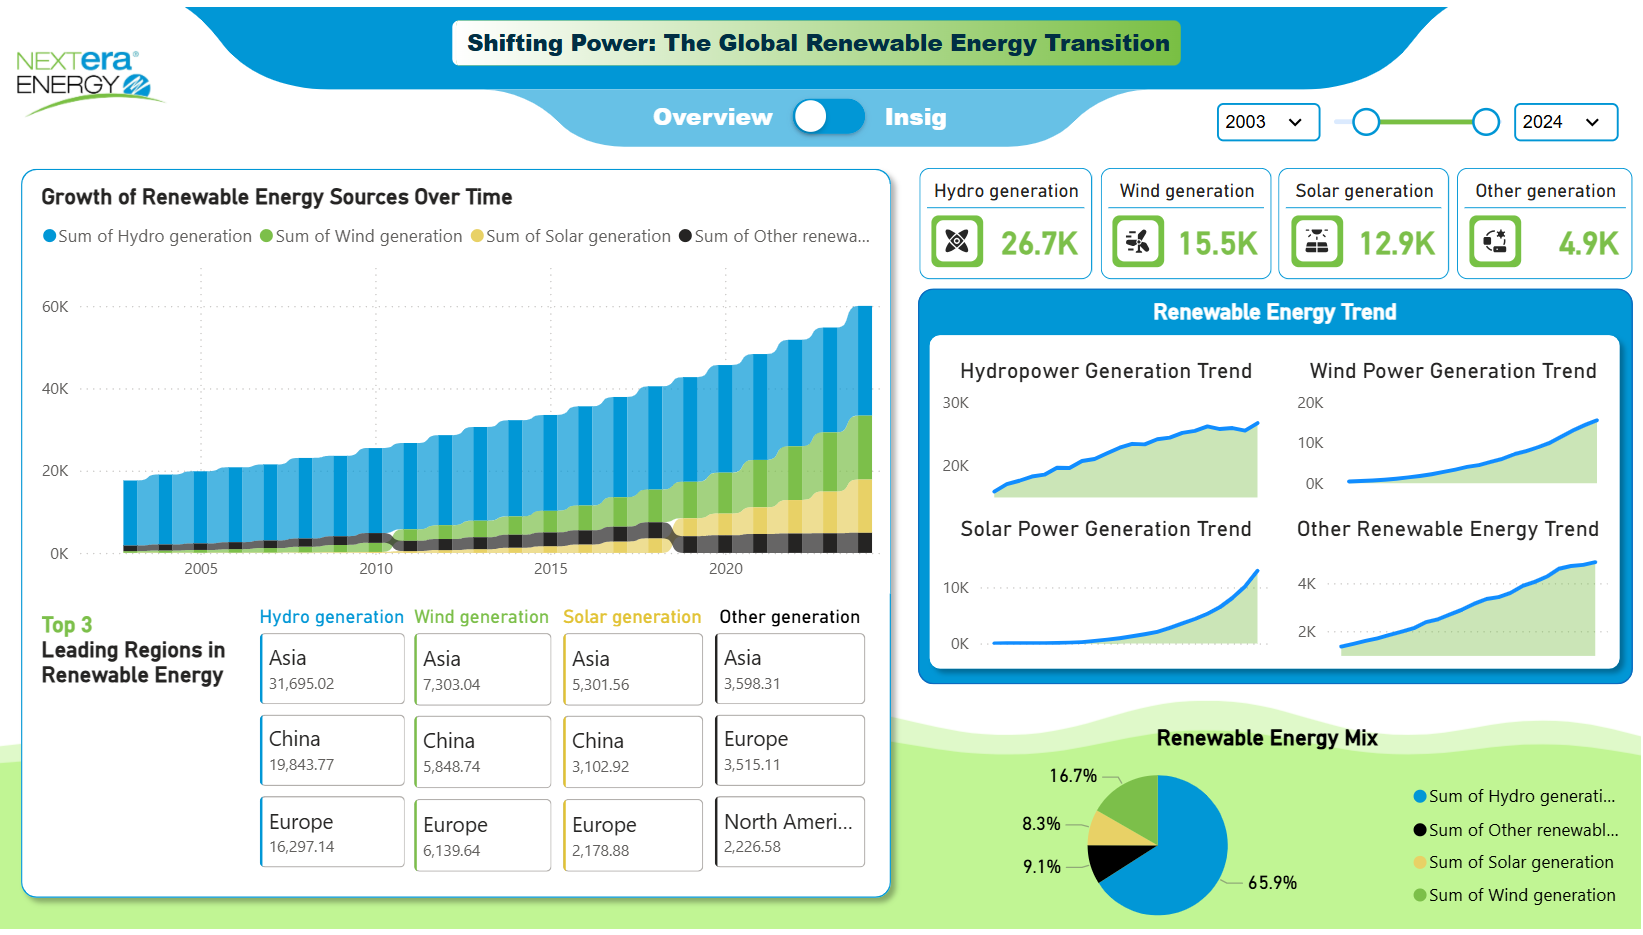
NextEra Energy: Shifting Power – Global Renewable Energy Transition Dashboard Insights (2003–2024)
927
If you find this website helpful, share it with friends and colleagues to boost their Power BI skills and work efficiency!
Like this site? Share it