Global CO₂ Emissions Per Capita Dashboard – Key Insights (1750–2024)
541 Downloads
Description
Long-Term Trend
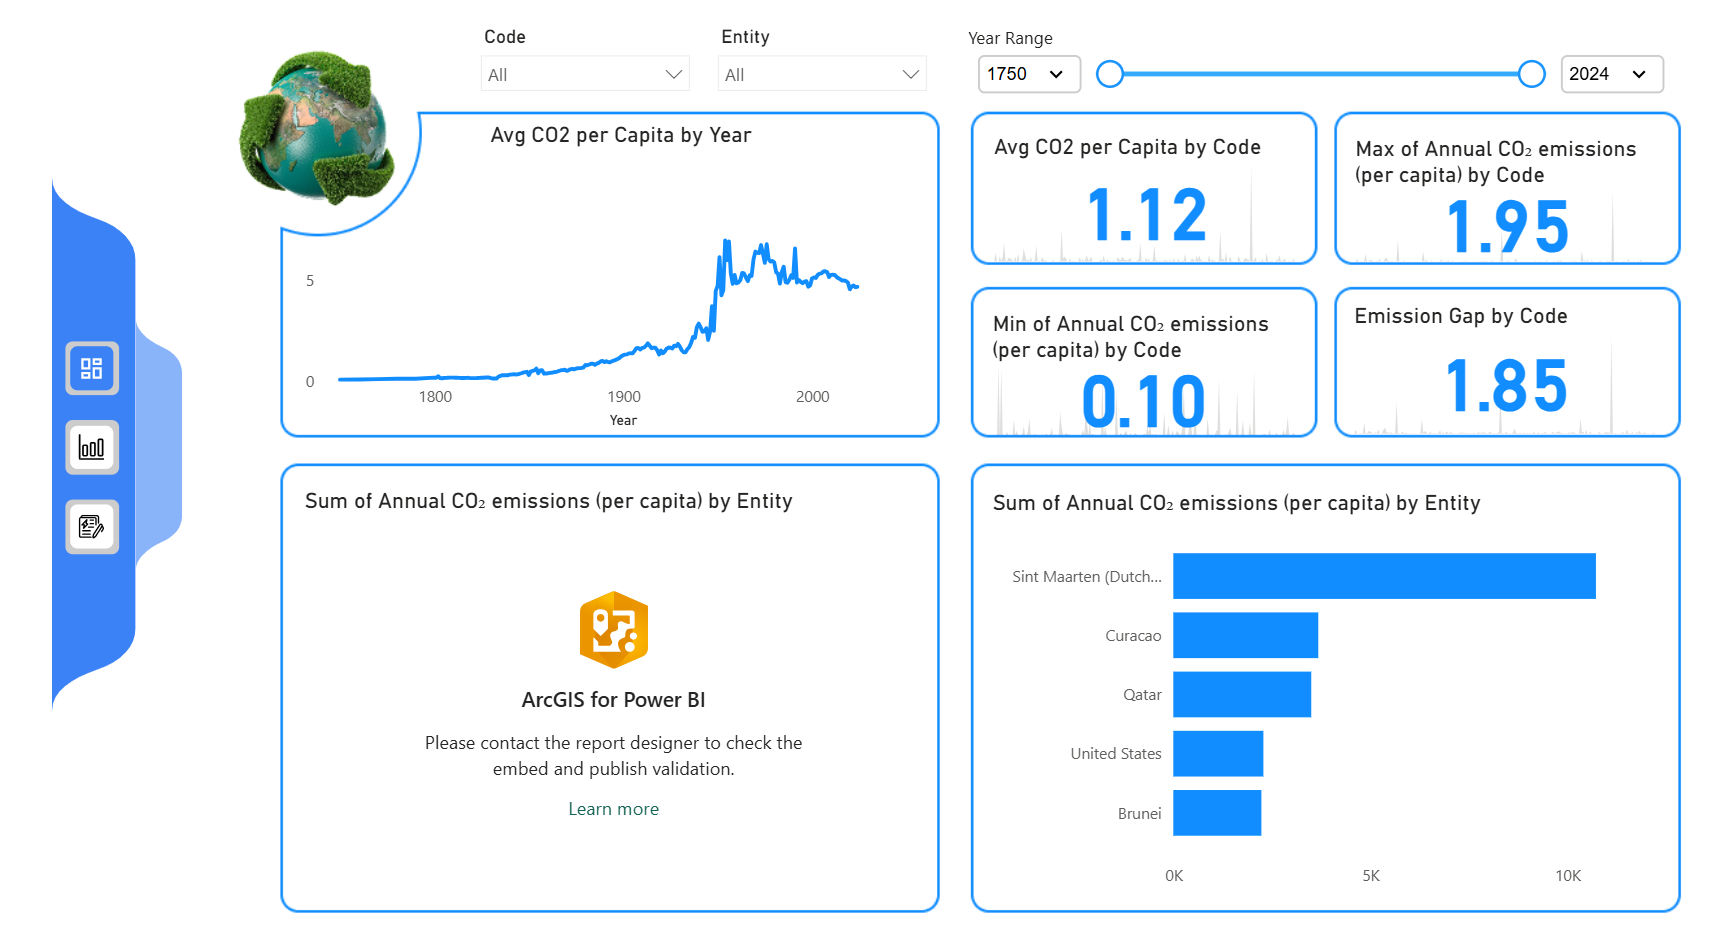
- Average CO₂ emissions per capita worldwide remained near zero until ~1850.
- Sharp rise began during the Industrial Revolution, accelerating post-1950.
- Peaked around early 2000s at ~4.5–5 tons per capita, followed by gradual decline/stabilization in recent decades → early signs of global decoupling from economic growth due to renewables, efficiency, and policy.
Key Metrics (Across All Entities/Years)
- Average CO₂ per Capita: 1.12 tons
- Maximum Annual Per Capita Emissions: 1.95 tons (likely historical peak for a specific high-emitting country/year)
- Minimum Annual Per Capita Emissions: 0.10 tons (typical for low-income or low-industrial nations)
- Emission Gap (Max – Min): 1.85 tons → illustrates extreme inequality in per-capita emissions
Top Emitters Per Capita (Sum of Annual Emissions by Entity)
- Sint Maarten (Dutch part) – highest cumulative per-capita emissions (small population + high tourism/energy intensity)
- Curaçao
- Qatar – major oil/gas exporter with small population
- United States
- Brunei
→ Small island territories and oil-rich Gulf states dominate due to structural factors (energy exports, tourism, small populations), rather than large nations like China or India (which have high total emissions but lower per-capita due to population size).Key Takeaways
- Historical Responsibility: Emissions per capita exploded with industrialization; today's global average (~1.12t) reflects legacy of developed nations.
- Inequality Highlighted: Gap of 1.85t between highest and lowest emitters shows developed/oil-rich entities bear disproportionate historical burden.
- Recent Positive Trend: Post-2000s plateau/decline in global average suggests effectiveness of climate policies, renewable adoption, and energy efficiency in curbing per-capita growth.
- Small Entities Dominate Rankings: Per-capita metric favors small, high-energy economies (islands, Gulf states) over populous industrial giants.
Recommendations
- Focus policy discussions on both total and per-capita metrics: large populations (e.g., China, India) drive absolute emissions, while small high-per-capita emitters highlight lifestyle/energy-intensity issues.
- Accelerate support for high-per-capita small islands (Sint Maarten, Curaçao) via climate finance and renewable transitions.
- Use declining global trend as evidence to strengthen Paris Agreement targets and promote technology transfer to still-rising emitters.
- Encourage developed nations (historical high emitters like US) to lead on deeper absolute cuts to close the emissions gap.
Overall: The data shows progress in stabilizing global per-capita CO₂, but persistent inequality underscores need for differentiated responsibilities in climate action.
Other Templates
 Free Operations & Production
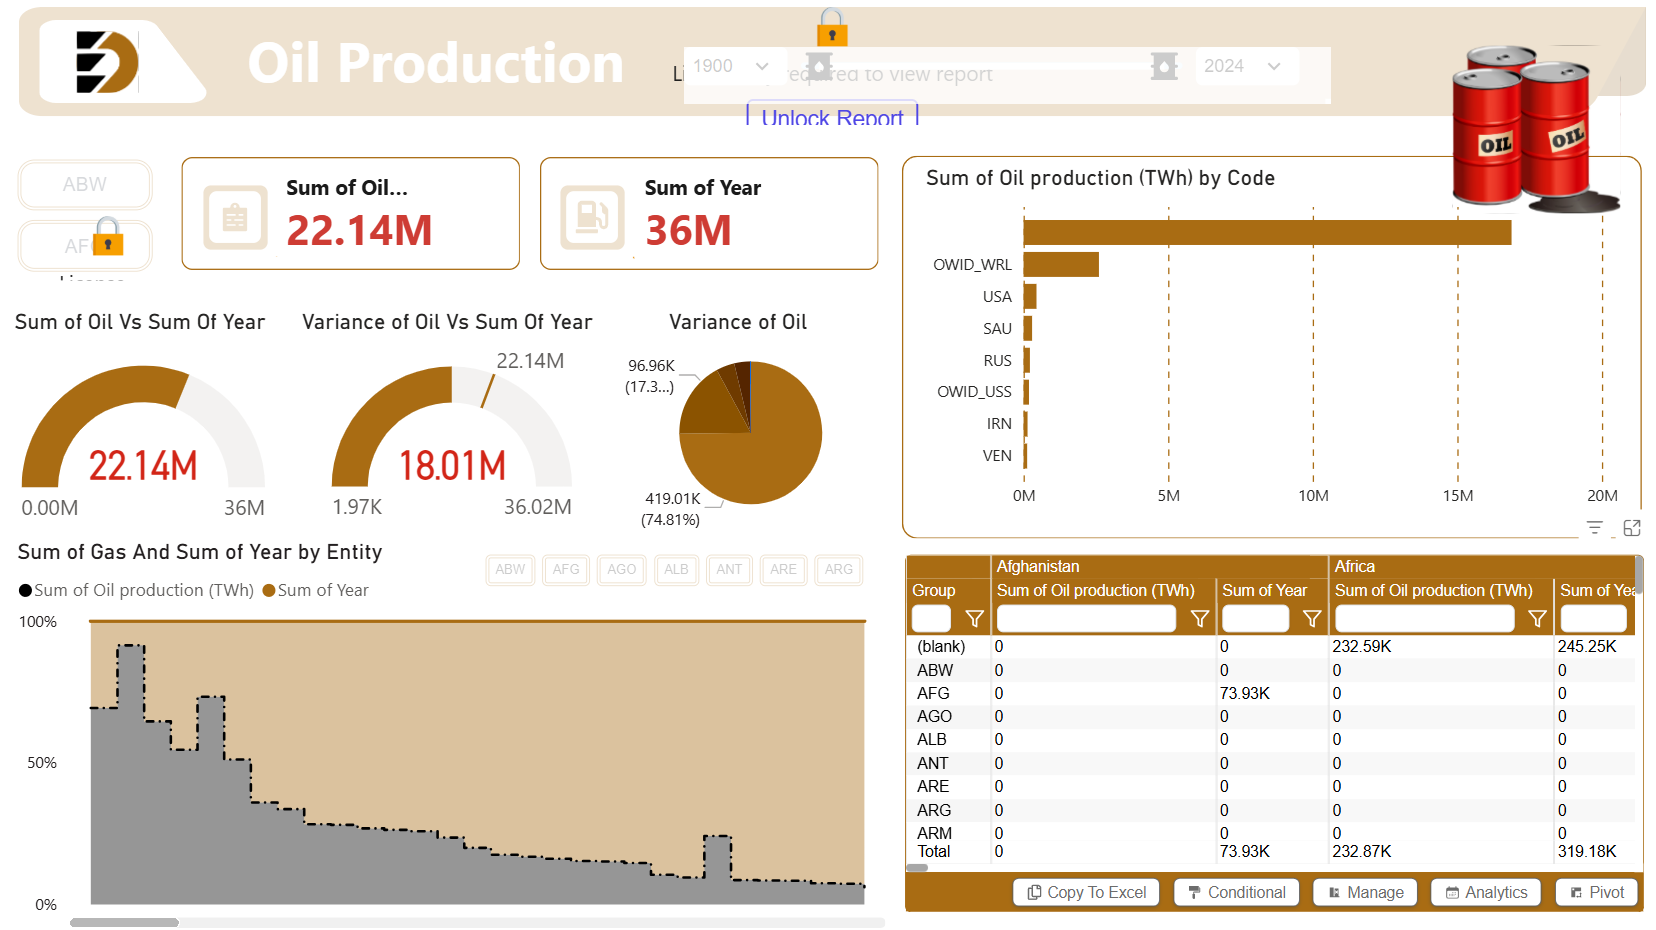
Oil Production Dashboard – Key Insights (1900–2024)
589
 Free Operations & Production
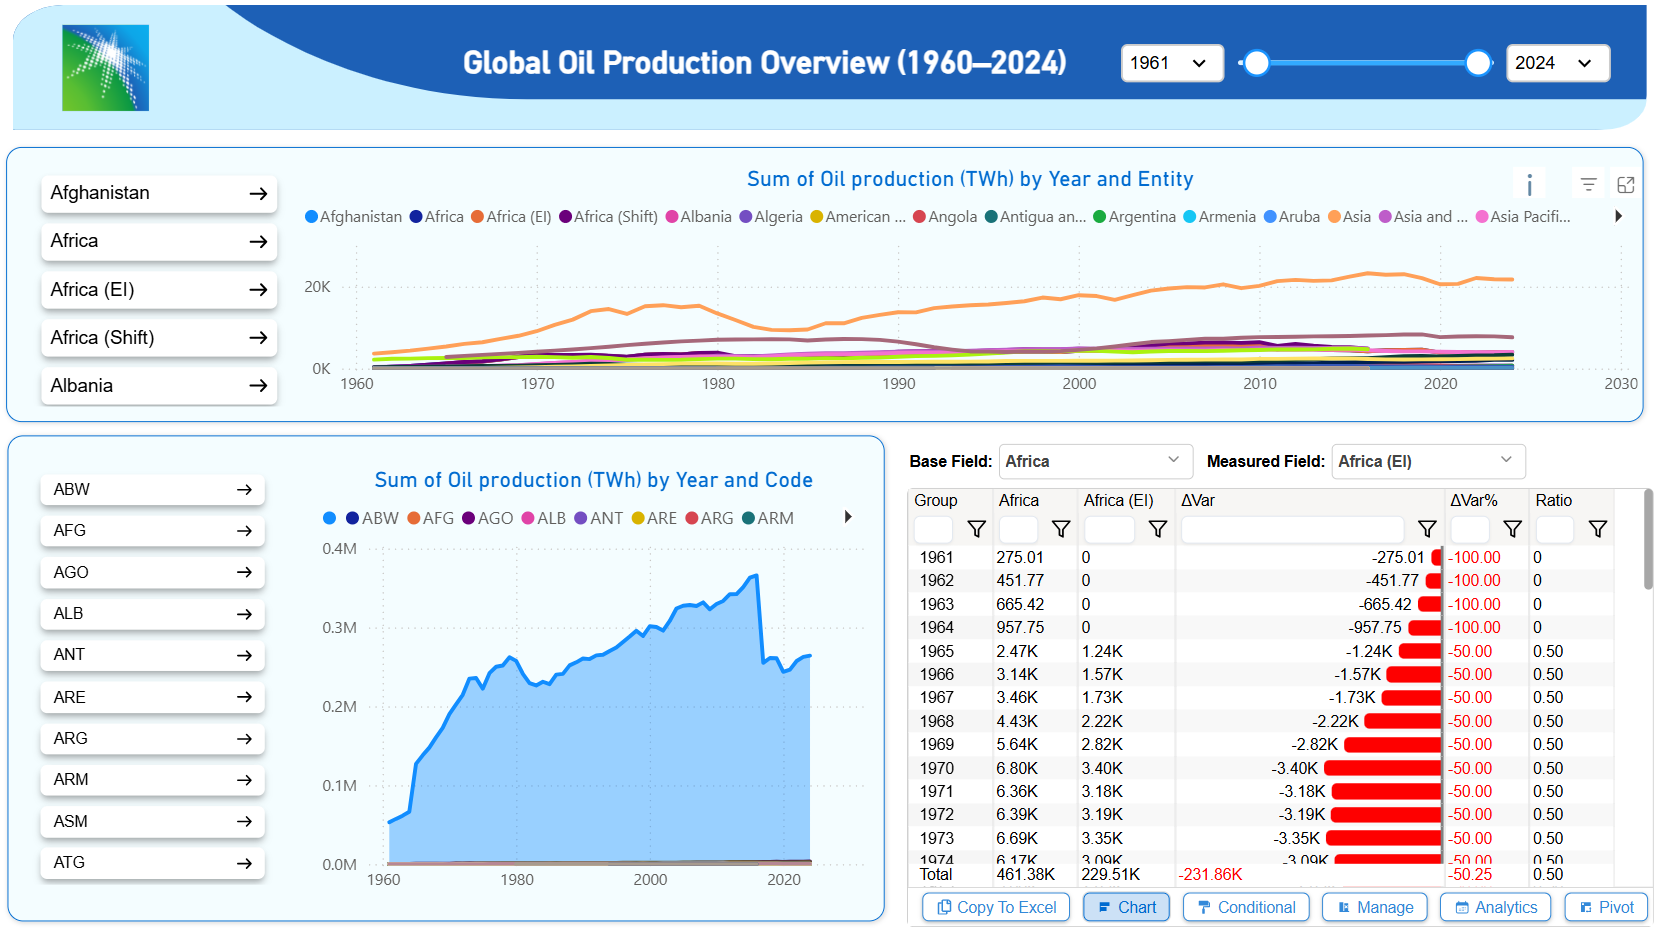
Executive Summary: Global Oil Production Analysis (1960–2024)
793
 Free Operations & Production
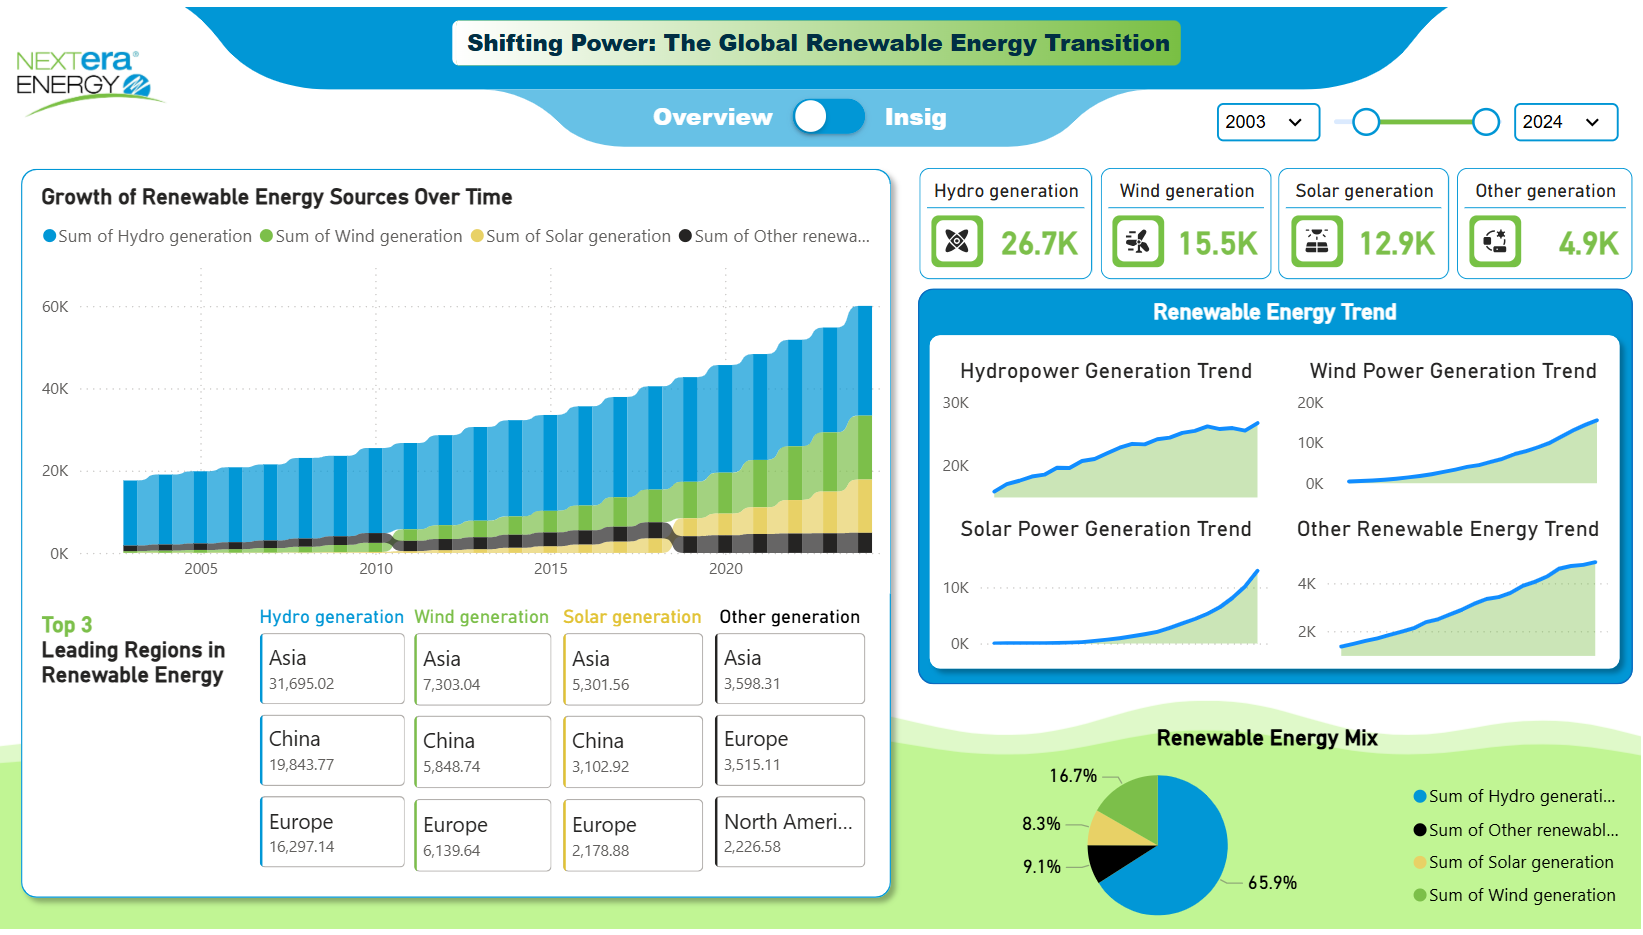
NextEra Energy: Shifting Power – Global Renewable Energy Transition Dashboard Insights (2003–2024)
927
If you find this website helpful, share it with friends and colleagues to boost their Power BI skills and work efficiency!
Like this site? Share it