Power BI Argentina Fuel Price Analysis Dashboard Template (Free PBIX Download)
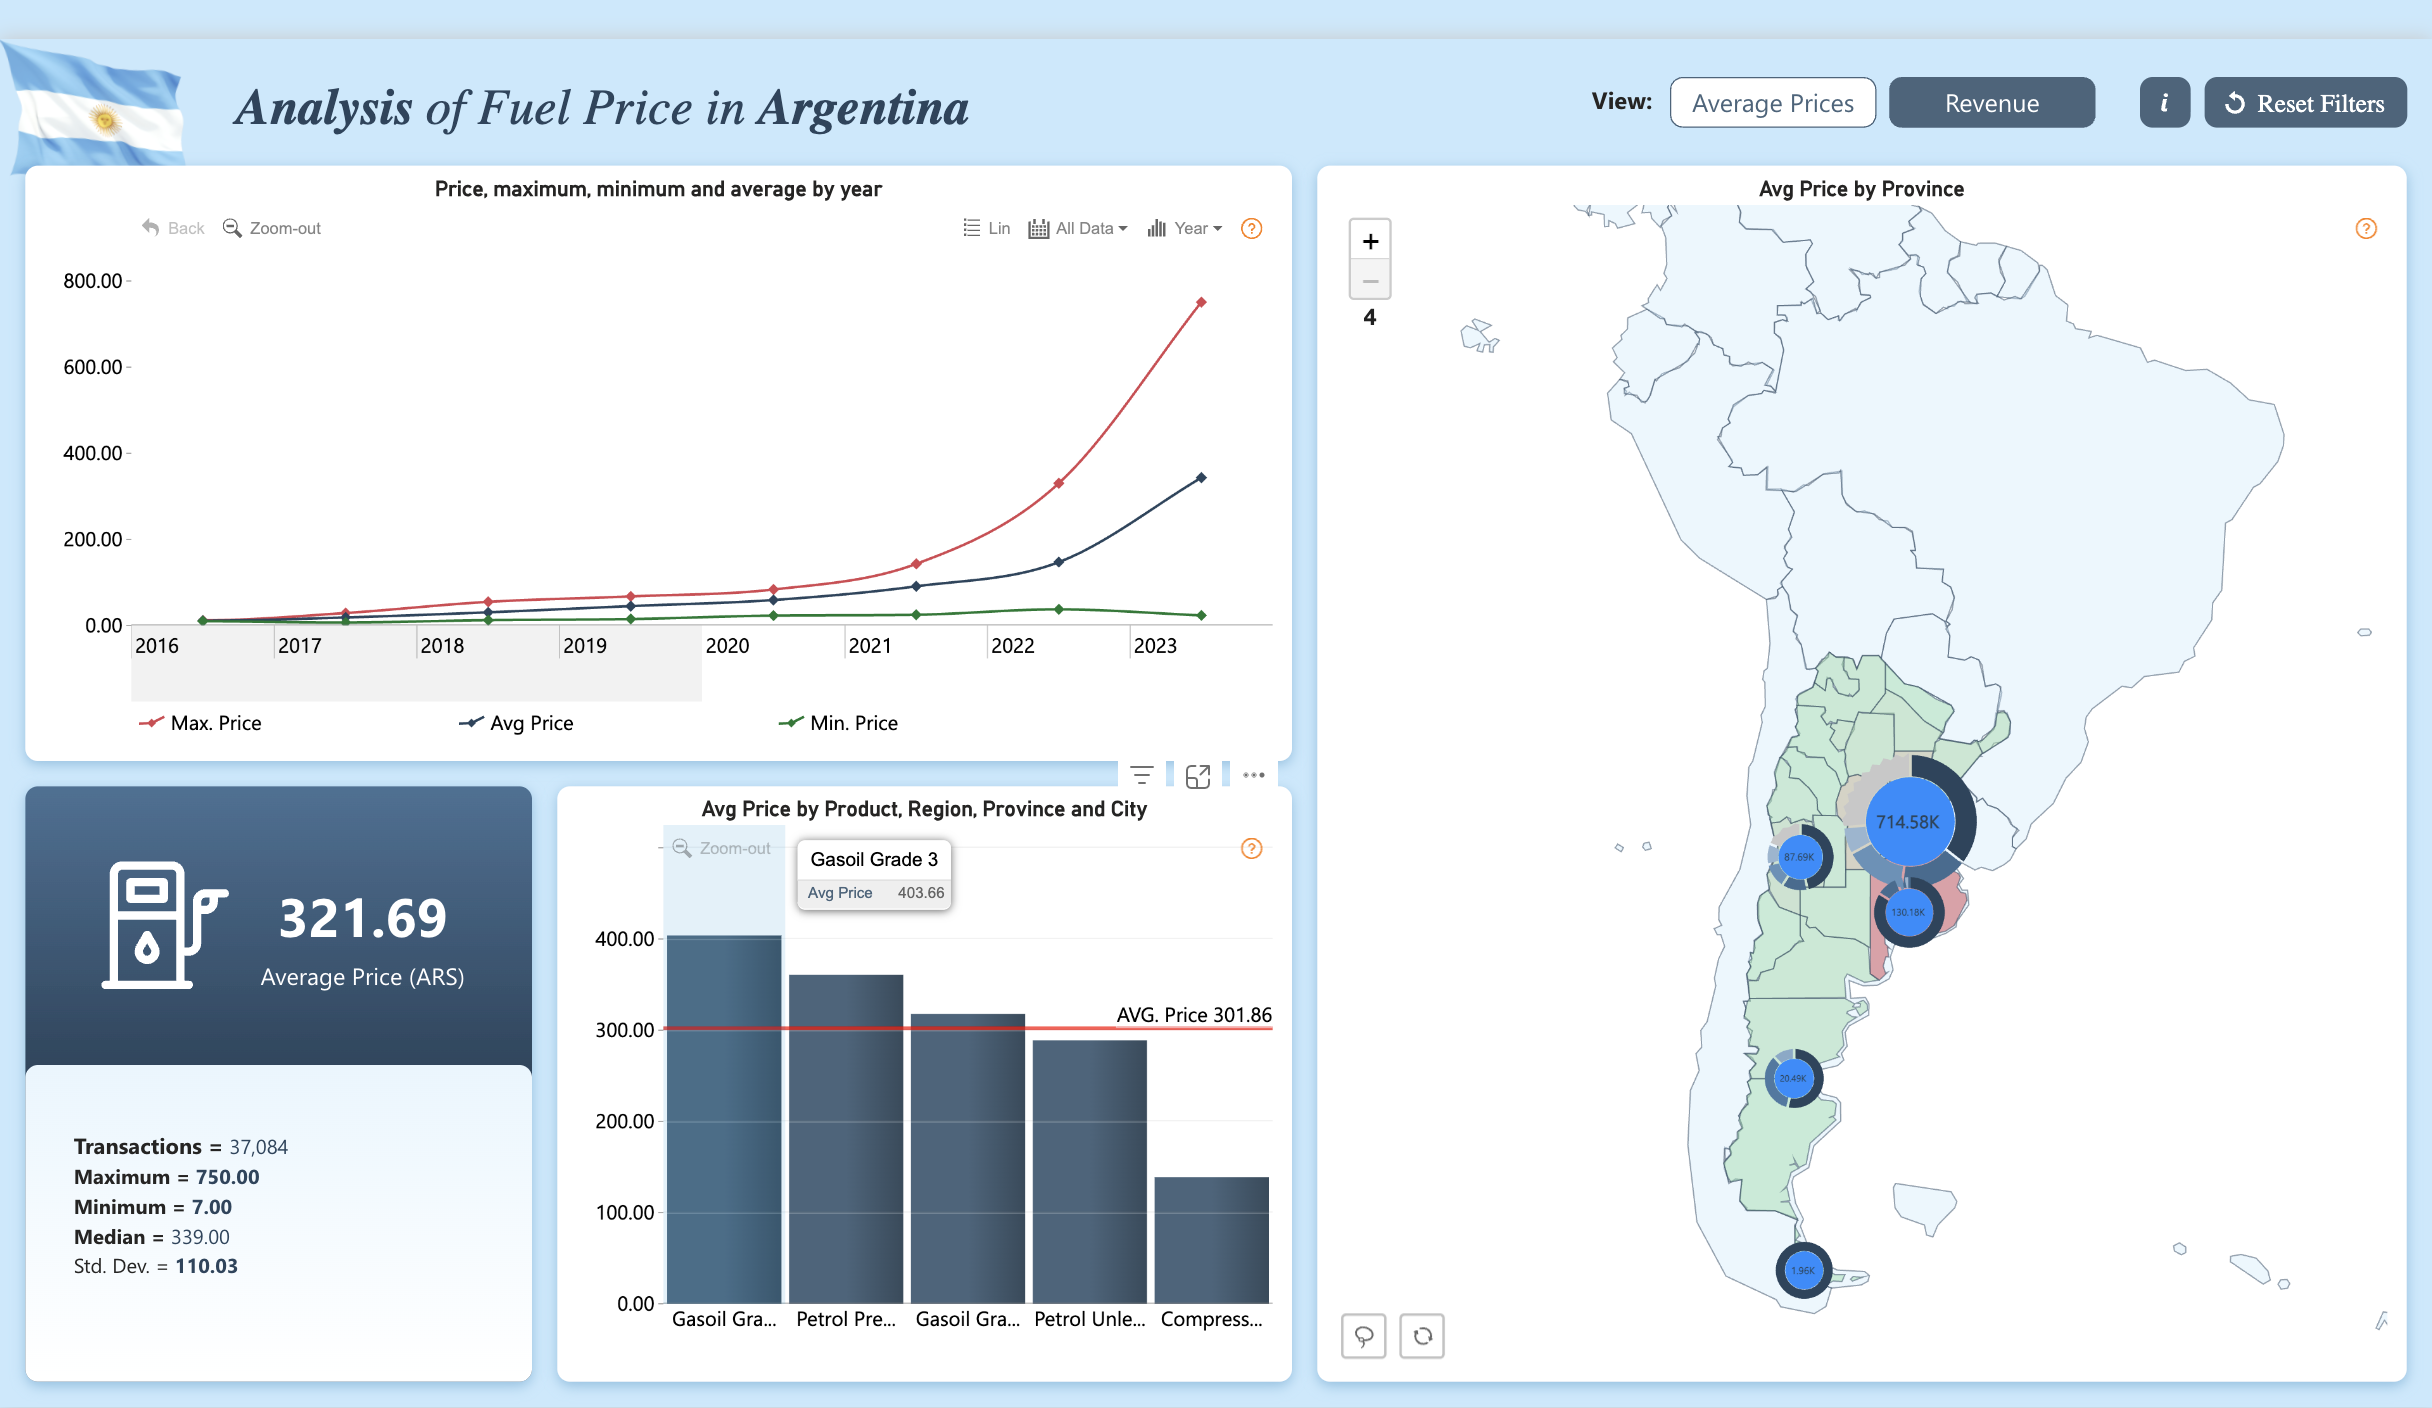
This dashboard tracks the full trajectory of fuel prices across Argentina — from the near-zero baseline of 2016 through the hyperinflationary surge to 750 ARS by 2023 — broken down by product type, region, province, and city. It serves Energy Economists, Government Policy Analysts, and Fuel Retail Strategists who need to monitor price volatility, regional pricing disparity, and product-level cost structures in one interactive view. The dual-view toggle (Average Prices / Revenue) extends analytical utility beyond price tracking into revenue impact assessment.
1. What's Inside This Template
KPI Card — Core Statistical Summary
| MetricValue | |
| Average Price (ARS) | 321.69 |
| Total Transactions | 37,084 |
| Maximum Price | 750.00 ARS |
| Minimum Price | 7.00 ARS |
| Median Price | 339.00 ARS |
| Standard Deviation | 110.03 |
The 107× gap between minimum (7.00) and maximum (750.00) ARS is not a product-tier difference — it is the footprint of Argentina's inflation crisis captured in a single dataset. The standard deviation of 110.03 against an average of 321.69 (34% coefficient of variation) confirms extreme price dispersion across time and geography.
The median (339.00) being higher than the mean (321.69) indicates the distribution is left-skewed — more transactions occur at higher price points, pulling the median above the average. This means recent high-inflation years dominate transaction volume.
Line Chart — Price Maximum, Minimum & Average by Year (2016–2023)
| YearApprox. Max PriceApprox. Avg PriceApprox. Min Price | |||
| 2016 | ~10 | ~5 | ~3 |
| 2017 | ~15 | ~10 | ~5 |
| 2018 | ~30 | ~20 | ~8 |
| 2019 | ~50 | ~35 | ~10 |
| 2020 | ~80 | ~55 | ~12 |
| 2021 | ~130 | ~90 | ~15 |
| 2022 | ~280 | ~180 | ~20 |
| 2023 | ~750 | ~340 | ~25 |
All three series follow an exponential curve — not linear growth — confirming that Argentina's fuel price inflation is compounding, not additive. The gap between Max and Avg prices widens dramatically from 2022 onward, indicating premium fuel grades (Gasoil Grade 3, Petrol Premium) are accelerating faster than standard grades.
Bar Chart — Avg Price by Product, Region, Province & City
| Fuel ProductAvg Price (ARS)vs. Overall Avg (301.86) | ||
| Gasoil Grade 3 | ~400 | +32.5% above avg |
| Petrol Premium | ~330 | +9.3% above avg |
| Gasoil Grade 2 | ~310 | +2.7% above avg |
| Petrol Unleaded | ~290 | −3.9% below avg |
| Compressed Gas | ~140 | −53.6% below avg |
The tooltip confirms Gasoil Grade 3 at 403.66 ARS — the highest-priced fuel product. Compressed Gas (CNG) at ~140 ARS is dramatically cheaper, sitting at less than half the overall average. Argentina's large CNG vehicle fleet benefits from a structural price advantage that this dashboard quantifies clearly.
The reference line at AVG. Price 301.86 bisects the chart — Gasoil Grade 3 and Petrol Premium sit above it; Petrol Unleaded and Compressed Gas sit below.
Geographic Map — Avg Price by Province
The map shows price concentration in central-eastern Argentina, with the largest bubble at 714.58K (likely Buenos Aires province or city — the highest population density region). Additional clusters appear along the Patagonia corridor and northwestern provinces, with the southernmost node isolated in Tierra del Fuego.
The 714.58K figure likely represents cumulative transaction value rather than a per-litre price, given the scale — confirming this map visualizes revenue-weighted average price by province, not a simple price per litre.
View Toggle: Average Prices / Revenue
Switching to Revenue view transforms all visuals from price-per-litre analytics to total revenue — enabling the same geographic and product breakdowns to be read as market size rather than cost analysis.
2. Key Insights
- Argentina's fuel prices compounded at approximately 70–80% annually from 2016 to 2023 — a near-perfect reflection of the country's inflation trajectory. The maximum price moving from ~10 ARS (2016) to 750 ARS (2023) represents a 75× nominal increase in 7 years. Any fuel cost model built before 2020 is structurally obsolete for Argentine operations.
- The max-to-avg price divergence from 2022 onward signals premium fuel grades inflating faster than standard grades. In 2021, max and avg prices were roughly 1.4× apart. By 2023, that ratio expanded to ~2.2×. Premium diesel (Gasoil Grade 3 at 403.66 ARS) is pulling away from the overall average (301.86 ARS) — a 34% premium that did not exist in earlier years.
- Compressed Natural Gas (CNG) at ~140 ARS is 53% below the fleet average — the single largest cost arbitrage visible in this dataset. For fleet operators in Argentina, CNG conversion delivers immediate and compounding cost relief as liquid fuel prices accelerate. The price gap is not narrowing — it is widening in absolute terms as inflation hits liquid fuels harder.
- The median price (339 ARS) exceeding the mean (321.69 ARS) reveals that high-price transactions dominate volume, not outliers. This inverted relationship confirms that the bulk of the 37,084 transactions occurred in recent high-inflation years — meaning older low-price records are statistically marginal. Any average-price calculation that weights all years equally will significantly understate current market reality.
- The 714.58K provincial cluster concentration indicates Buenos Aires absorbs a disproportionate share of national fuel spend. If this represents cumulative transaction value, it dwarfs all other provinces — consistent with Buenos Aires accounting for ~38% of Argentina's GDP. Regional pricing strategy must treat Buenos Aires as a separate market.
- Standard deviation of 110.03 ARS (34% of the mean) makes this one of the most volatile commodity price datasets outside of crisis-economy contexts. For corporate treasury teams managing Argentine fuel exposure, this volatility level means hedging instruments and monthly price revision clauses in supply contracts are not optional — they are existential financial controls.
3. Who This Template Is For
- Energy Economists and Policy Analysts at Argentine government ministries or multilateral organizations who need a longitudinal fuel price dataset visualized by product, region, and time period to support subsidy policy, inflation reporting, or energy transition planning.
- Fleet Operations and Logistics Managers at companies with Argentine vehicle fleets who need to model fuel cost exposure by province and product type, compare CNG vs liquid fuel economics, and present fuel spend trends to finance leadership.
- BI Developers and Data Analysts in the energy, utilities, or commodities sector who need a ready-to-use Power BI template connectable to ENARGAS (Argentina's energy regulator) or internal fuel procurement databases, with pre-built year-over-year price trend logic and geographic drill-down.
4. How to Use
- Download the PBIX file from the Flexa Intel gallery.
- Open in Power BI Desktop (2023 or later recommended for map visual and dual-view toggle).
- Connect your data source — typically a flat fuel transaction export from ENARGAS public data, a fuel card management system (e.g., Solred, Repsol fleet), or an internal procurement database with fields for transaction date, fuel product type, price per litre, province, city, and transaction volume.
- All visuals update automatically — the KPI stat card, min/max/avg trend lines, product-level bar chart, provincial map bubbles, and Revenue view all recalculate from your connected data. The Average Prices / Revenue toggle switches the analytical lens without requiring separate reports.
This dashboard visualizes fuel price trends and geographic distribution powerfully but lacks a structured province-by-product matrix table — no ranked view showing each province's average price per fuel type, transaction count, price deviation from national average, and year-over-year change side by side. Flexa Tables is a Microsoft-certified Power BI visual built for exactly this — multi-column commodity reporting with conditional formatting by price tier, sortable province rankings, and expandable region-to-city hierarchies, making monthly fuel cost reviews and regulatory submissions significantly faster.
Other Templates
 Free Sales & Revenue
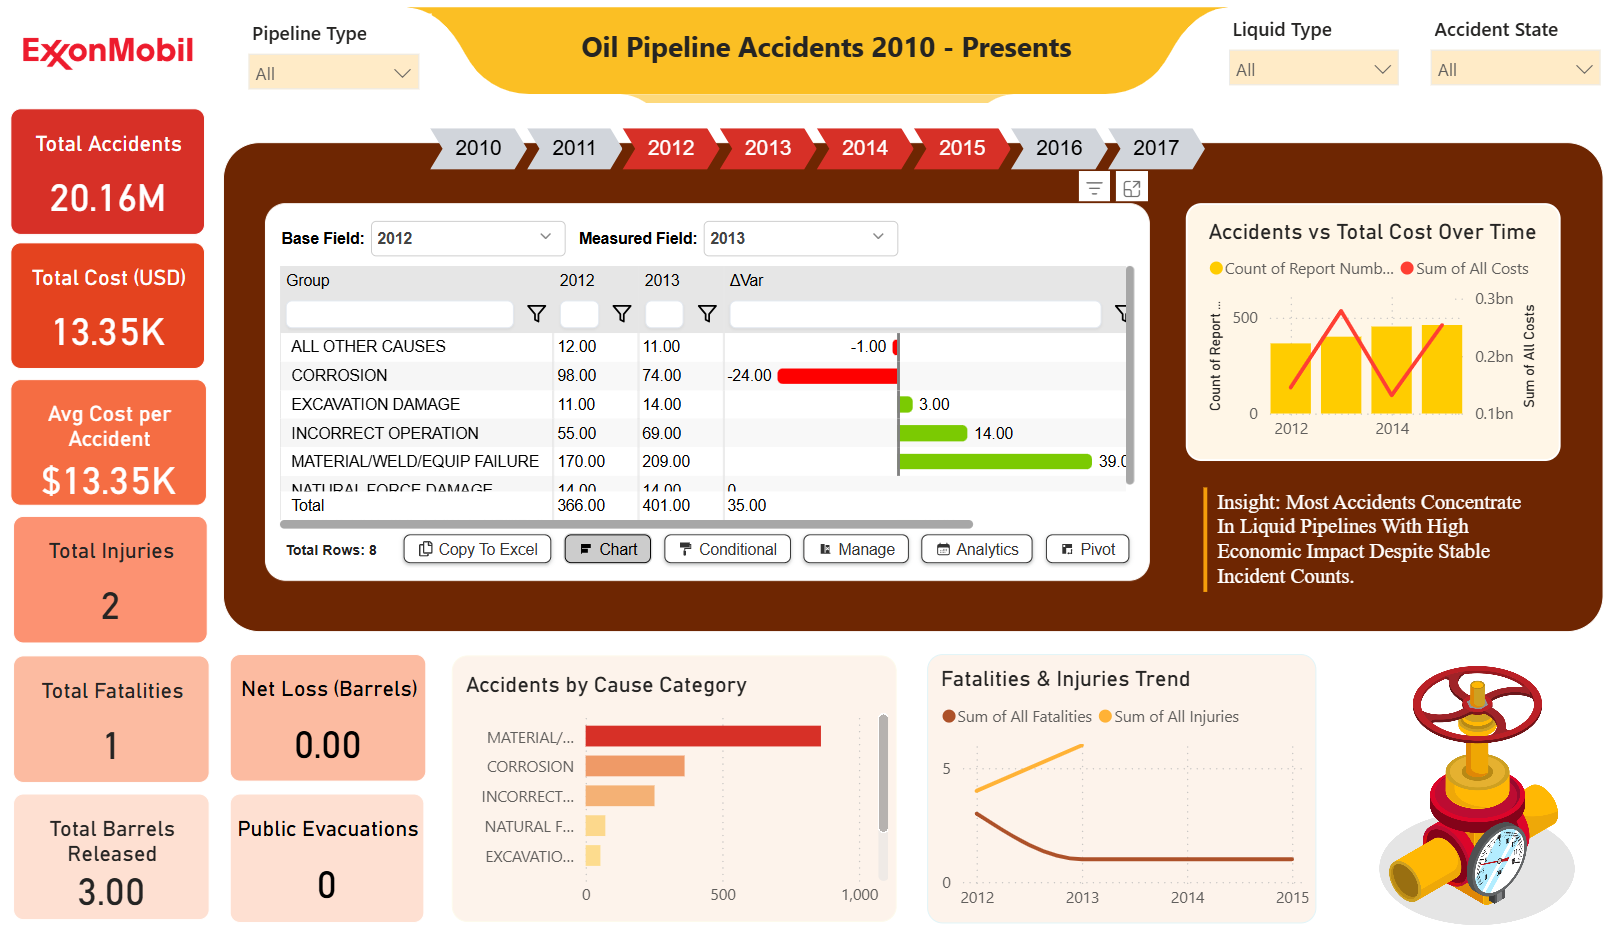
ExxonMobil Oil Pipeline Accidents Dashboard (2010–Present) – Key Insights
 Free Operations & Production
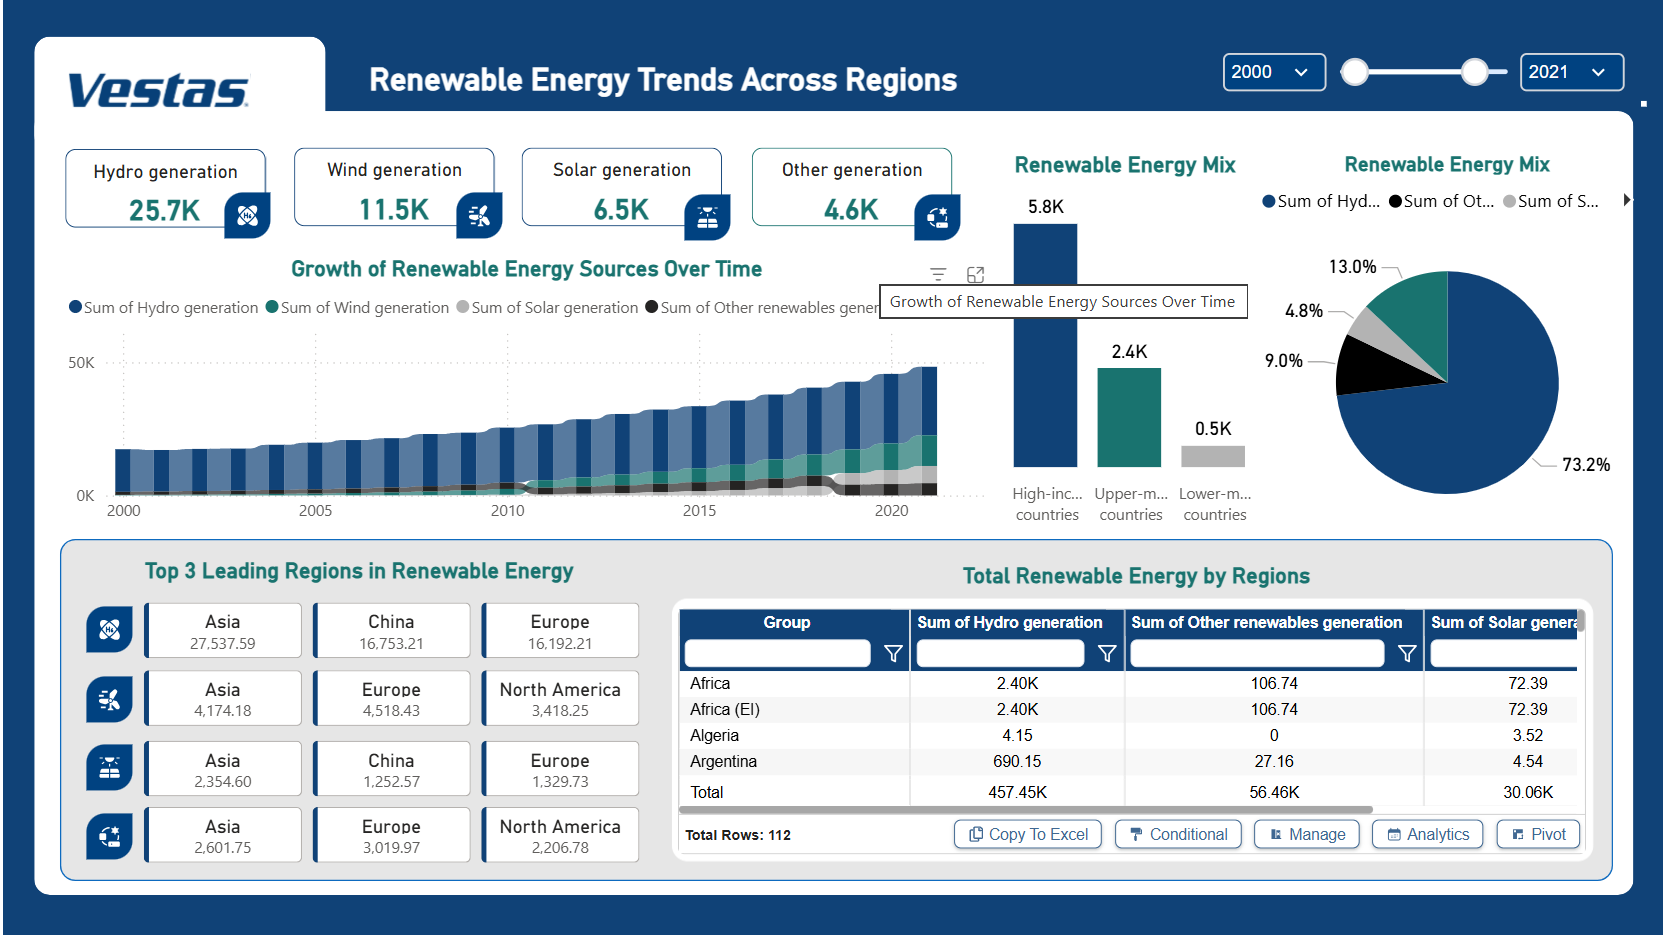
Vestas Renewable Energy Trends Across Regions Dashboard – Key Insights (2000–2021)
 Free Operations & Production
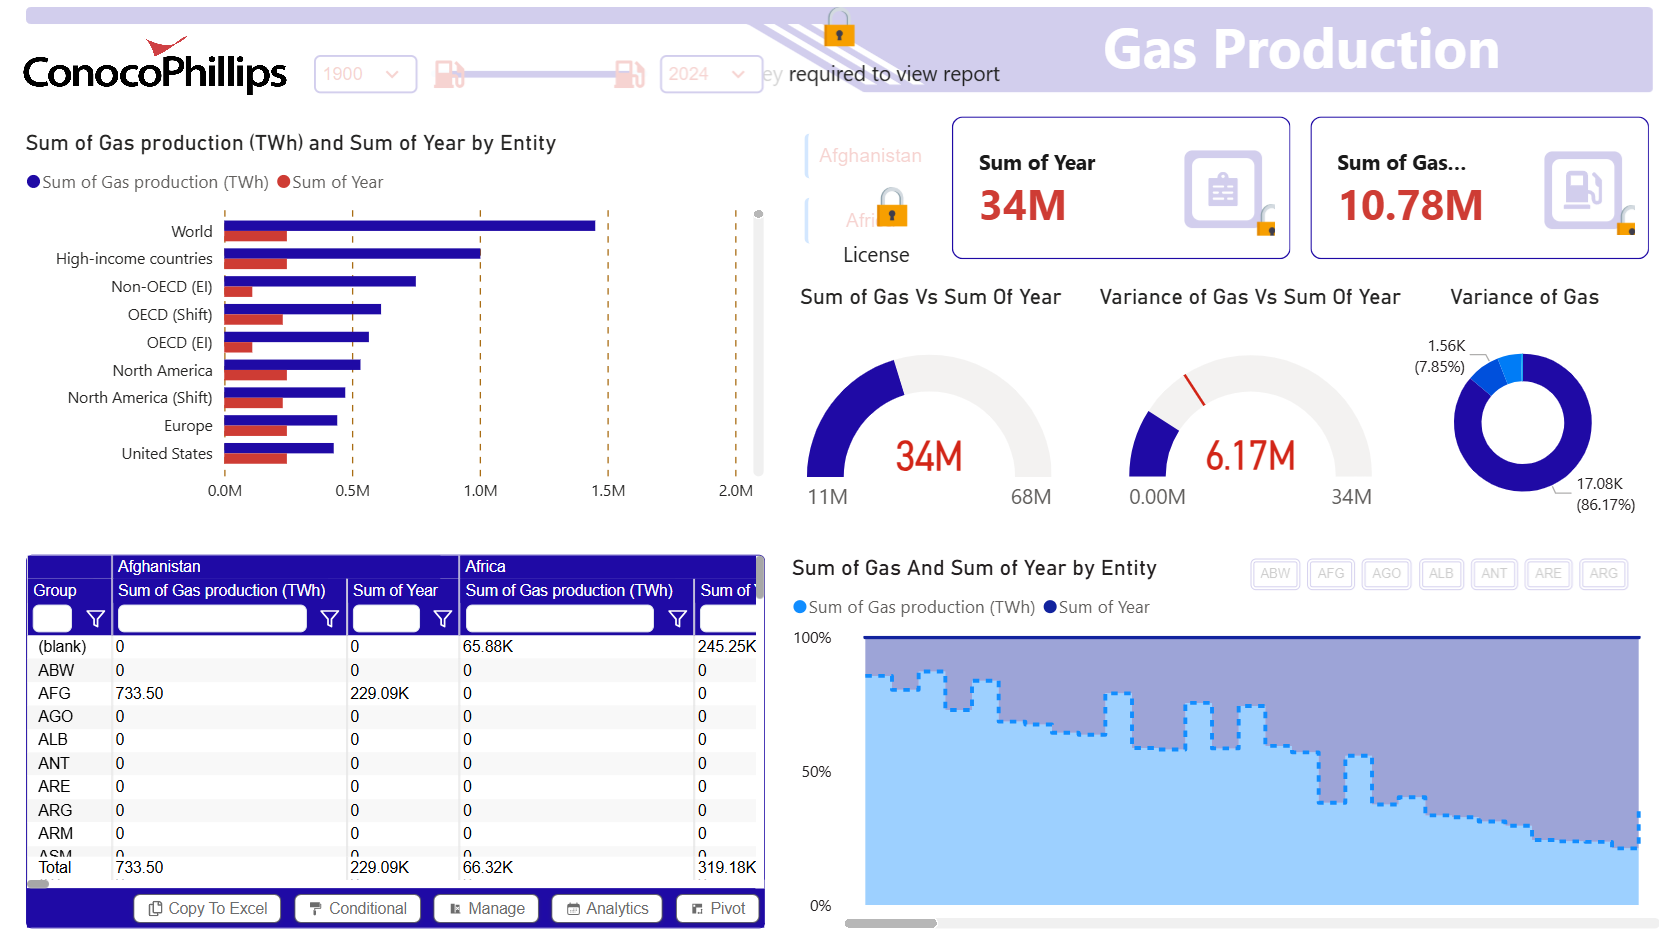
ConocoPhillips Gas Production Dashboard – Key Insights (1900–2024)
If you find this website helpful, share it with friends and colleagues to boost their Power BI skills and work efficiency!
Like this site? Share it