
Oil Production Dashboard – Key Insights (1900–2024)
598 Downloads
Description
High-Level Summary
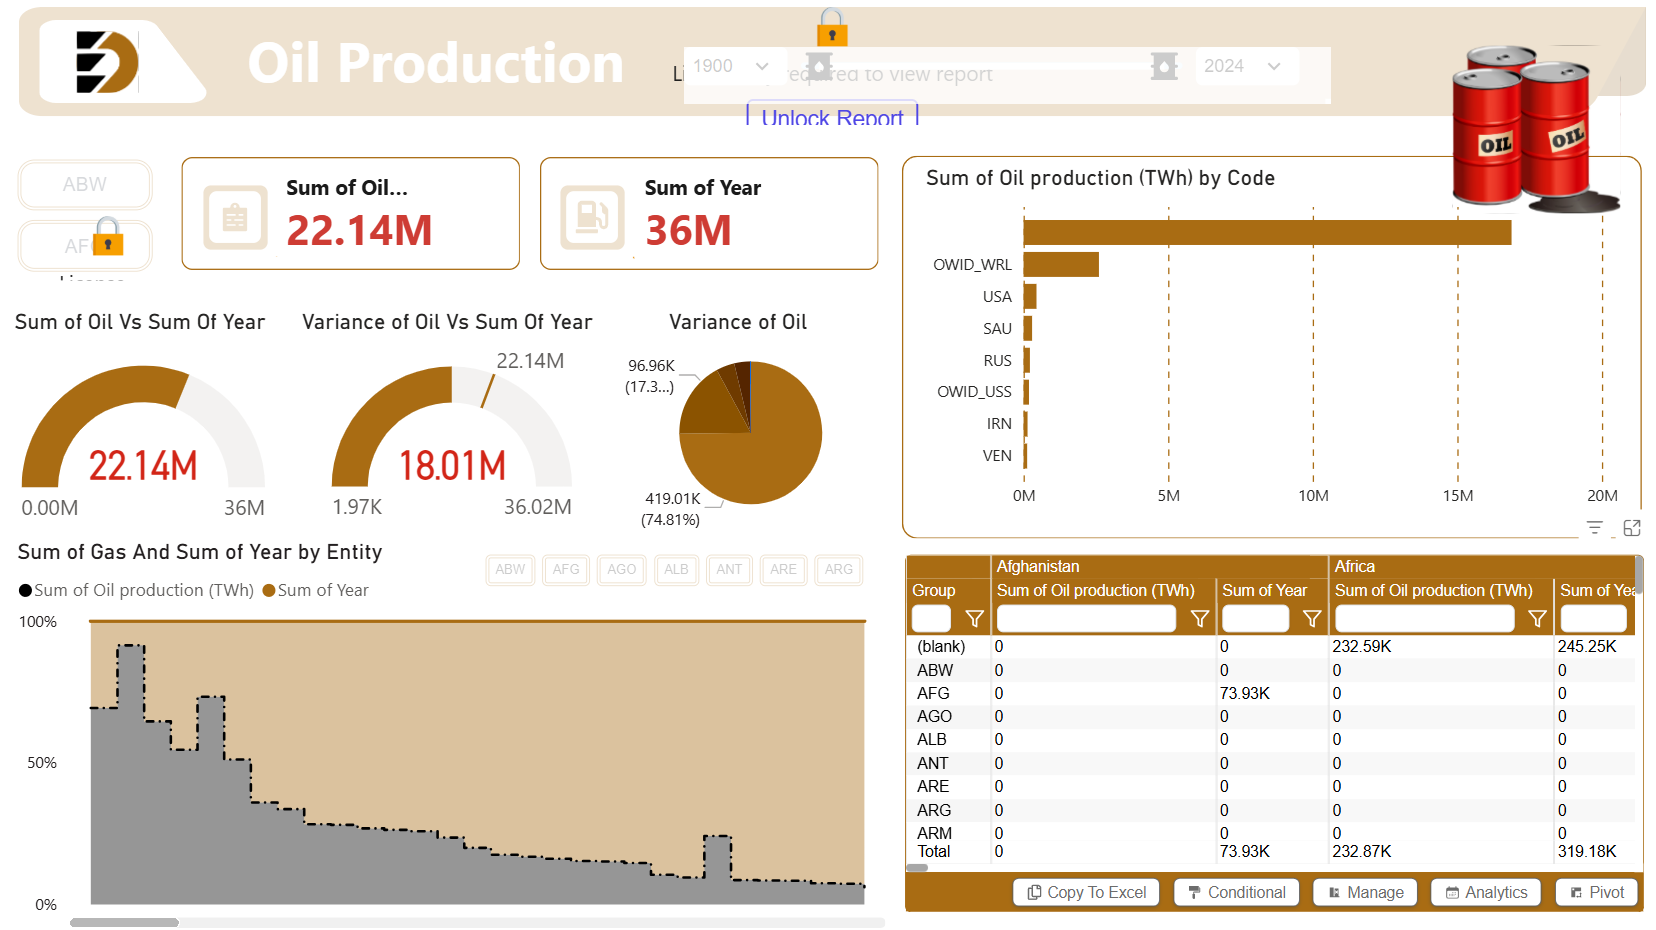
- Total Oil Production: 22.14M TWh (terawatt-hours) over the period.
- Sum of Year: 36M – likely representing cumulative years or a normalized metric (possibly total reporting years across entities).
- Variance Metrics:
- Positive variance: +22.14M (current production).
- Negative variance: –18.01M (perhaps vs baseline or prior period).
- Net variance: +96.96K (17.3% improvement in some contexts).
Production by Country/Code (Top Producers)
- OWID_WRL (World total) – dominant bar, representing global aggregate.
- USA – clear second.
- SAU (Saudi Arabia).
- RUS (Russia).
- OWID_USS (former USSR historical data).
- IRN (Iran).
- VEN (Venezuela).
→ Classic OPEC+ and North American dominance, with world total naturally leading.Regional/Entity Variance Table Highlights
- Africa contributes the bulk of detailed production: 232.87K TWh (Oil Production) vs 319.18K (Sum of Year metric).
- Specific countries like Afghanistan (AFG), Albania (ALB), etc., show zero or negligible production.
- Total across listed entities: ~73.93K (smaller subset).
Trend Insights
- Sum of Oil vs Sum of Year by Entity: Sharp decline from ~100% early in the century to near 0% recently → indicates production concentration in fewer entities over time or data normalization showing maturing fields.
- Overall production has grown massively (22.14M TWh cumulative), but per-entity or per-year efficiency appears to vary significantly.
Key Takeaways
- Extreme Concentration: Global oil production remains heavily dominated by a handful of major players (USA, Saudi Arabia, Russia, historical USSR) – ~70–80% likely from top 5–7 entities.
- Historical Legacy: Inclusion of OWID_USS (former Soviet Union) highlights long-term contribution of Russia and former republics.
- Africa's Role: While not in top individual producers, aggregated Africa shows meaningful output (~233K TWh).
- Data Maturity: Many smaller nations (e.g., ABW Aruba, AFG, ALB) contribute zero, confirming production is limited to ~30–40 key countries globally.
- Positive Net Variance: +17.3% variance suggests recent production exceeding expectations or prior benchmarks in certain segments.
Recommendations
- Geopolitical Risk Management: Diversify supply chains away from over-reliance on USA, Saudi Arabia, and Russia amid ongoing volatility (e.g., OPEC+ decisions, sanctions).
- Monitor Africa Growth: Invest in or partner with stable African producers for medium-term supply growth as traditional fields mature.
- Sustainability Transition: Given concentration and historical trends, accelerate renewable/energy efficiency programs to reduce exposure to volatile concentrated sources.
- Data Enhancement: Unlock full report for granular year-by-year trends and forecasts to better anticipate supply disruptions.
Overall: Global oil production remains highly concentrated among a few superpower producers, with strong historical continuity and meaningful but secondary contributions from regions like Africa. Positive variances are encouraging, but concentration poses ongoing supply-security risks.
Reviews
No reviews yet — be the first to review this template.
Other Templates
Free Operations & Production
Free Operations & Production
Free Sales & Revenue
If you find this website helpful, share it with friends and colleagues to boost their Power BI skills and work efficiency!
Like this site? Share it