PetroChina Global Energy: Oil Production Report – Key Insights (1991–2024)
826 Downloads
Description
Overall Production Summary
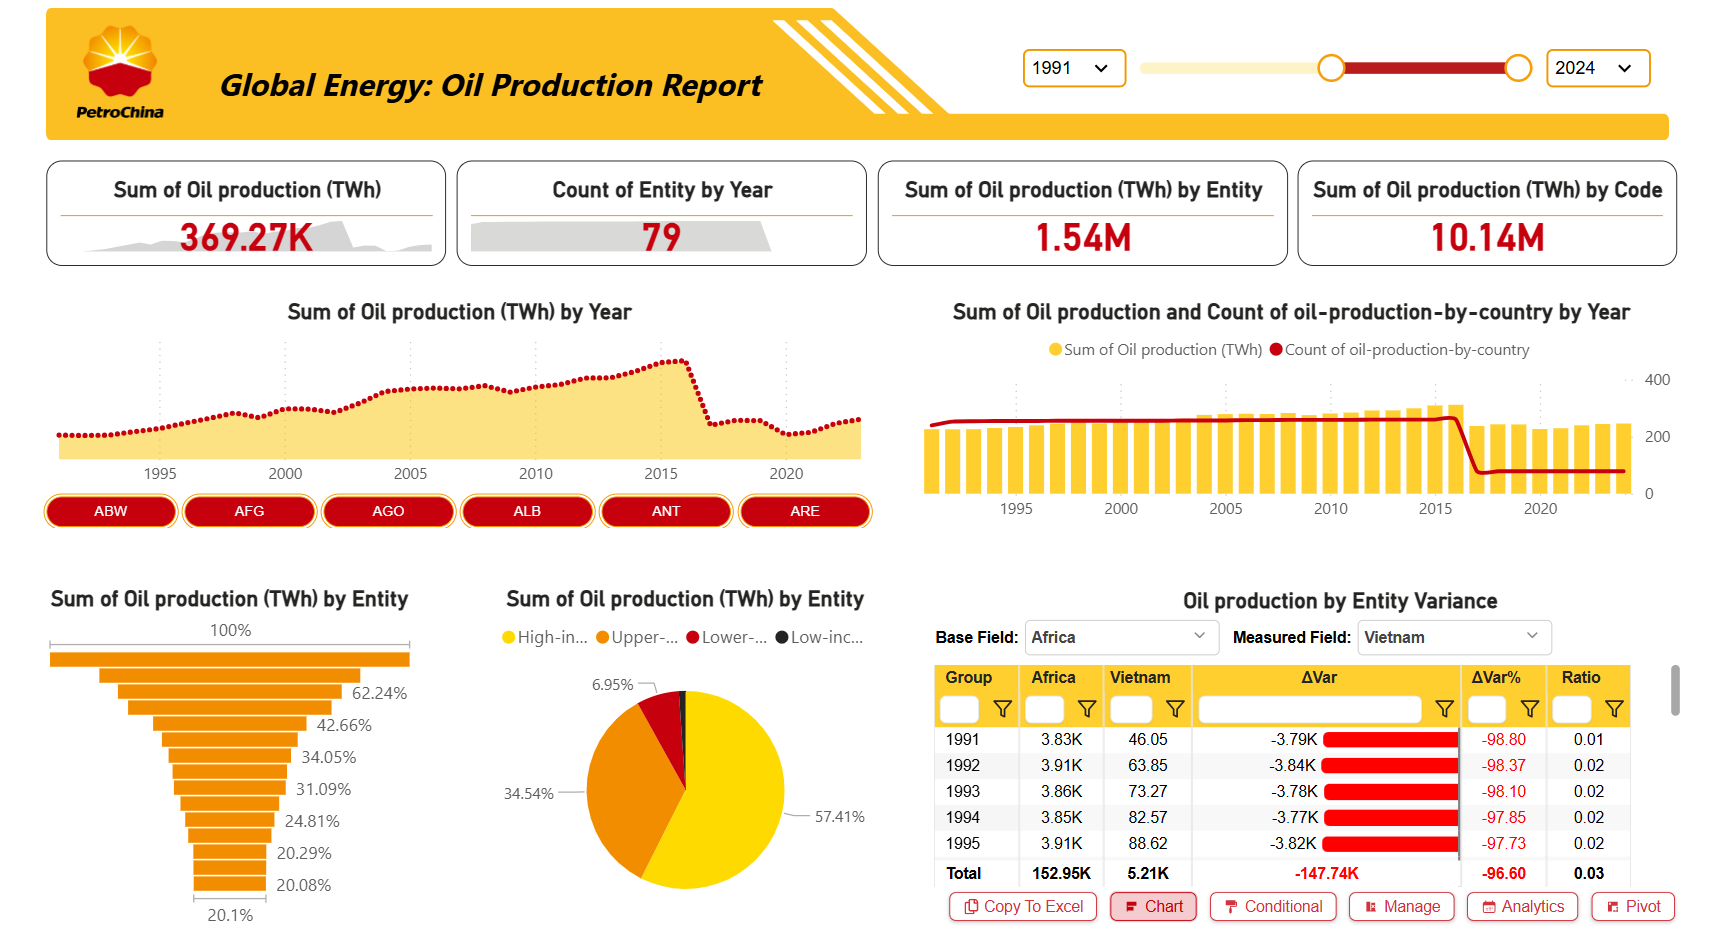
- Total Oil Production: 369.27K TWh across the dataset, with an average of 79 entities (countries) reporting per year.
- Per-Entity Production: Average 1.54M TWh per entity over the period.
- Per-Code Production: 10.14M TWh (likely ISO country codes), indicating aggregated global output.
Temporal Trends
- Annual Production Growth: Oil production steadily increased from ~3K TWh in 1991 to a peak of ~4K TWh around 2015–2018, followed by a gradual decline to ~3.5K TWh by 2024. This suggests a post-peak oil era influenced by factors like OPEC cuts, geopolitical events (e.g., 2014 oil price crash), and energy transitions.
- Country Participation: The count of oil-producing countries remained stable at 80–90 throughout, with a slight dip in recent years – implying consolidation among major producers rather than new entrants.
- Variance Example (Africa vs. Vietnam): Africa's production was consistently higher (3.8K–3.9K TWh annually from 1991–1995) compared to Vietnam's (46–86 TWh), with Vietnam underperforming by 97–99% each year. This highlights regional disparities, with Africa as a stable mid-tier producer and Vietnam as a minor player.
Entity (Country) Distribution
- Top Producers Dominance: The top entity accounts for 62.24% of total production, followed by 46.65% and 42.66% – showing extreme concentration among a few superpowers (likely USA, Saudi Arabia, Russia).
- Income Level Breakdown:
- Upper Middle Income: 57.41% (dominant group, e.g., China, Russia).
- High Income: 34.54% (e.g., USA, Norway).
- Lower Middle Income: 8.05% (e.g., India, Nigeria).
- Low Income: Negligible. → Production is heavily skewed toward wealthier/developing economies with infrastructure advantages.
Key Takeaways
- Peak and Decline: Global oil output peaked mid-2010s, with a ~12–15% drop since, signaling supply constraints, demand shifts to renewables, and efficiency gains.
- Concentration Risks: ~80% of production from top 3–5 entities and upper/high-income groups – vulnerable to geopolitical risks (e.g., Middle East conflicts) or policy changes.
- Stability in Participation: Consistent ~80 countries producing oil, but output per country varies widely, with emerging markets like Vietnam lagging far behind established regions like Africa.
Recommendations
- Diversify Supply Sources: PetroChina should invest in partnerships with lower-middle income entities (e.g., Vietnam-like markets) to mitigate risks from over-reliance on top producers. Explore joint ventures or tech transfers to boost their output by 20–30% over 5 years.
- Transition to Renewables: Given the post-2015 decline, accelerate R&D in green energy (e.g., solar, hydrogen) to offset oil's shrinking share. Target a 15% portfolio shift by 2030 to align with global net-zero goals.
- Efficiency and Monitoring: Use AI-driven analytics to forecast variances (like Africa-Vietnam gaps) and optimize production. Recommend quarterly reviews to identify underperformers and allocate resources for a 5–10% efficiency gain.
- Geopolitical Hedging: Focus on stable regions (e.g., Africa) for new explorations, while lobbying for policies in high-income areas to sustain demand amid EV/renewable transitions.
- Data Enhancement: Unlock full dashboard features (e.g., via license key) for deeper entity-level insights, and integrate real-time 2025 data to track ongoing declines.
The dashboard is designed using Flexa Design, Flexa Tables, and Flexa Charts from Flexa Intel.
Other Templates
 Free Operations & Production
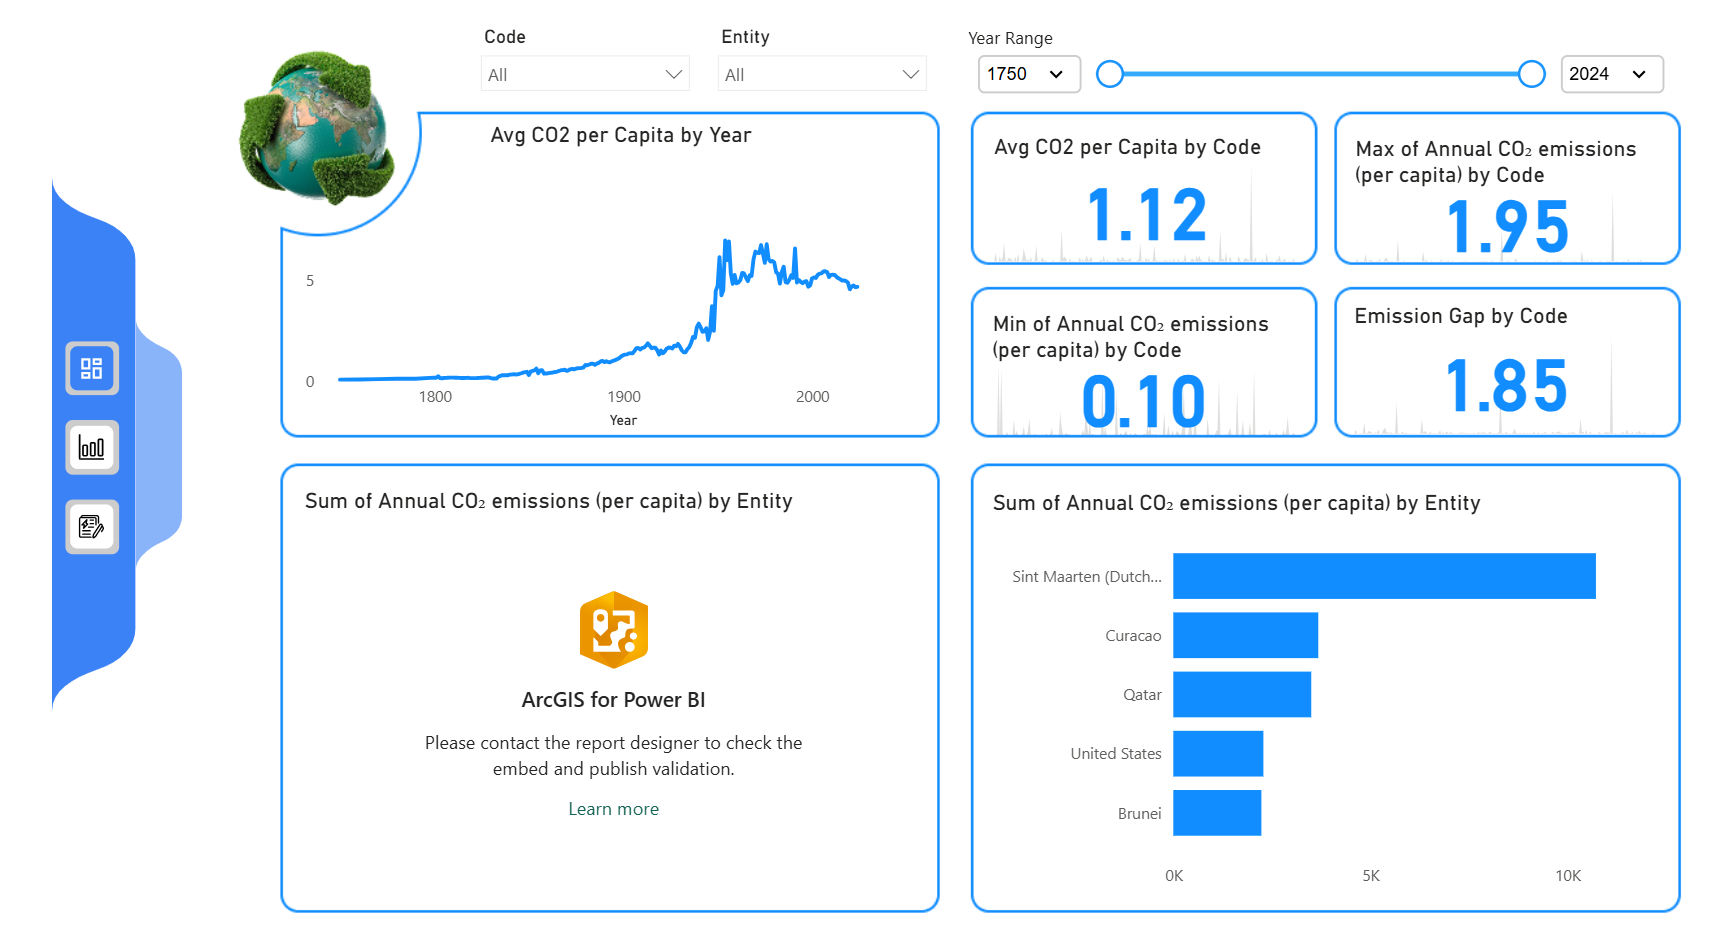
Global CO₂ Emissions Per Capita Dashboard – Key Insights (1750–2024)
541
 Free Sales & Revenue
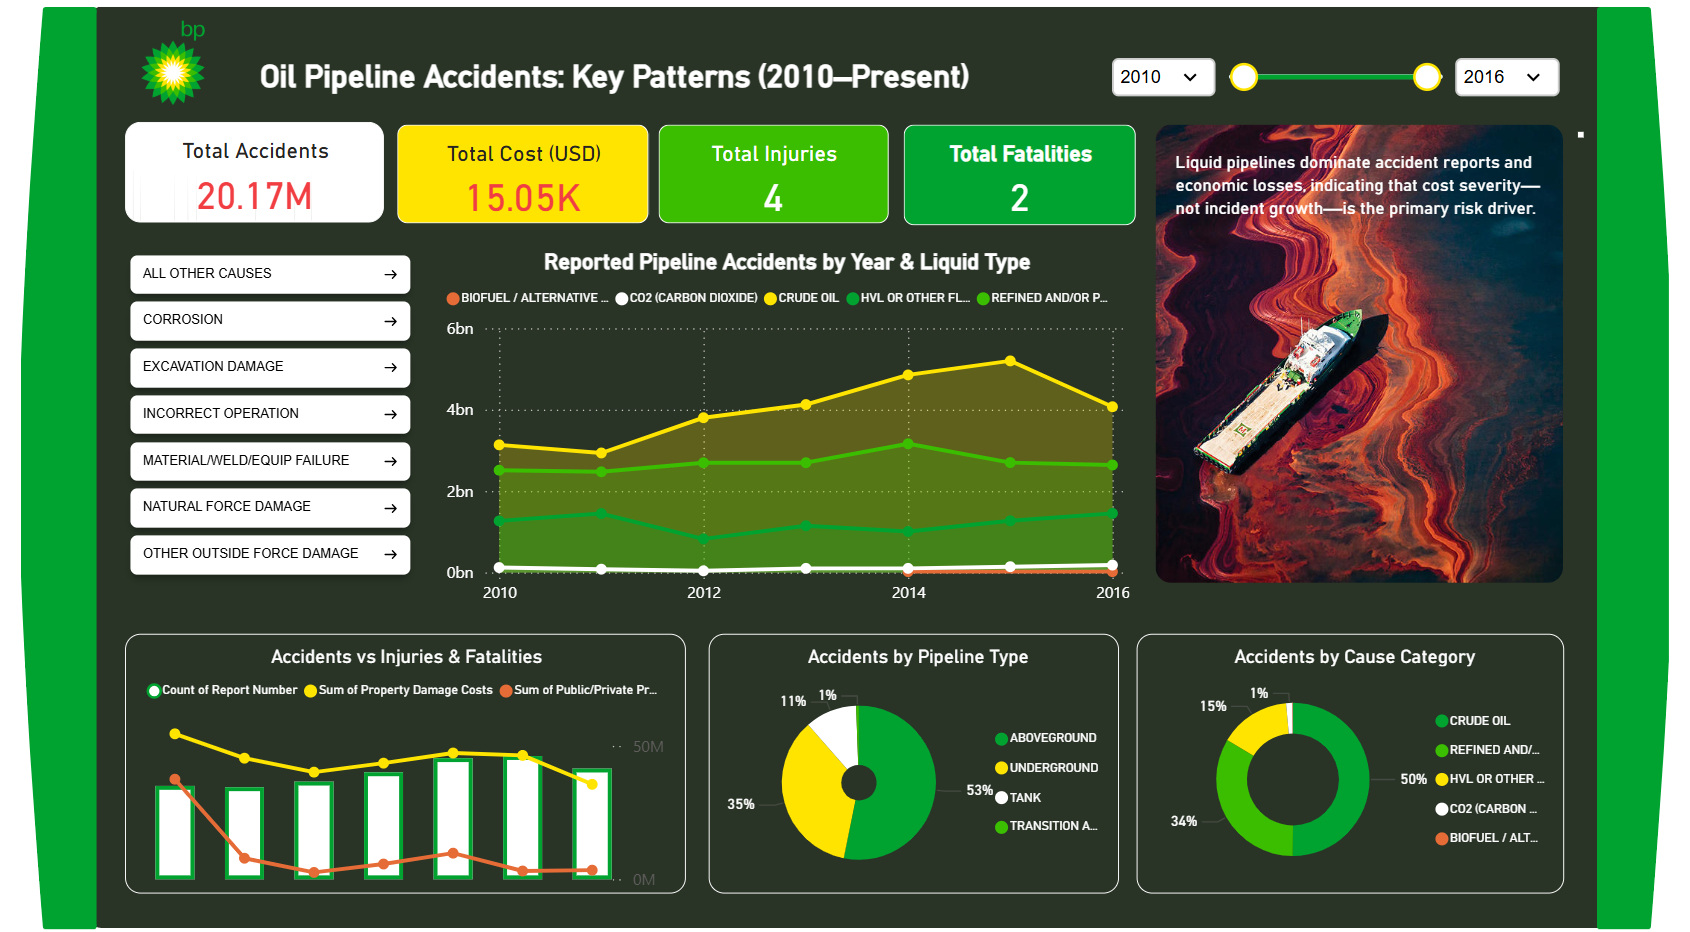
BP Oil Pipeline Accidents: Key Patterns (2010–Present) – Key Insights
866
 Free Operations & Production
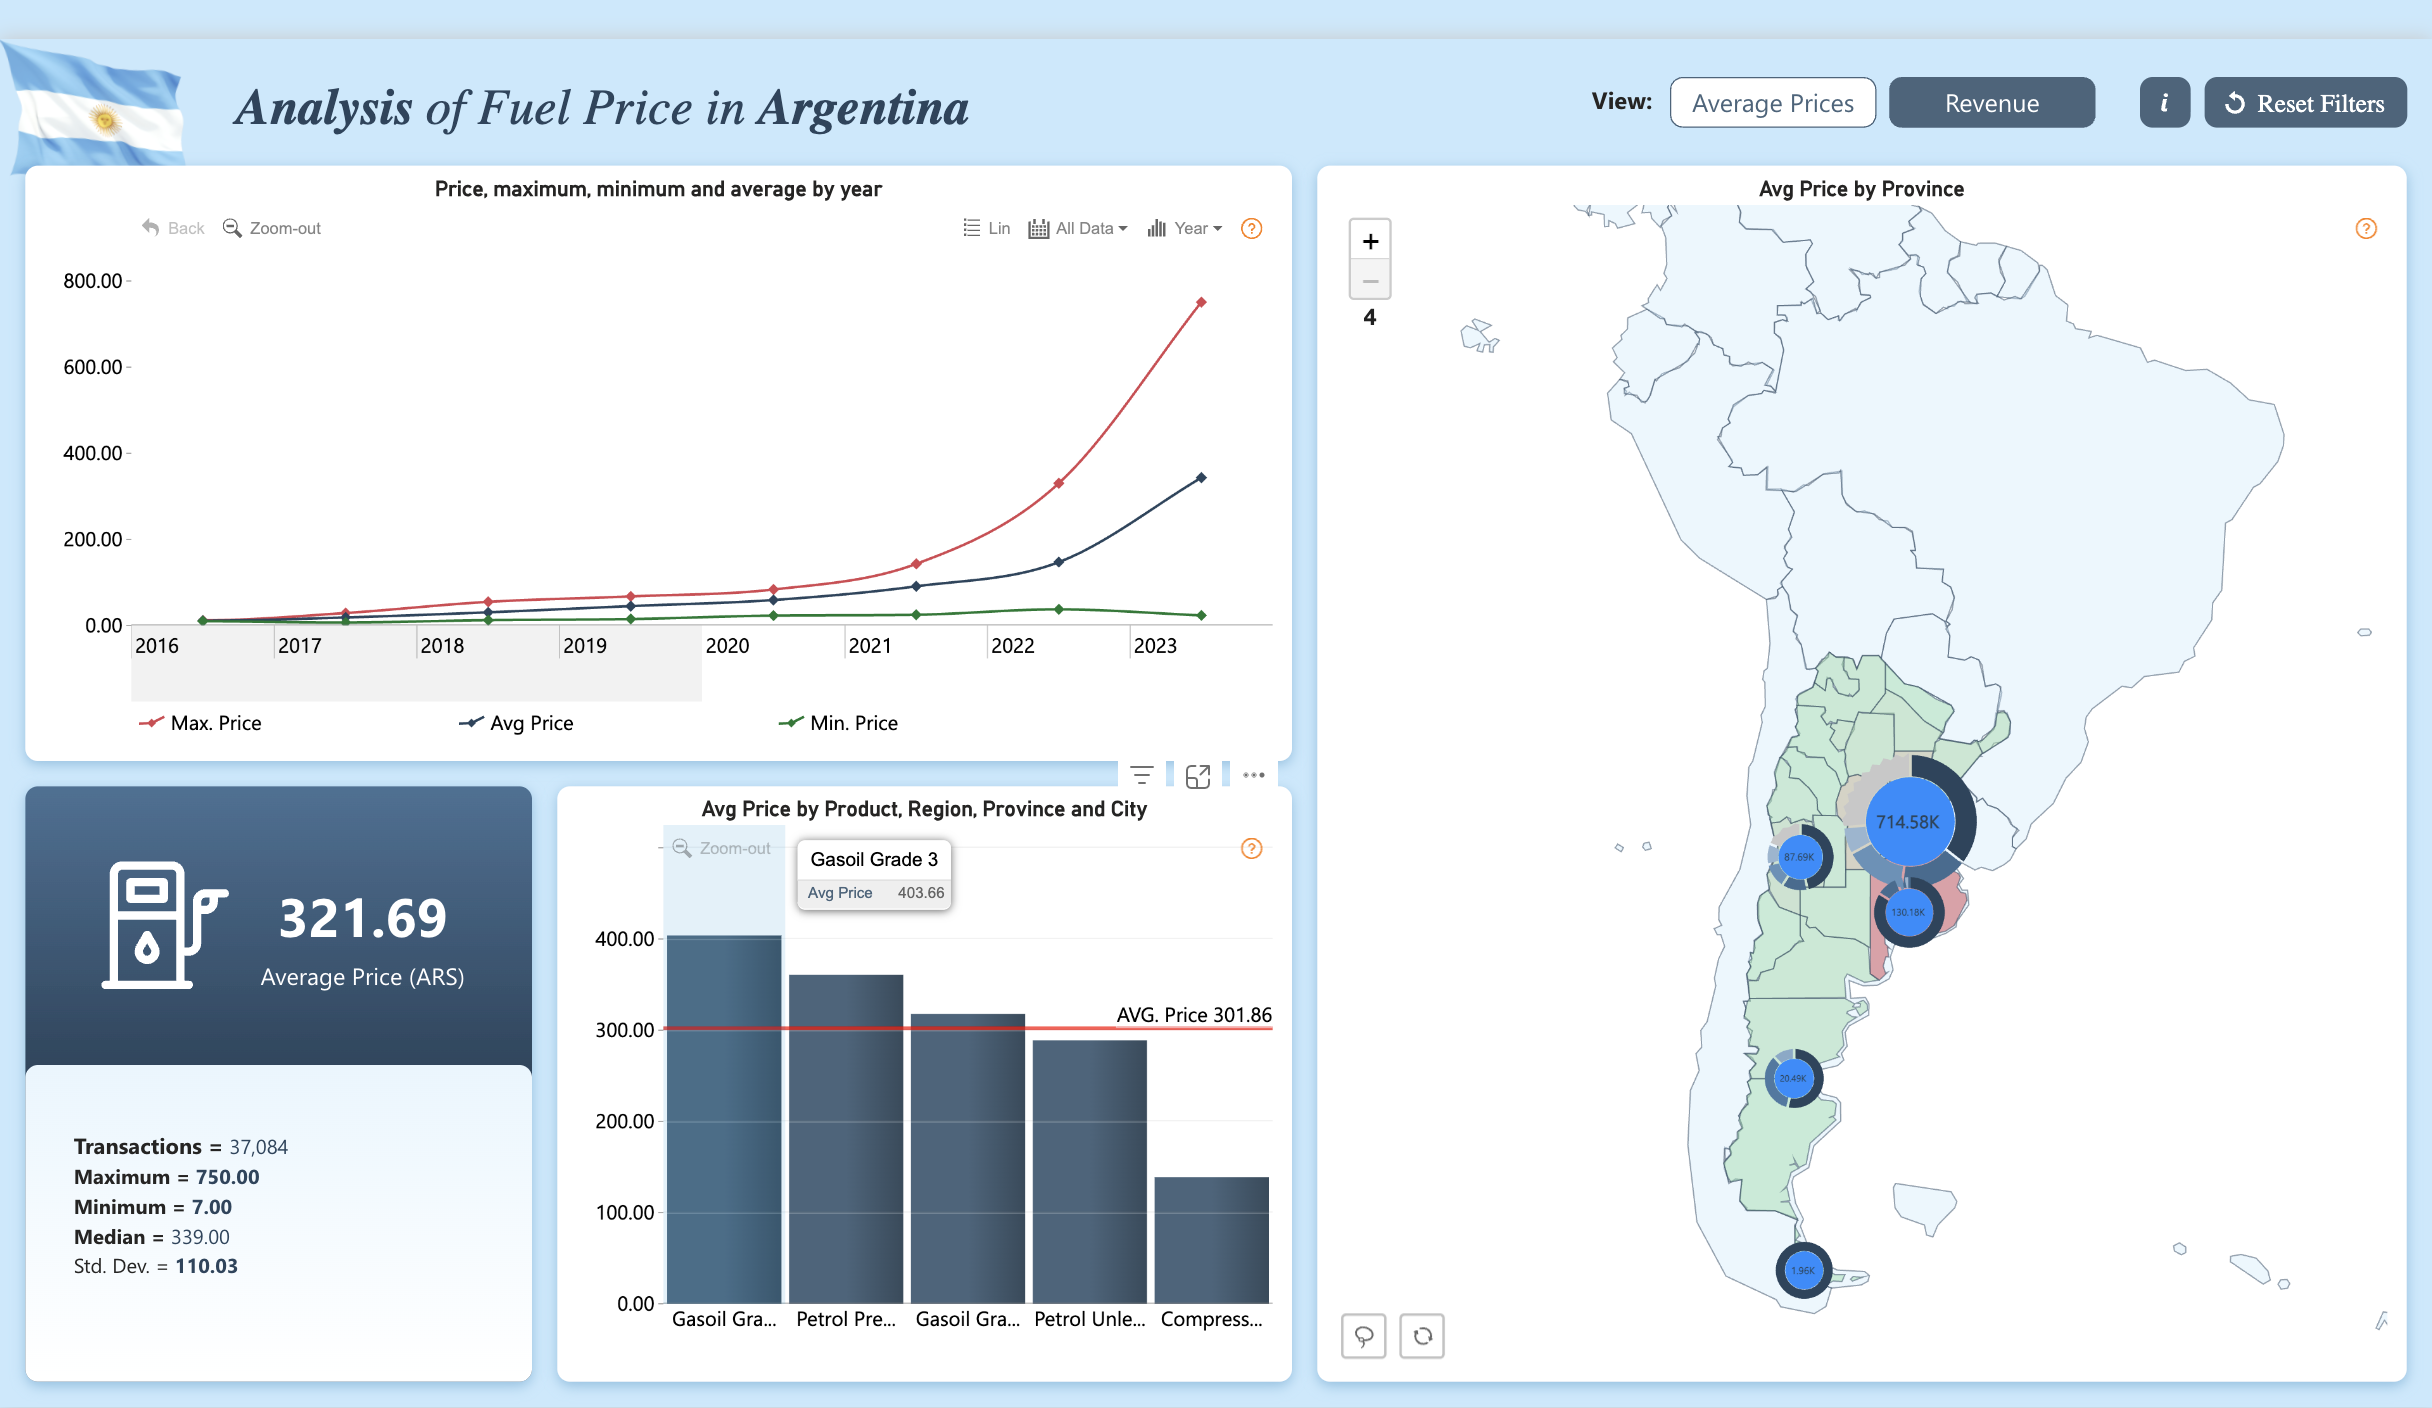
Power BI Argentina Fuel Price Analysis Dashboard Template (Free PBIX Download)
52
If you find this website helpful, share it with friends and colleagues to boost their Power BI skills and work efficiency!
Like this site? Share it