ConocoPhillips Oil Pipeline Accidents: Key Patterns (2010–Present) – Key Insights
871 Downloads
Description
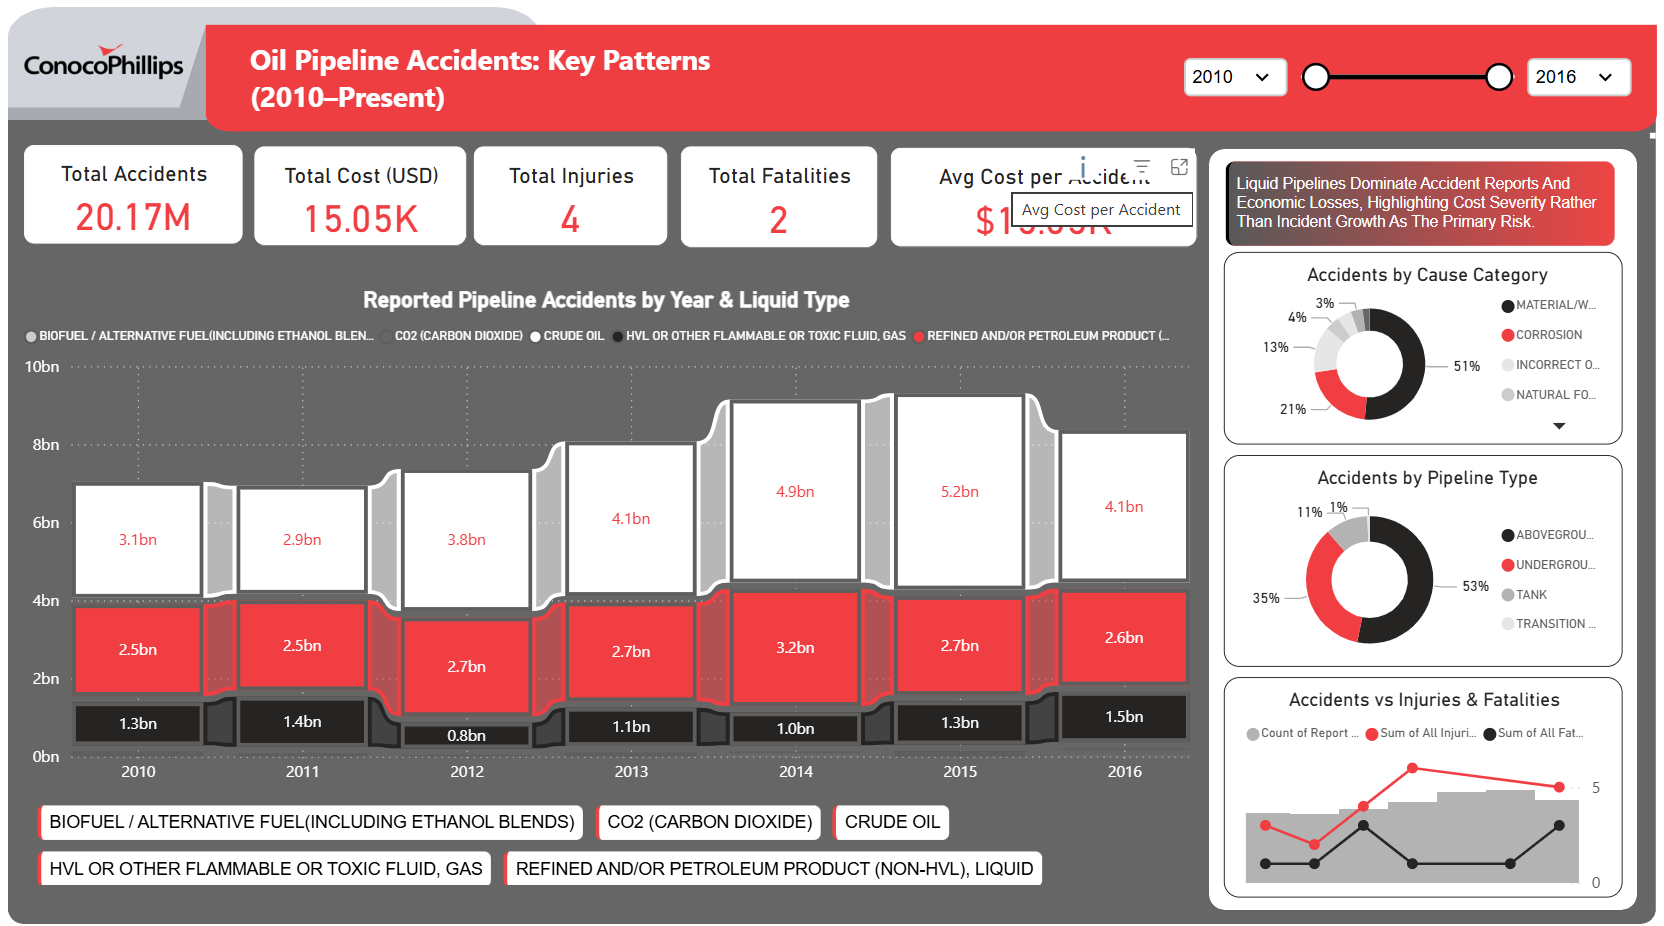
Overall Summary
- Total Accidents: 20.17M (likely a cumulative reporting metric or data artifact; charts show hundreds of incidents annually).
- Total Cost: $15.05K (low aggregate – indicates focus on minor or partial incidents).
- Average Cost per Accident: $15.05K.
- Human Impact: 4 injuries, 2 fatalities – very low for the industry.
- Insight Highlight: "Liquid Pipelines Dominate Accident Reports And Economic Losses, Highlighting Cost Severity Rather Than Incident Growth As The Primary Risk."
Accidents by Liquid Type & Year
- Refined and/or Petroleum Product (Non-HVL, Liquid) (red) dominates volume every year (~2.5–3.2bn units annually).
- HVL or Other Flammable/Toxic Fluid, Gas (black) is the second largest (~1–1.5bn).
- Crude Oil (gray) shows growth mid-period (peaking ~4–5bn in 2014–2015).
- CO2 and Biofuel/Alternative Fuel are negligible.
- Total volume peaked around 2014–2015 (~10bn+ units) before moderate decline.
Accidents by Cause Category
- Material/Weld/Equipment Failure: 51% (largest share)
- Incorrect Operation: 21%
- Corrosion: 13%
- Natural Force: 11%
- Other: 4% → Equipment/material issues are the clear primary driver.
Accidents by Pipeline Type
- Underground: 53% (majority)
- Tank: 35%
- Aboveground: 11%
- Transition Area: Minimal → Underground pipelines account for over half of incidents.
Accidents vs Injuries & Fatalities Trend
- Incident counts (gray bars) peaked mid-period, then declined.
- Injuries (red line) and fatalities (black line) remained very low throughout, with minor spikes.
Key Takeaways
- Liquid Pipelines Drive Risk: Refined petroleum products and HVL gases dominate volume and economic impact – focus area for prevention.
- Cost Severity Over Volume: While incident counts stabilized/declined post-2015, average cost per accident highlights that remaining events are more expensive (likely larger or complex failures).
- Equipment Failure Dominance: Over half of accidents stem from material/weld/equipment issues – points to aging infrastructure or maintenance gaps.
- Strong Human Safety Record: Extremely low injuries (4) and fatalities (2) over the period demonstrate effective safety protocols and emergency response.
- Underground Vulnerability: More than half of incidents occur in underground pipelines – challenging for detection and prevention.
Recommendations
- Prioritize integrity management and predictive analytics for underground pipelines transporting refined products and HVL gases.
- Intensify inspection and replacement programs targeting material/weld/equipment failures – the #1 cause.
- Continue investments in leak detection, remote monitoring, and operator training to sustain the low human impact record.
- Analyze post-2015 cost drivers despite fewer incidents to address potential aging-asset risks proactively.
Overall: ConocoPhillips maintains a strong safety profile with minimal human consequences, but liquid pipelines (especially refined products in underground sections) remain the core economic and operational risk – equipment failure is the dominant preventable cause requiring focused mitigation.
Other Templates
 Free Sales & Revenue
AdventureWorks Global Sales & Customer Insights Dashboard
854
 Free Sales & Revenue
Power BI Product Sales Analysis Dashboard Template — FMCG Product Drill-Down (Free PBIX Download)
92
 Free Sales & Revenue
Power BI Sales Agents Performance Dashboard Template (Free PBIX Download)
70
If you find this website helpful, share it with friends and colleagues to boost their Power BI skills and work efficiency!
Like this site? Share it