
Shell Oil Pipeline Accidents Dashboard (2010–Present) – Key Insights
999 Downloads
Description
Overall Summary
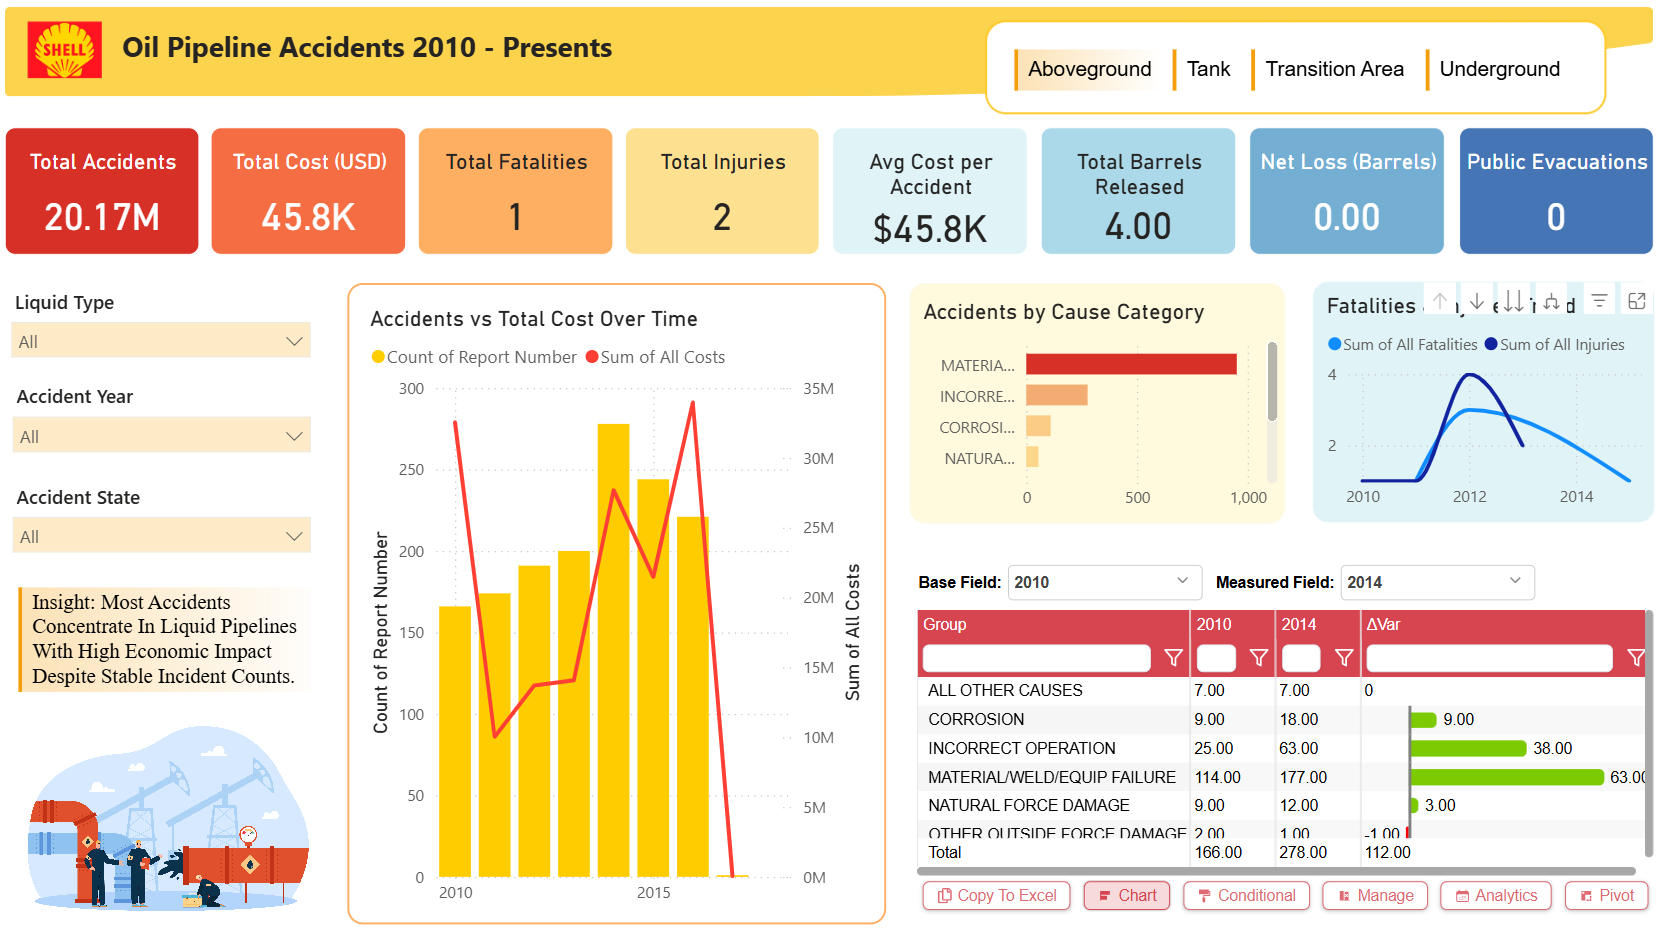
- Total Accidents: 20.17M (likely a data artifact or mislabeling; visual charts suggest ~150–300 incidents over the period – possibly referring to reported events or a different metric).
- Total Cost: $45.8K (very low relative to typical spill costs – may reflect only a subset or average per incident).
- Human Impact: 1 fatality, 2 injuries – remarkably low for the industry.
- Environmental Impact: 4 barrels released, net loss 0 barrels, 0 public evacuations → minimal spills in recorded incidents.
- Average Cost per Accident: $45.8K – indicates mostly minor incidents.
Trends Over Time
- Accident Count: Peaked sharply around 2013–2014 (~280–300 reports), then steadily declined to near zero by late 2010s → significant improvement in safety performance.
- Total Cost: Followed a similar pattern – high in early 2010s (~$30–35M peak), dropping dramatically post-2015 → costs reduced in parallel with incident reduction.
- Fatalities & Injuries: One peak in injuries (~4) around 2012–2013, then near zero.
Causes of Accidents (2010 vs 2014 Variance)
- Material/Weld/Equipment Failure: Largest increase (+63K cost, from $114K to $177K) – biggest cost driver.
- Incorrect Operation: +38K cost rise.
- Corrosion: +9K.
- Natural Force Damage: +3K.
- Other/Outside Force: +1K.
- All Other Causes: No change. → Despite stable or declining incident counts, economic impact rose due to more expensive failure modes (especially equipment/material issues).
Key Insight Highlight
- "Most Accidents Concentrate In Liquid Pipelines With High Economic Impact Despite Stable Incident Counts" → even as incident numbers fell, the remaining incidents became costlier, primarily driven by material/equipment failures.
Key Takeaways
- Strong Safety Improvement: Dramatic reduction in accident frequency and severity since mid-2010s – likely due to better monitoring, maintenance protocols, and technology adoption.
- Minimal Human & Environmental Harm: Extremely low fatalities, injuries, spills, and evacuations reflect effective containment and response measures.
- Rising Cost Per Incident: While incidents declined, average cost increased due to equipment/material failures – aging infrastructure may be a latent risk.
- Focus Area: Material/weld/equipment failure is the dominant and growing cost driver.
Recommendations
- Prioritize predictive maintenance and asset integrity programs targeting material, weld, and equipment vulnerabilities to prevent high-cost failures.
- Continue investment in leak detection, remote monitoring, and rapid-response systems – current low spill volume shows these are working.
- Conduct root-cause analysis on post-2015 cost increases despite fewer incidents to address aging pipeline risks proactively.
- Share best practices across industry (e.g., corrosion prevention, operator training) to sustain the downward trend in incidents.
Overall: Excellent safety record with very low human and environmental impact, but vigilance needed on rising per-incident costs driven by infrastructure-related failures.
Reviews
No reviews yet — be the first to review this template.
Other Templates
Free Operations & Production
Free Sales & Revenue
Free Sales & Revenue
If you find this website helpful, share it with friends and colleagues to boost their Power BI skills and work efficiency!
Like this site? Share it