The Movie DB Overview dashboard
1089 Downloads
Description
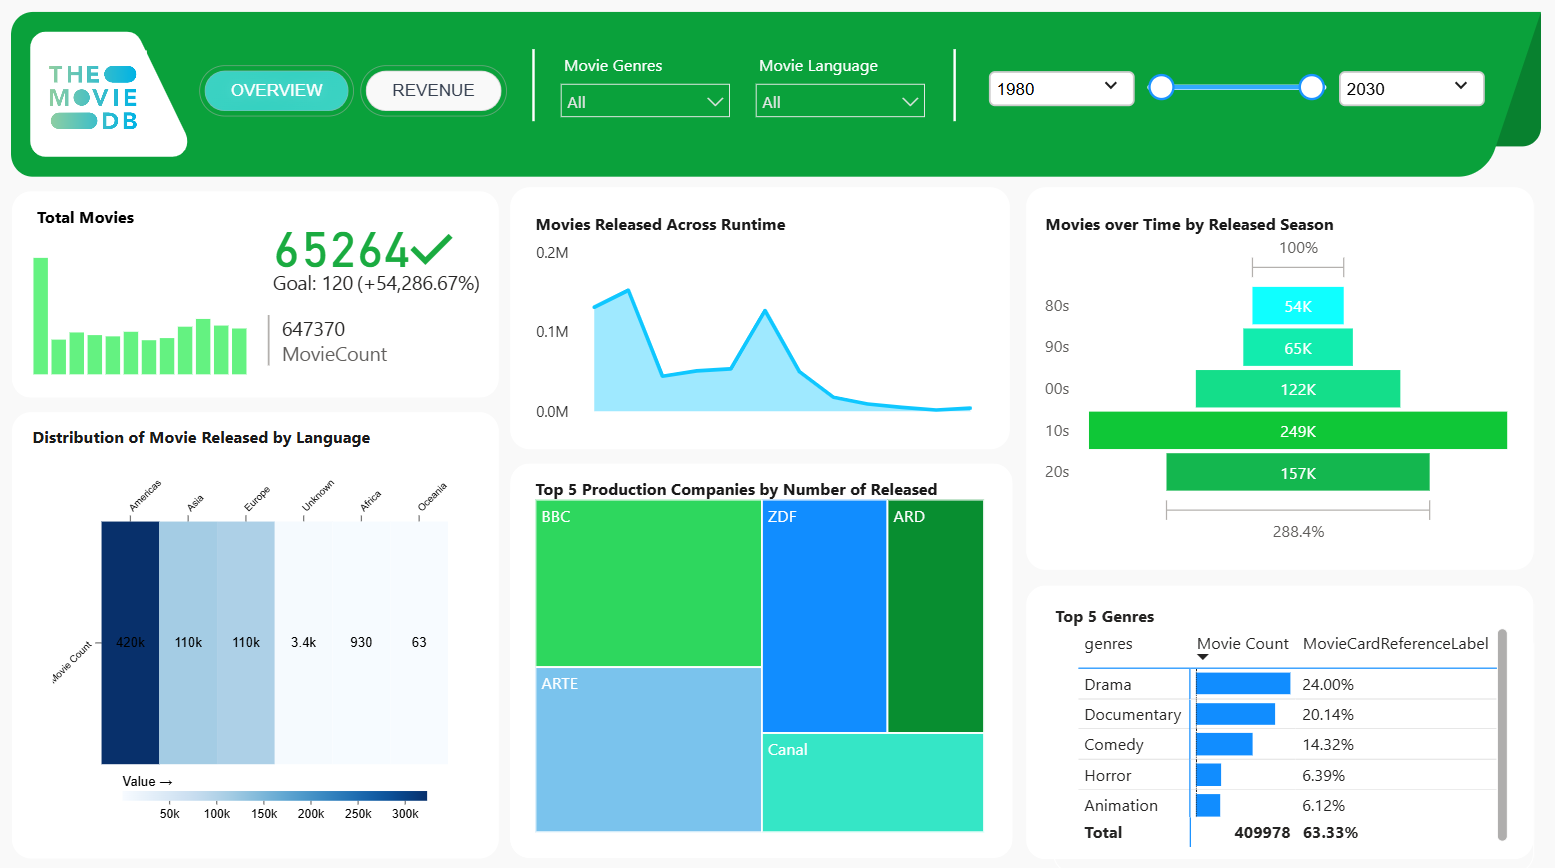
The Movie DB Overview dashboard (1980–2030) provides the following key insights:
- Total Movies: 65,264, 54,286.67% above the goal of 120, with a current MovieCount of 64,7370.
- Movies Released Across Runtime: Peak at ~0.15M movies around 100–120 minutes, with a sharp decline beyond 150 minutes.
- Movies over Time by Released Season (Decade):
- 2010s: 249K (highest volume)
- 2020s: 157K
- 2000s: 122K
- 1990s: 65K
- 1980s: 54K
- Growth surged post-2000, peaking in the 2010s.
- Distribution of Movies Released by Language:
- Americas: ~420K (dominant)
- Asia: 110K
- Europe: 110K
- Unknown: 3.4K
- Africa: 930
- Oceania: 63
- Top 5 Production Companies by Number of Released Movies:
- BBC
- ZDF
- ARD
- ARTE
- Canal
- Top 5 Genres (Total: 409,978 movies, 63.33% of dataset):
- Drama: 24.00%
- Documentary: 20.14%
- Comedy: 14.32%
- Horror: 6.39%
- Animation: 6.12%
The dashboard is designed using Flexa Design, Flexa Tables, and Flexa Charts from Flexa Intel.
Other Templates
 $18Sales & Revenue
CRM Microsoft Power BI Dashboard Template
0
 Free Other / General
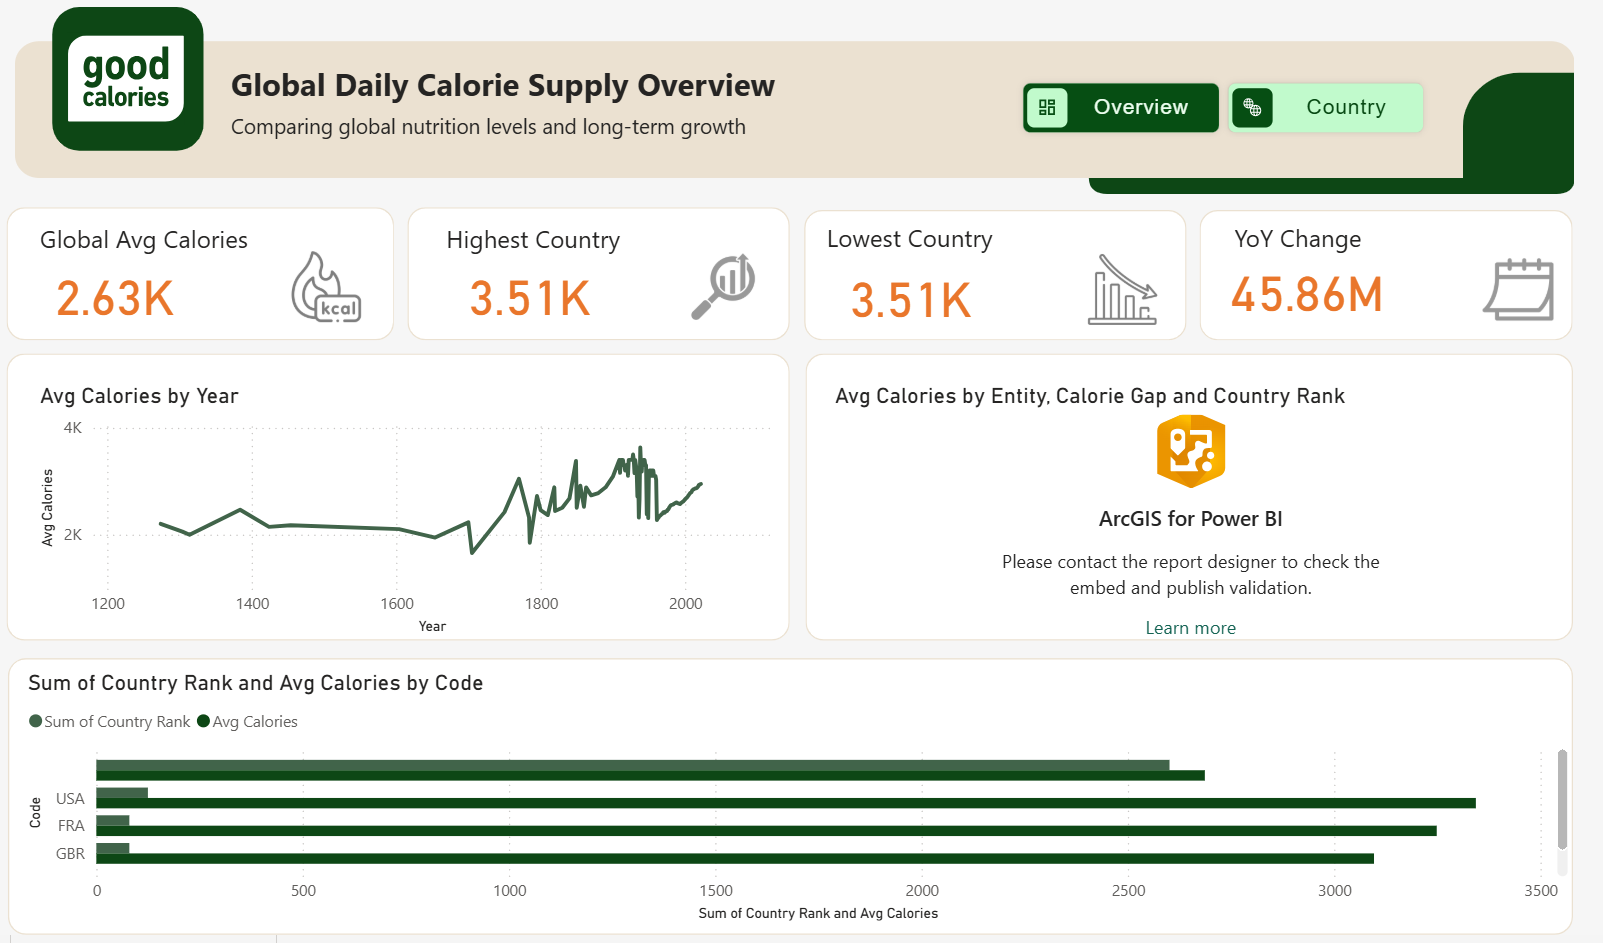
Global Calorie Supplies
502
 Free Other / General
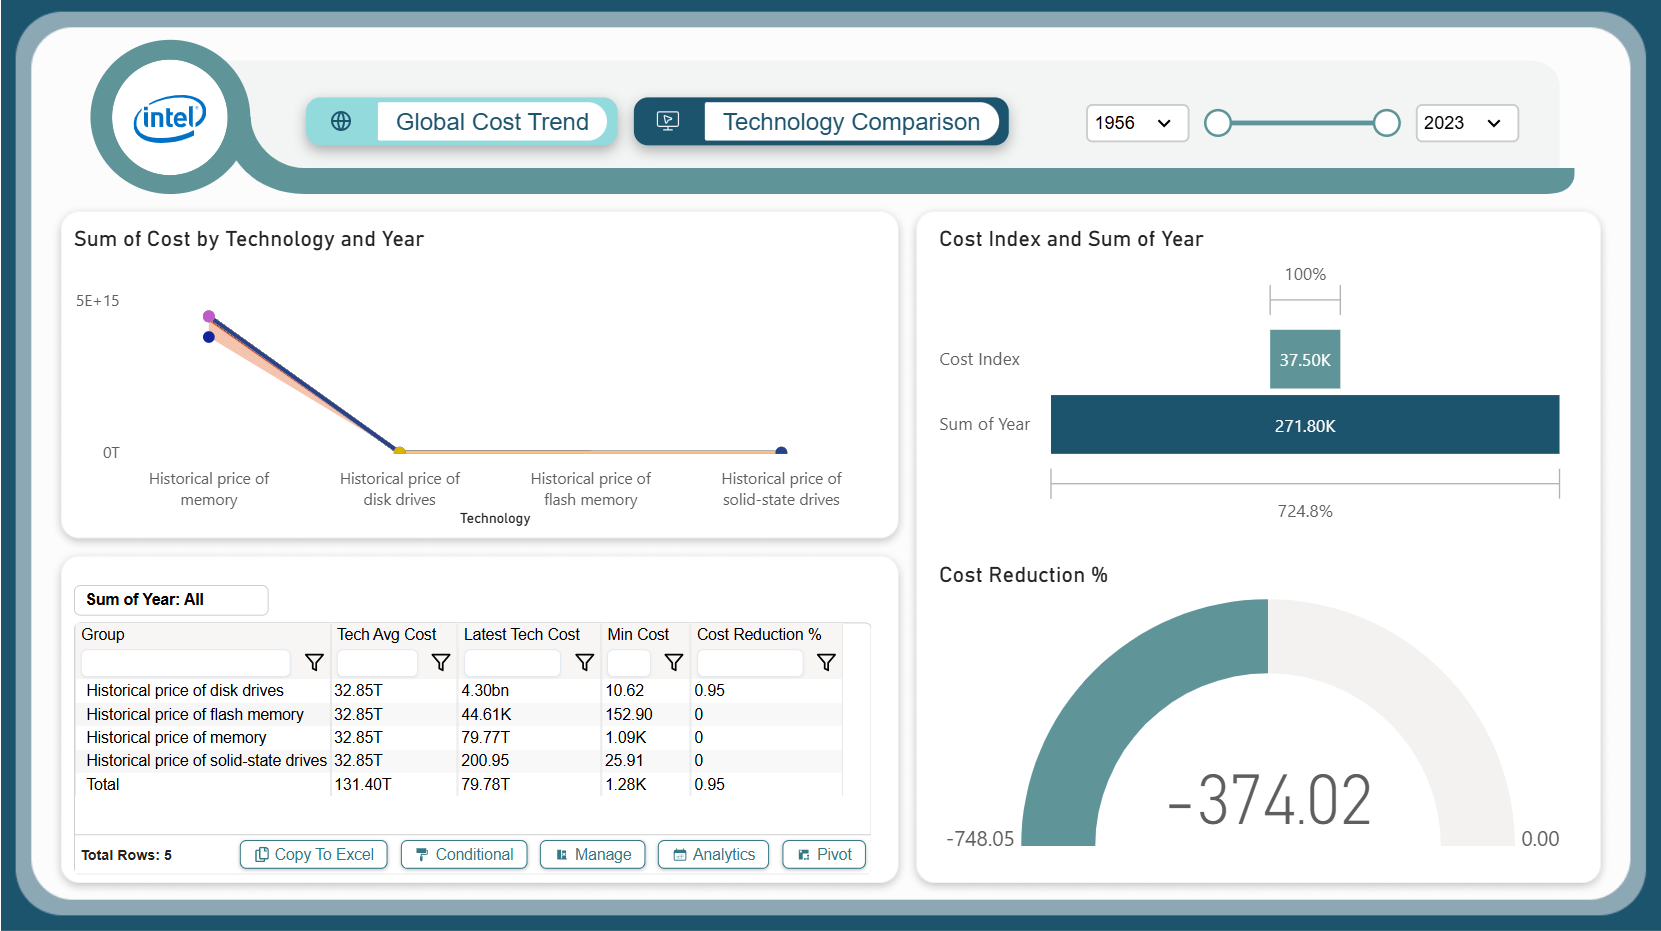
Intel Storage Cost Trends Dashboard – Key Insights (1956–2023)
745
If you find this website helpful, share it with friends and colleagues to boost their Power BI skills and work efficiency!
Like this site? Share it