Adventure Works Report
1222 Downloads
Description
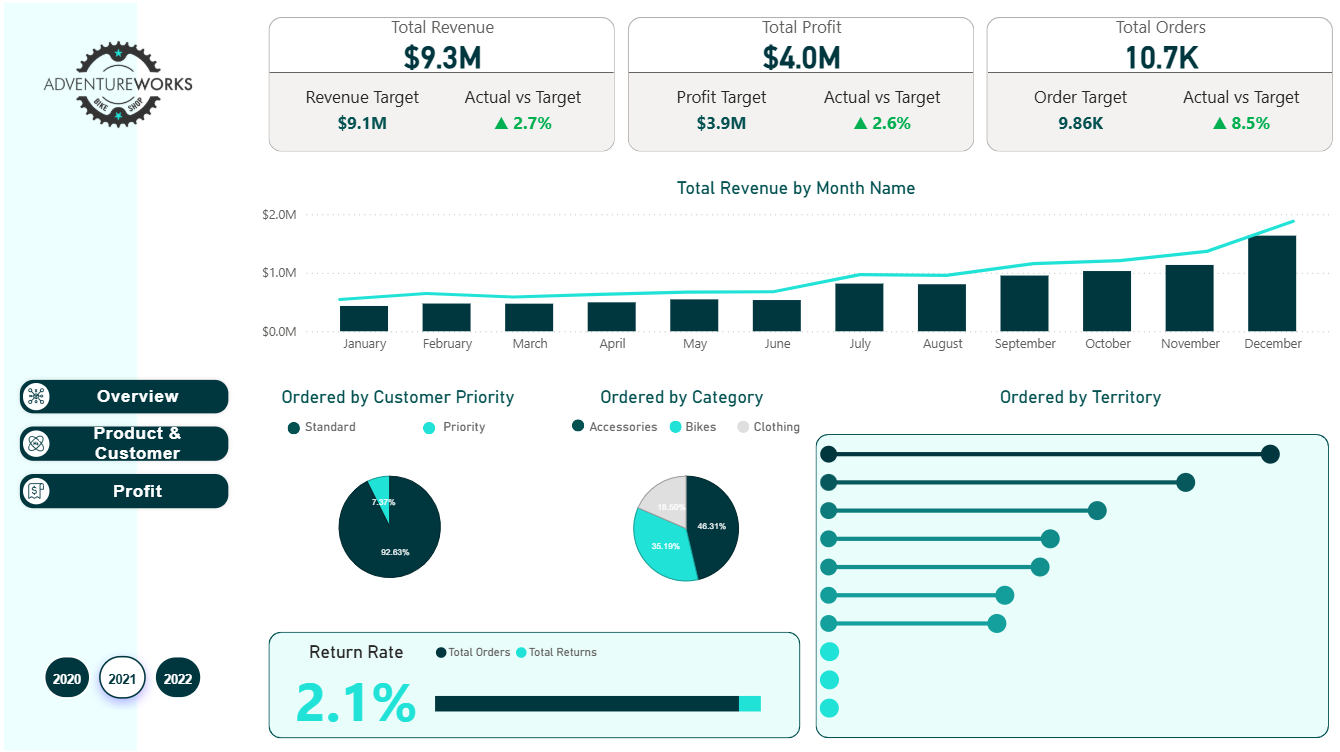
The AdventureWorks dashboard provides the following insights for the current period:
- Total Revenue: $9.3M, exceeding the target of $9.1M by 2.7%.
- Total Profit: $4.0M, surpassing the target of $3.9M by 2.6%.
- Total Orders: 10.7K, above the target of 9.8K by 8.5%.
- Total Revenue by Month: Steady growth observed, with a significant increase in November and December.
- Ordered by Customer Priority: 92.63% standard, 7.37% high priority.
- Ordered by Category: 46.31% Accessories, 35.19% Bikes, 18.50% Clothing.
- Ordered by Territory: Australia leads with 2.6K, followed by Southwest (2.1K), Northwest (1.6K), Canada (1.3K), United Kingdom (1.2K), France (1K), Germany (974), Southeast (6), Northeast (5), and Central (4).
- Return Rate: 2.1%, indicating a low return rate relative to total orders.
Overall, AdventureWorks shows strong performance with revenue, profit, and orders exceeding targets, and a healthy distribution across territories and categories.
The dashboard is designed using Flexa Design, Flexa Tables, and Flexa Charts from Flexa Intel.
Other Templates
 Free Other / General
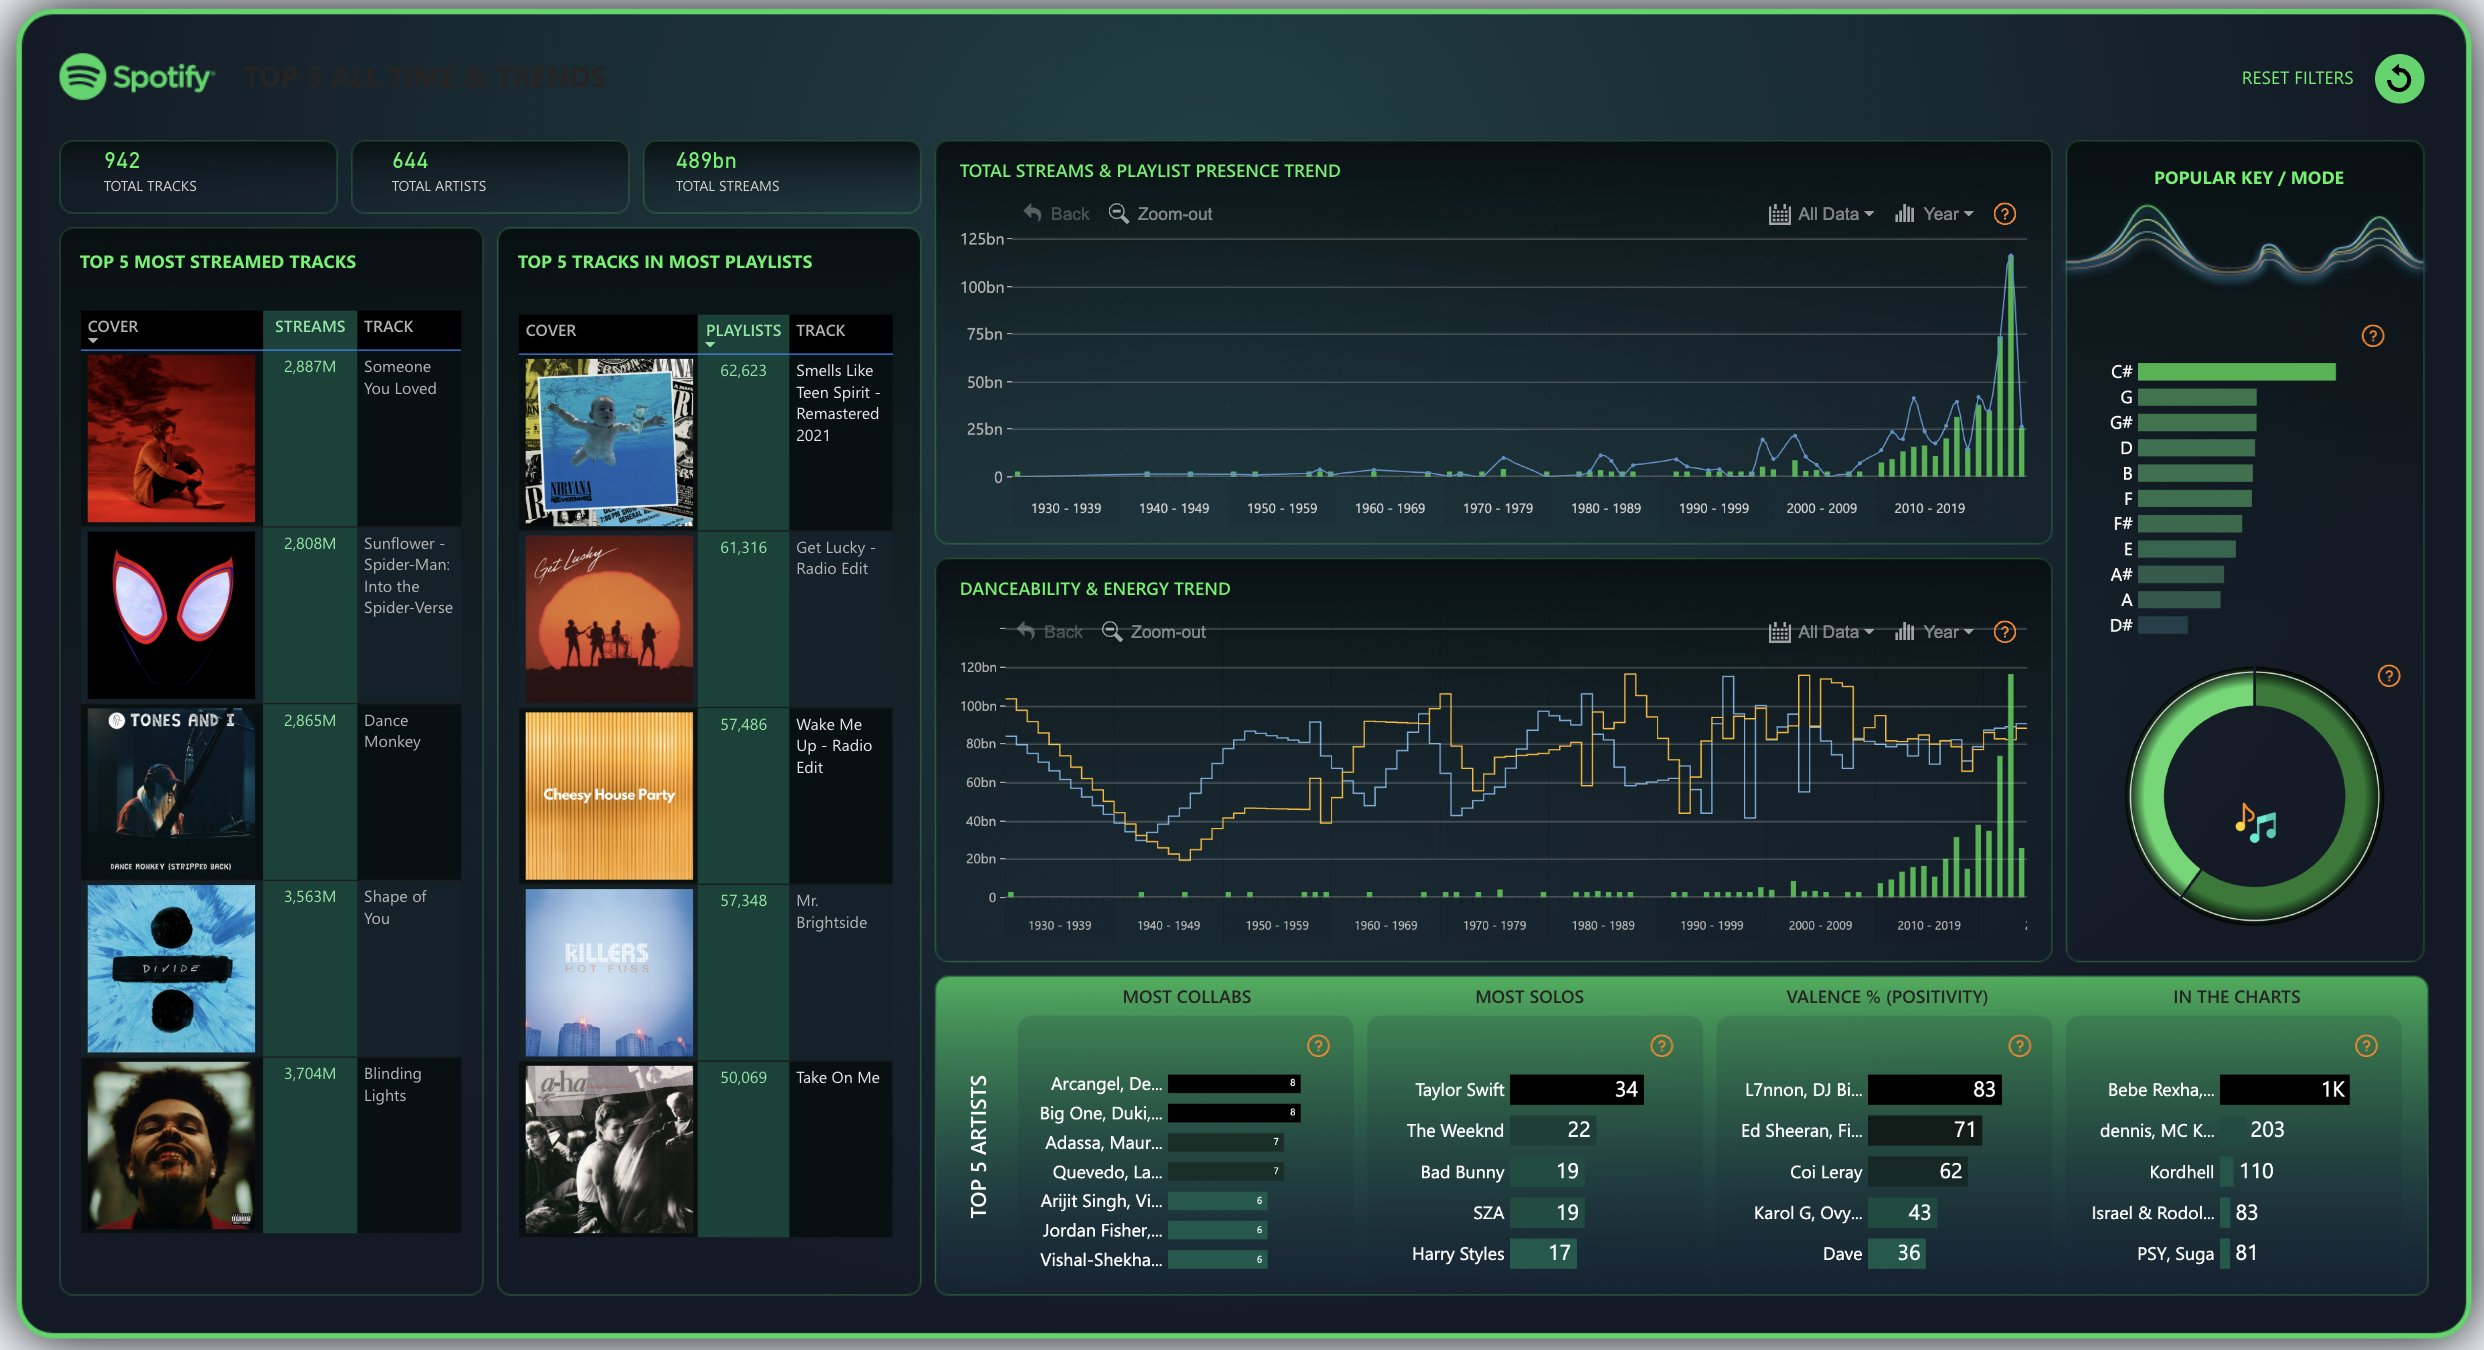
Power BI Spotify Music Analytics Dashboard Template (Free PBIX Download)
70
 Free Other / General
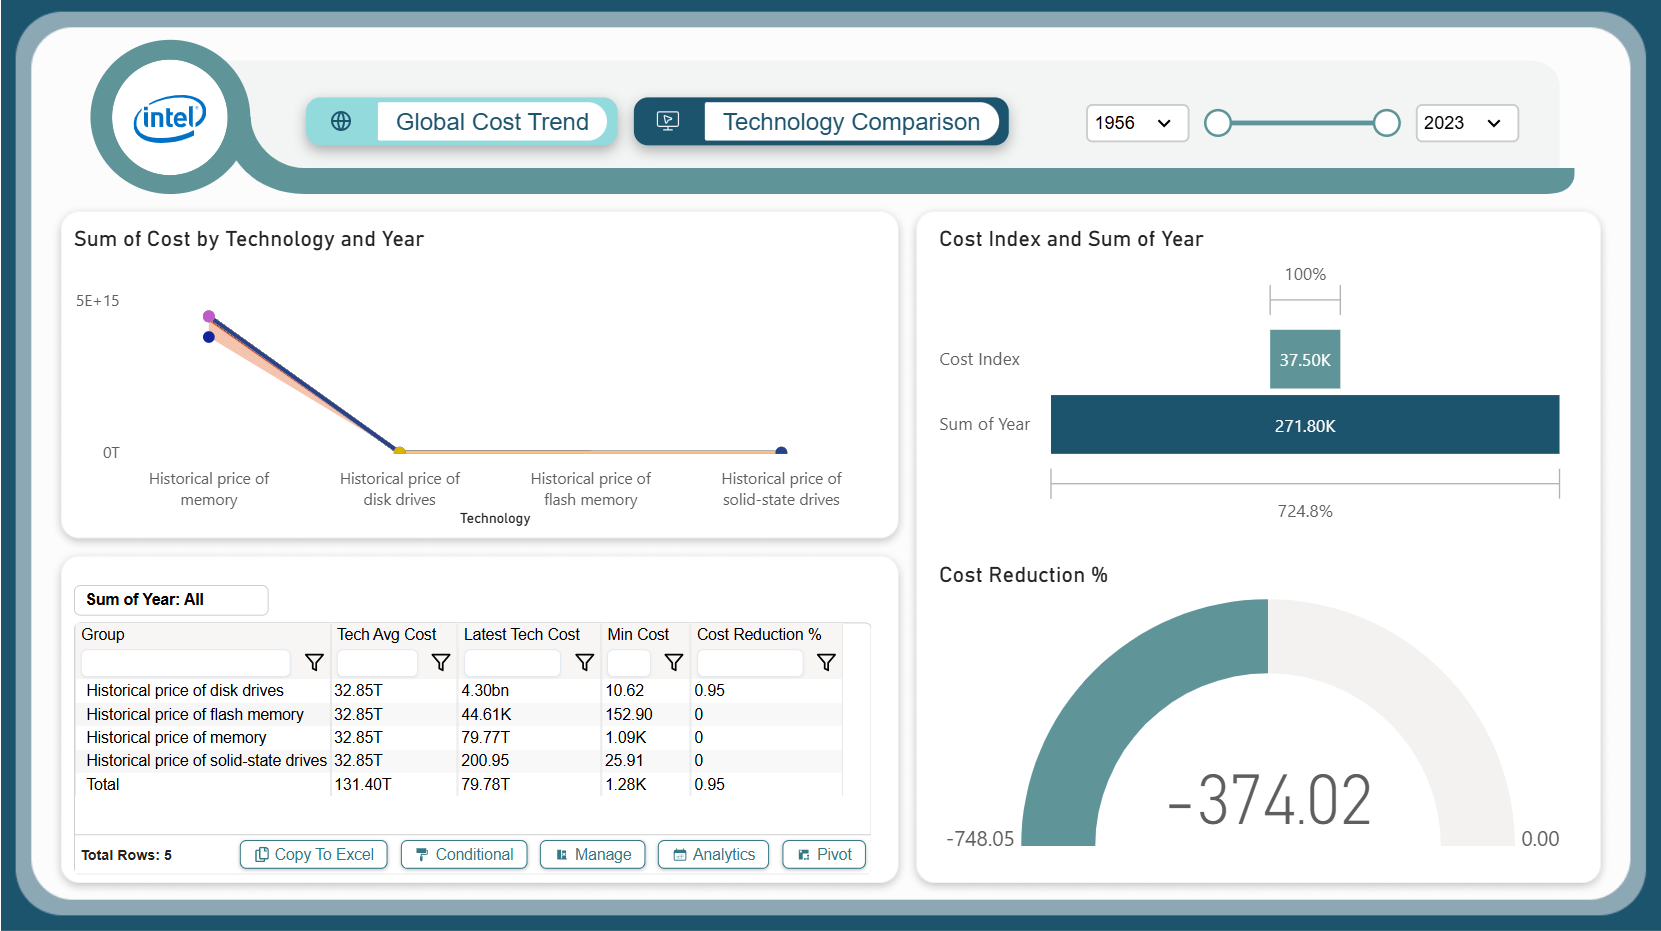
Intel Storage Cost Trends Dashboard – Key Insights (1956–2023)
745
 $18Sales & Revenue
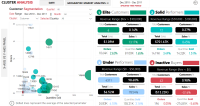
CRM Microsoft Power BI Dashboard Template
0
If you find this website helpful, share it with friends and colleagues to boost their Power BI skills and work efficiency!
Like this site? Share it