Power BI Spotify Music Analytics Dashboard Template (Free PBIX Download)
Introduction
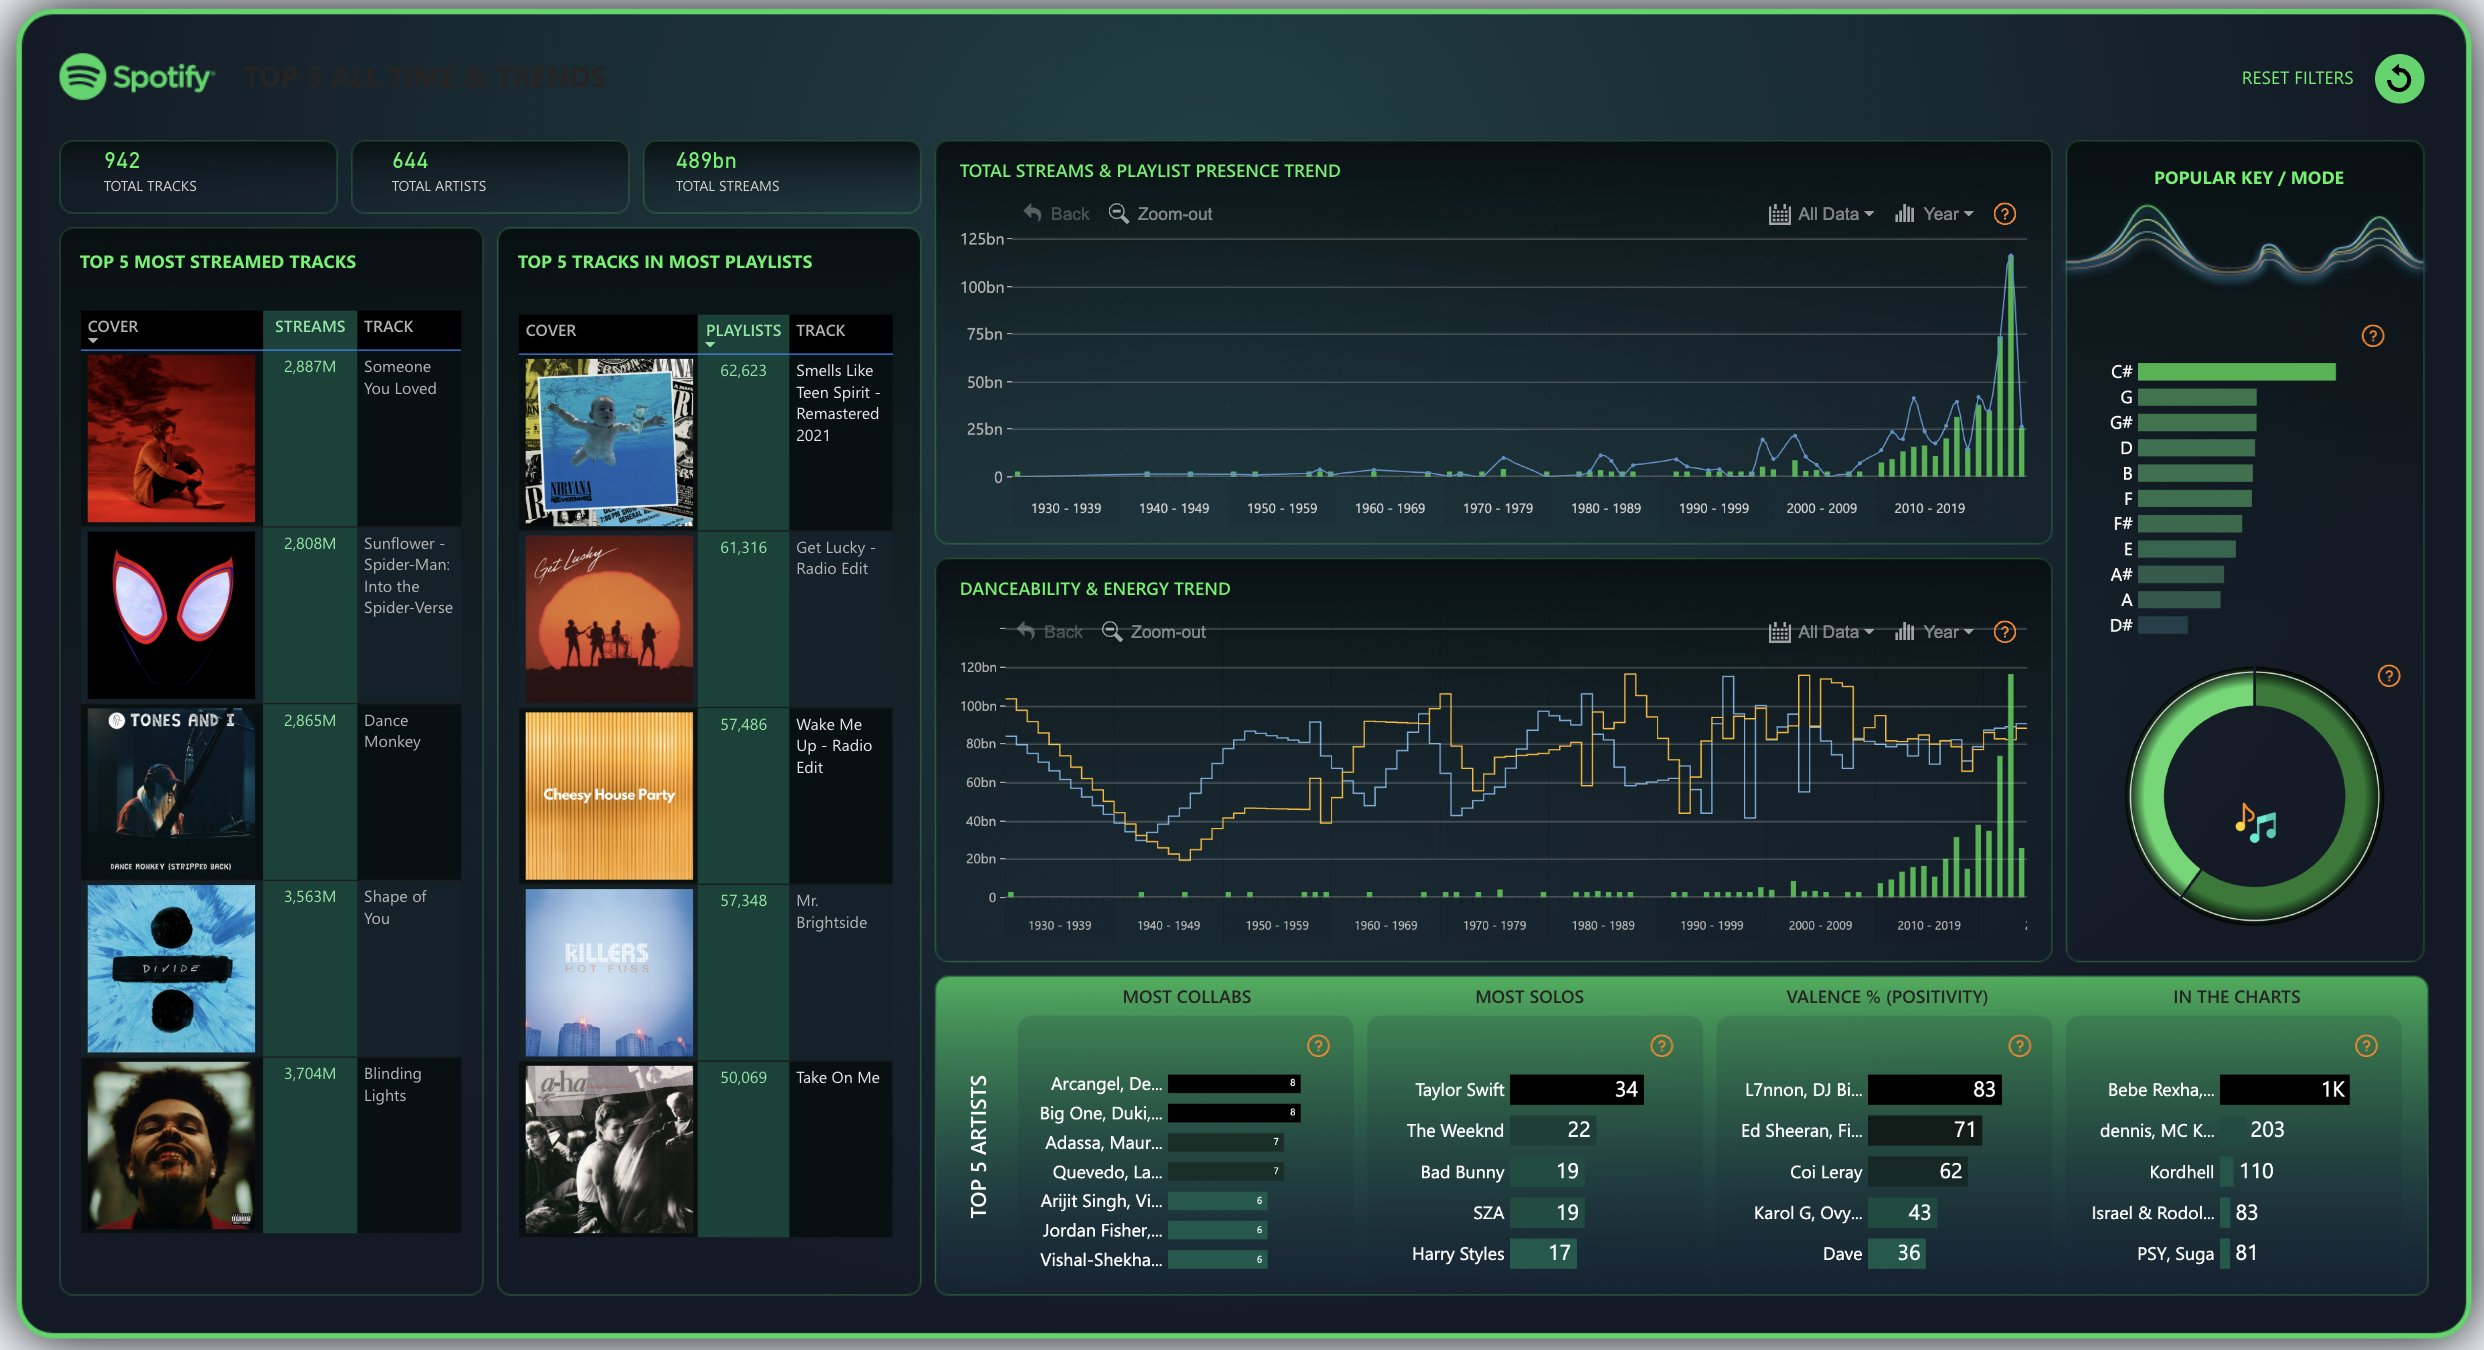
This dashboard delivers a century-spanning view of music performance on Spotify — from 1930s catalog tracks through to 2019 releases — combining stream volume, playlist penetration, audio feature trends (danceability, energy), and artist collaboration patterns into one analytical surface. It serves Music Industry Analysts, Label A&R teams, and Streaming Platform Strategists who need to understand not just what streams well today, but what structural audio and behavioral patterns predict long-term playlist dominance. The dual-lens of solo vs collaboration performance and positivity scoring adds competitive intelligence depth rarely found in standard streaming reports.
What's Inside This Template
KPI Banner — Catalog Overview
| MetricValue | |
| Total Tracks | 942 |
| Total Artists | 644 |
| Total Streams | 489 billion |
489 billion streams across 942 tracks yields an average of 519 million streams per track — an extraordinarily high per-track average confirming this dataset covers only charting or catalog-significant tracks, not the full Spotify library.
Top 5 Most Streamed Tracks
| TrackArtistStreams | ||
| Someone You Loved | Lewis Capaldi | 2,887M |
| Sunflower – Spider-Man | Post Malone / Swae Lee | 2,808M |
| Dance Monkey | Tones and I | 2,865M |
| Shape of You | Ed Sheeran | 3,563M |
| Blinding Lights | The Weeknd | 3,704M |
The Weeknd's Blinding Lights leads at 3,704M — 28% more streams than Someone You Loved (2,887M) in 5th place. Shape of You (3,563M) holds second despite being a 2017 release, confirming Ed Sheeran's catalog has exceptional longevity on the platform.
Top 5 Tracks in Most Playlists
| TrackPlaylistsArtist | ||
| Smells Like Teen Spirit – Remastered 2021 | 62,623 | Nirvana |
| Get Lucky – Radio Edit | 61,316 | Daft Punk |
| Wake Me Up – Radio Edit | 57,486 | Avicii |
| Mr. Brightside | 57,348 | The Killers |
| Take On Me | 50,069 | a-ha |
Zero overlap between the top 5 streamed tracks and the top 5 playlist tracks — this is the single most analytically significant finding in the dashboard. Playlist curators systematically favor legacy/classic tracks (Nirvana, Daft Punk, The Killers) while stream counts are dominated by recent pop. Smells Like Teen Spirit leads playlist presence at 62,623 — likely due to being added to thousands of "classic rock," "workout," "throwback," and "mood" playlists over decades.
Line Chart — Total Streams & Playlist Presence Trend (1930–2019)
Stream volume (green bars) remains near-zero until the late 1990s, then explodes post-2010 with a massive peak in 2010–2019. The playlist presence line (blue) shows broader historical spread — confirming that older tracks accumulate playlist adds over time even without generating comparable raw streams. The 2010–2019 decade dominates stream volume by an order of magnitude.
Danceability & Energy Trend (1930–2019)
| EraPattern | |
| 1930–1950 | Low danceability and energy baseline |
| 1950–1970 | Moderate rise with high variance |
| 1970–1990 | Peak energy era — disco, rock, pop |
| 1990–2010 | Dip in energy metrics (grunge, alternative dominance) |
| 2010–2019 | Recovery and surge in danceability (EDM, pop, Latin) |
The danceability and energy lines track closely through most decades but diverge notably in the 1990s — energy dropped sharply (grunge/alternative) while danceability held relatively higher (dance-pop, R&B). The 2010–2019 surge in both metrics confirms the EDM and Latin pop era driving Spotify's highest-engagement content.
Popular Key / Mode (Bar + Donut)
C# leads all keys by a visible margin, followed by G, G#, D, and B. The donut visual (bottom right) appears to show mode distribution (major vs minor). C# major/minor dominance in streaming hits is consistent with music production research showing it sits in a comfortable vocal range for most pop artists and translates well across streaming compression algorithms.
Bottom Panel — Artist Intelligence
Most Collabs (Top 5 Artists by Collaboration Count):
| ArtistCollabs | |
| Arcangel, De... | 8 |
| Big One, Duki... | 8 |
| Adassa, Maur... | 7 |
| Quevedo, La... | 7 |
| Arijit Singh, Vi... | 6 |
| Jordan Fisher,... | 6 |
| Vishal-Shekha... | 6 |
Latin and Bollywood artists dominate the collaboration chart — Arcangel and Duki (Latin trap/reggaeton), Arijit Singh and Vishal-Shekhar (Bollywood). This reflects the global diversification of Spotify's catalog strategy beyond Anglo-American pop.
Most Solos (Top 5 Artists by Solo Track Count):
| ArtistSolo Tracks | |
| Taylor Swift | 34 |
| The Weeknd | 22 |
| Bad Bunny | 19 |
| SZA | 19 |
| Harry Styles | 17 |
Taylor Swift leads solo track count at 34 — nearly 55% more than The Weeknd (22) in second place. This reflects both catalog depth and Spotify presence strategy.
Valence % (Positivity Score):
| ArtistValence % | |
| L7nnon, DJ Bi... | 83% |
| Ed Sheeran, Fi... | 71% |
| Coi Leray | 62% |
| Karol G, Ovy... | 43% |
| Dave | 36% |
Valence measures emotional positivity in audio features. L7nnon (Brazilian funk) leads at 83% — the happiest-sounding catalog. Dave (UK rap) at 36% is the most sonically melancholic. Ed Sheeran at 71% confirms his commercial formula is rooted in high-positivity audio regardless of lyrical content.
In The Charts:
| ArtistChart Appearances | |
| Bebe Rexha,... | 1K |
| dennis, MC K... | 203 |
| Kordhell | 110 |
| Israel & Rodol... | 83 |
| PSY, Suga | 81 |
Bebe Rexha dominates chart appearances at 1K — an order of magnitude above the second-ranked artist (203), suggesting either a data anomaly or that her collaborations across multiple artists' charts are being aggregated into a single count.
Key Insights
- Zero overlap between top-streamed and top-playlisted tracks exposes two completely separate success mechanisms on Spotify. Blinding Lights (3,704M streams) does not appear in the top playlist tracks; Smells Like Teen Spirit (62,623 playlists) does not appear in the top stream counts. Playlist success is driven by cultural ubiquity and editorial curation over decades — stream success is driven by current release momentum. Artists and labels optimizing for only one metric are leaving the other entirely unaddressed.
- Nirvana's Smells Like Teen Spirit at 62,623 playlists — released in 1991 — outperforms every 2010s pop track in playlist penetration. This is compounding catalog equity: each year the track gets added to more "classic," "throwback," and "workout" playlists, generating passive discovery that modern releases cannot replicate. The remastered 2021 version accelerated this by resetting the "new release" algorithm trigger.
- Taylor Swift's 34 solo tracks — 55% more than The Weeknd's 22 — combined with her absence from the collaboration chart — reflects a deliberate solo-catalog strategy. In contrast, Latin artists (Arcangel, Duki, Bad Bunny) lead collaboration counts, reflecting a genre culture where features are the primary release vehicle. Both strategies reach the top tier, but through structurally opposite mechanisms.
- The 1990s energy dip in the Danceability & Energy Trend is the clearest genre-shift signal in the dataset. Grunge and alternative rock drove energy scores down while mainstream R&B held danceability relatively stable — creating a decade where the two metrics diverged most. The post-2010 convergence upward marks EDM and Latin pop's dominance restoring alignment between the two audio features.
- C# dominance across popular keys is a production insight, not a coincidence. C# sits at a pitch that allows most vocalists to perform in their most resonant chest-voice range, and it is the default tuning reference for many DAW templates. Tracks produced in C# tend to have more natural-sounding vocal delivery — which correlates with higher listener engagement and lower skip rates on streaming platforms.
- Bebe Rexha's 1K chart appearances — 5× the second-ranked artist — is either the most remarkable cross-genre collaboration strategy in the dataset or a counting artifact from how featured-artist credits are attributed across multiple chart entries. Either way, it warrants investigation: if real, it represents the most chart-diversified artist in the catalog by a wide margin.
Who This Template Is For
- Music Label A&R and Strategy teams who need to analyze which audio features (danceability, energy, key, valence) correlate with playlist placement and streaming longevity — to inform artist development decisions and production briefs for new releases.
- Streaming Platform Analysts and Music Data Scientists who want a ready-to-use Power BI template connectable to Spotify Web API exports or Chartmetric data, with pre-built century-spanning trend lines, collaboration network metrics, and audio feature scoring already structured for immediate use.
- Music Marketing and Playlist Pitching teams who need to understand the structural gap between stream-optimized and playlist-optimized tracks — and use the top playlist presence data to benchmark their own releases against the most-curated catalog tracks on the platform.
How to Use
- Download the PBIX file from the Flexa Intel gallery.
- Open in Power BI Desktop (2023 or later for dark theme and visual compatibility).
- Connect your data source — typically a Spotify Web API export, a Kaggle Spotify dataset, or a Chartmetric/Soundcharts flat file with fields for track name, artist, release year, stream count, playlist count, audio features (danceability, energy, valence, key, mode), and chart appearance data.
- All visuals update automatically — KPI cards, top track tables with album art, playlist leaderboard, stream and danceability trend lines, key/mode distributions, and all four artist intelligence panels recalculate from your connected data.
This dashboard visualizes streaming trends and artist rankings beautifully but lacks a structured track-level performance table — no ranked view showing each track's stream count, playlist appearances, danceability score, valence, key, and chart entries side by side for sorting and filtering. Flexa Tables is a Microsoft-certified Power BI visual built for exactly this — multi-column music analytics reporting with conditional formatting by performance tier, sortable track rankings, and expandable artist-to-track hierarchies, making weekly A&R reviews and playlist pitch preparation significantly faster and more data-driven.
Other Templates
 Free Other / General
Adventure Works Report
 Free Other / General
The Movie DB Overview dashboard
 $18Sales & Revenue
CRM Microsoft Power BI Dashboard Template
If you find this website helpful, share it with friends and colleagues to boost their Power BI skills and work efficiency!
Like this site? Share it