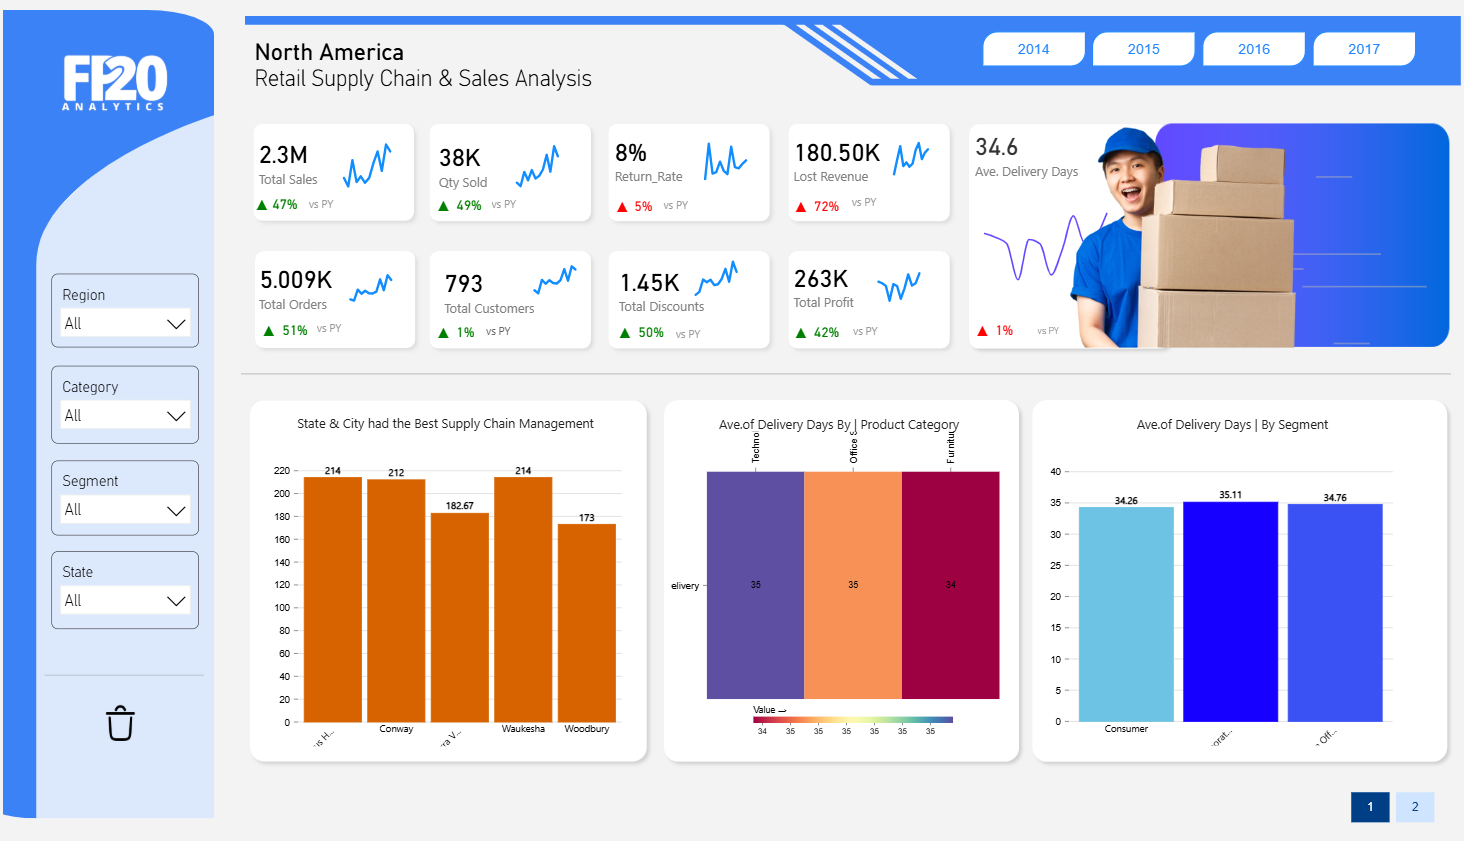
Retail Supply Chain & Sales Analysis dashboard
1365 Downloads
Description
The North America Retail Supply Chain & Sales Analysis dashboard provides the following insights for 2017:
- Total Sales: $2.3M, up 47% year-over-year (YoY).
- Qty Sold: 38K units, increased by 49% YoY.
- Return Rate: 8%, up 5% YoY.
- Lost Revenue: $180.5K, rose by 72% YoY.
- Ave. Delivery Days: 34.6 days, up 1% YoY.
- Total Orders: 5.009K, grew by 51% YoY.
- Total Customers: 793, up 1% YoY.
- Total Discounts: 1.45K, increased by 50% YoY.
- Total Profit: $263K, up 42% YoY.
- State & City with Best Supply Chain Management: Waukesha leads with 214, followed by Conway (214), Cra V (182), and Woodbury (173).
- Ave. of Delivery Days by Product Category: Consistent at 35-36 days across Technology, Office, and Furniture.
- Ave. of Delivery Days by Segment: Consumer segment averages 34.26 days, Corporate 35.11 days, and Other 34.76 days.
The dashboard is designed using Flexa Design, Flexa Tables, and Flexa Charts from Flexa Intel.
Other Templates
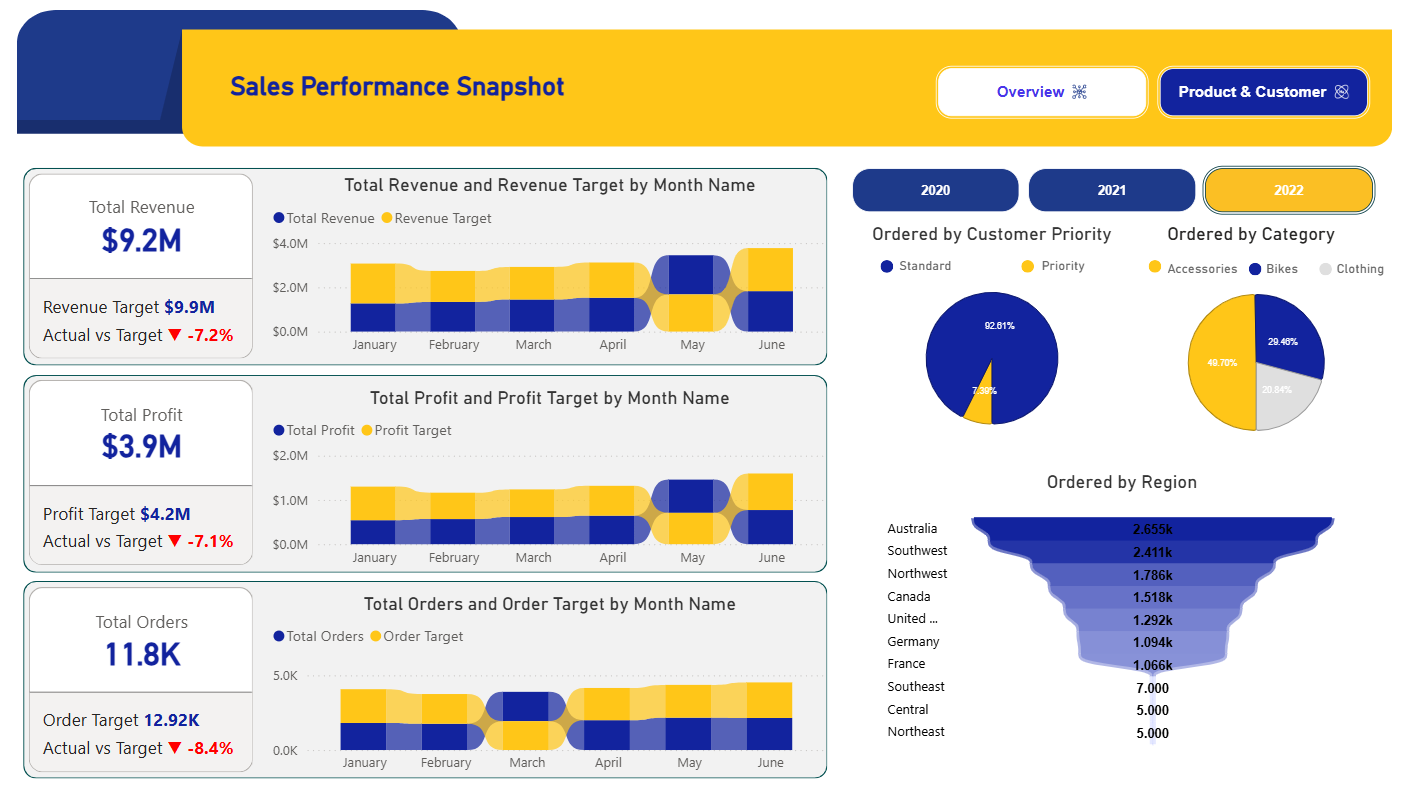 Free Sales & Revenue
Sales Performance Snapshot dashboard
1.3k
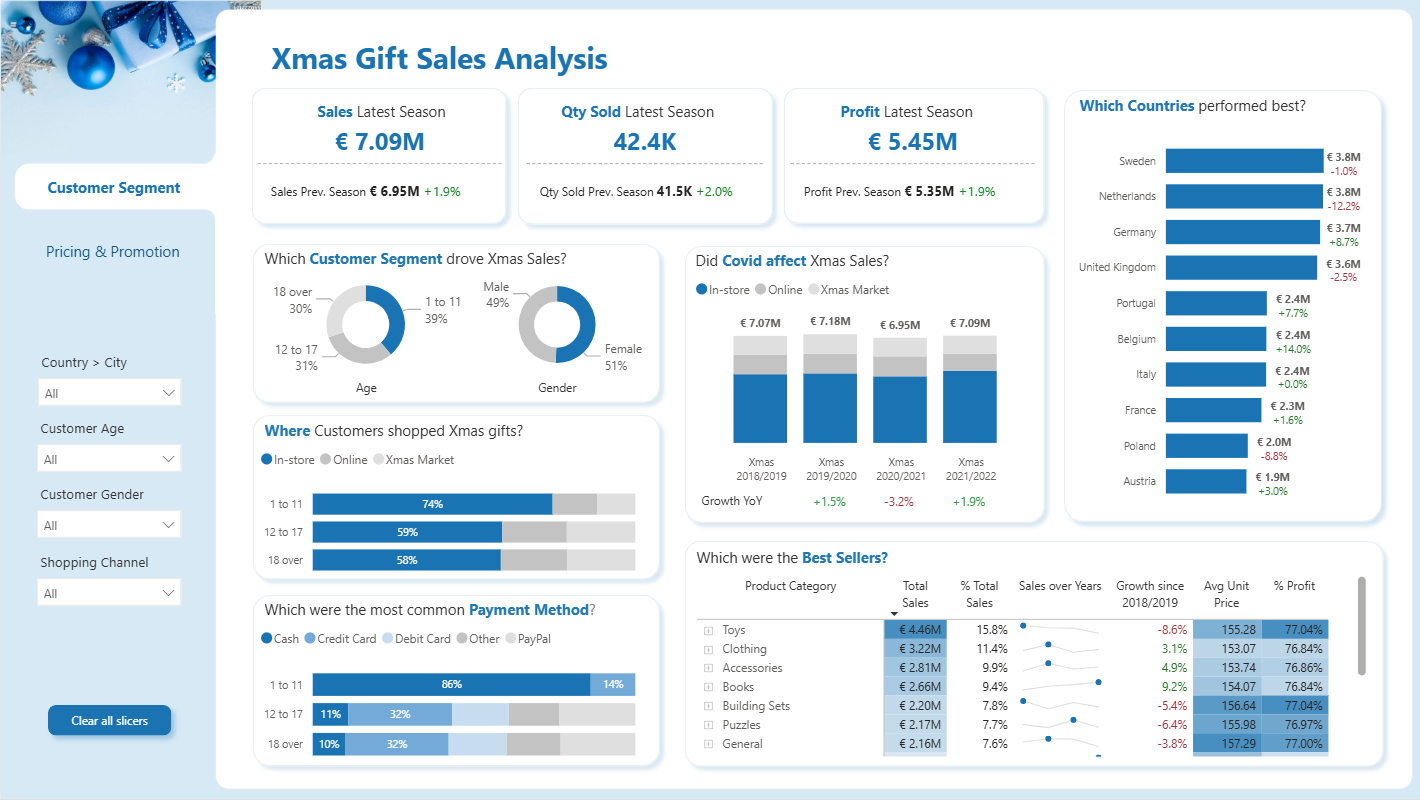 Free Sales & Revenue
Power BI Christmas Gift Sales Analysis Dashboard (Free PBIX Download)
152
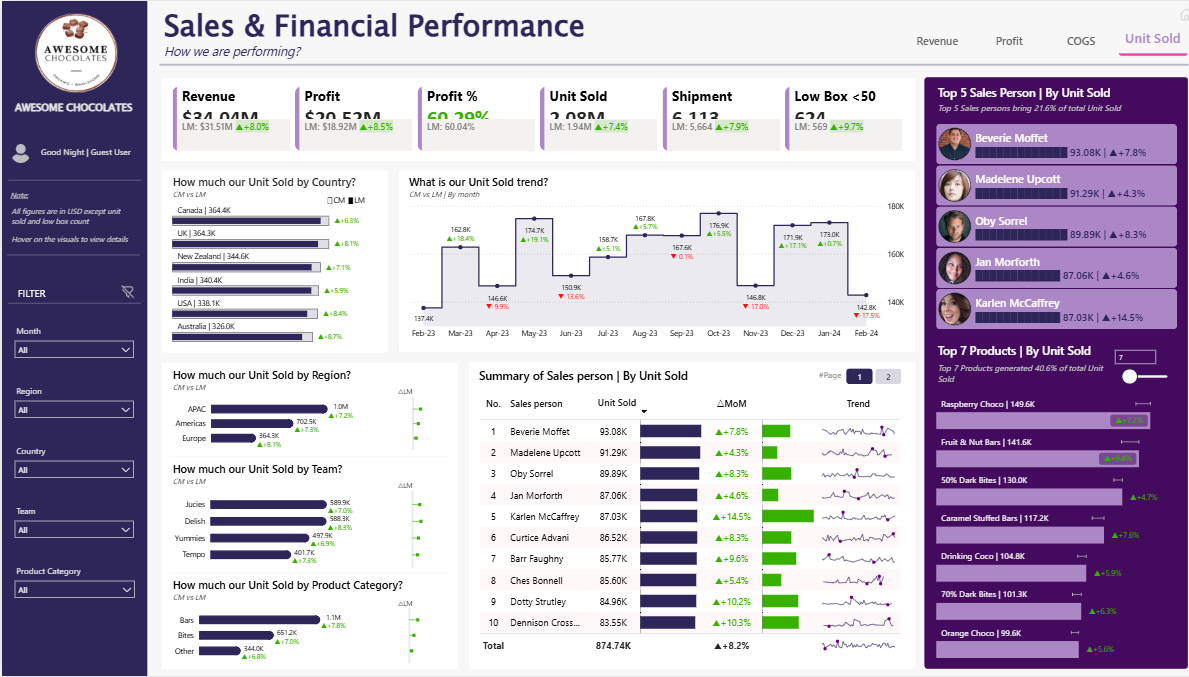 Free Sales & Revenue
Power BI Sales & Financial Performance Dashboard Template — FMCG Retail Analytics (Free PBIX Download)
100
If you find this website helpful, share it with friends and colleagues to boost their Power BI skills and work efficiency!
Like this site? Share it