Power BI North America Retail Supply Chain and Sales Analysis Dashboard Template (Free PBIX Download)
Introduction
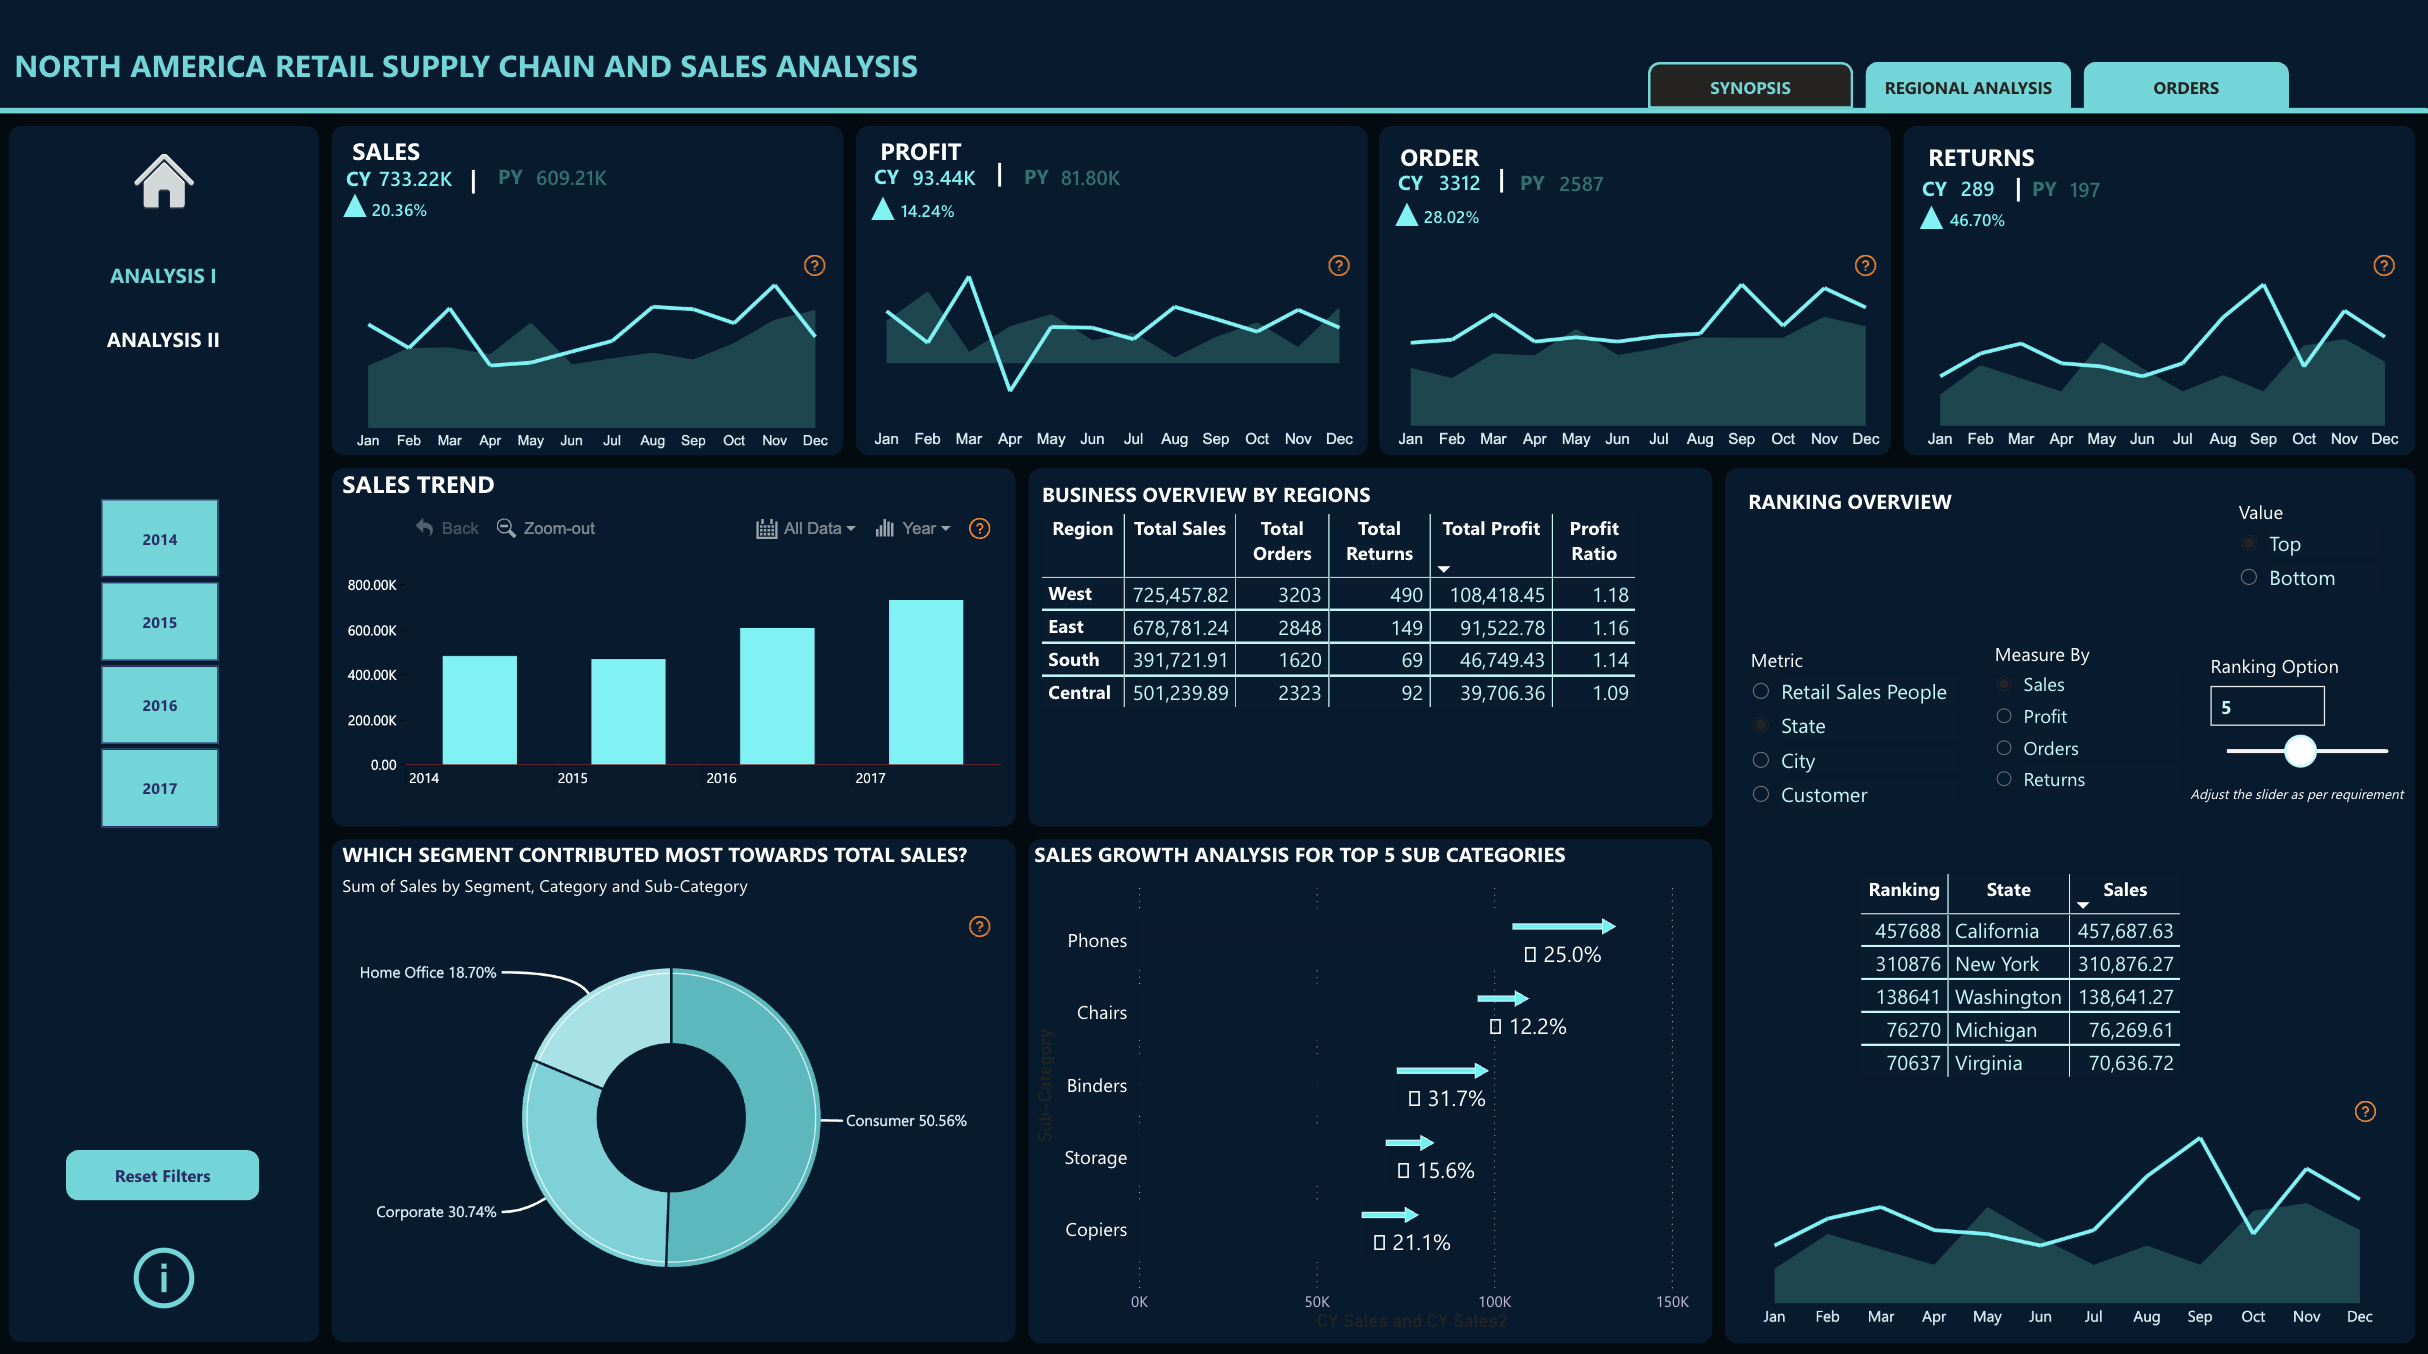
This Power BI dashboard delivers a full-spectrum retail supply chain and sales analysis for North America, covering revenue, profit, order volume, and returns across four regions, four customer segments, and five product sub-categories — with year-over-year trending from 2014 to 2017. It gives retail operations and supply chain managers a single view of where growth is happening, which regions are most profitable, and which product categories are driving or dragging performance. The multi-page structure (Synopsis, Regional Analysis, Orders) allows progressive drill-down from executive summary to operational detail.
What's Inside This Template
KPI Banner — Current Year vs Prior Year
| MetricCY ValuePY ValueYoY Change | |||
| Sales | $733.22K | $609.21K | ▲ 20.36% |
| Profit | $93.44K | $81.80K | ▲ 14.24% |
| Orders | 3,312 | 2,587 | ▲ 28.02% |
| Returns | 289 | 197 | ▲ 46.70% |
All four metrics grew YoY — but returns grew at 46.70%, more than twice the rate of sales (20.36%) and more than triple the rate of profit (14.24%). Revenue is scaling, but so is the cost of handling returned goods.
Each KPI card includes a sparkline showing the full Jan–Dec monthly trend for the current year, making seasonal patterns immediately visible without drilling into a separate chart.
Sales Trend (Bar Chart — 2014–2017)
| YearTotal Sales (Approx.) | |
| 2014 | ~$250K |
| 2015 | ~$350K |
| 2016 | ~$430K |
| 2017 | ~$630K |
Sales have grown consistently every year, with 2017 showing the steepest absolute jump — roughly 47% above 2016. Year buttons (2014–2017) on the left sidebar act as slicers to filter the entire dashboard to a single year. An "All Data" toggle is also available for full-period view.
Business Overview by Regions
| RegionTotal SalesTotal OrdersTotal ReturnsTotal ProfitProfit Ratio | |||||
| West | $725,457.82 | 3,203 | 490 | $108,418.45 | 1.18 |
| East | $678,781.24 | 2,848 | 149 | $91,522.78 | 1.16 |
| South | $391,721.91 | 1,620 | 69 | $46,749.43 | 1.14 |
| Central | $501,239.89 | 2,323 | 92 | $39,706.36 | 1.09 |
West leads in both sales and profit. Central is the critical anomaly: it ranks 3rd in sales ($501K) but dead last in profit ratio (1.09) and profit dollars ($39.7K) — generating less profit than South despite 43% more in sales volume. Central's cost structure or discount behavior demands investigation.
Which Segment Contributed Most Towards Total Sales? (Donut Chart)
| SegmentShare | |
| Consumer | 50.56% |
| Corporate | 30.74% |
| Home Office | 18.70% |
Consumer is the dominant segment at over half of total sales. Corporate is a meaningful second. Home Office is the smallest but likely highest-margin given its lower volume and typically lower return rate.
Sales Growth Analysis for Top 5 Sub-Categories (Bullet/Arrow Chart)
| Sub-CategorySales Growth | |
| Binders | 31.7% |
| Storage | 15.6% |
| Copiers | 21.1% |
| Chairs | 12.2% |
| Phones | 25.0% |
Binders lead growth at 31.7%, followed by Phones at 25.0% and Copiers at 21.1%. Chairs is the slowest-growing sub-category at 12.2% — still positive but lagging the cohort by nearly 20 percentage points.
Ranking Overview (Dynamic Table)
A configurable ranking panel allows users to select Metric (Retail Sales People, State, City, Customer), Measure By (Sales, Profit, Orders, Returns), and ranking direction (Top/Bottom) with a slider set to Top 5.
Current view shows Top 5 States by Sales:
| RankingStateSales | ||
| 457,688 | California | $457,687.63 |
| 310,876 | New York | $310,876.27 |
| 138,641 | Washington | $138,641.27 |
| 76,270 | Michigan | $76,269.61 |
| 70,637 | Virginia | $70,636.72 |
California dominates at $457K — 47% more than New York ($310K), which is itself more than double Washington ($138K). The top 2 states account for a disproportionate share of total sales, indicating heavy geographic concentration.
A sparkline beneath the ranking table shows the monthly sales trend for the selected ranking segment.
Multi-Page Navigation
Three tabs at the top — Synopsis, Regional Analysis, Orders — allow progressive drill-down. This page is Synopsis (executive overview). Regional Analysis and Orders pages offer deeper geographic and transaction-level detail.
Key Insights
Returns grew at 46.70% YoY — more than twice the sales growth rate of 20.36% — and this divergence is the single biggest margin risk in the dashboard. If returns continue scaling faster than sales, the net realized revenue growth is materially overstated. At 289 returns in CY vs. 197 in PY, each returned unit carries reverse logistics, restocking, and potential markdown costs that compress the already-thin 12.7% profit margin ($93K on $733K sales).
Central region generates $501K in sales but only $39.7K in profit — a profit ratio of 1.09 vs. West's 1.18, implying Central's cost-to-revenue structure is 8% worse than the top region. South, with $110K less in sales, generates $7K more in profit than Central. Something structural — discounting, freight costs, product mix, or returns — is eroding Central's margins. This is the highest-priority regional investigation in the dataset.
West region has 490 returns — 3x more than East (149) despite only 6% more in sales volume. West leads in both revenue ($725K) and profit ($108K), but its return rate is anomalously high. If West's returns were reduced to East's rate (~149), the profit impact at even a conservative $50 cost-per-return would save ~$17K — a 16% profit improvement from logistics discipline alone in one region.
Binders grew 31.7% — the fastest of any tracked sub-category — yet is not typically a high-ticket retail category. This signals either a volume explosion (more units, lower price) or a pricing action. Cross-referencing Binders against the Segment breakdown would reveal whether Corporate bulk buying is driving the spike. Either way, Binders' supply chain capacity should be stress-tested if this growth rate continues.
California alone accounts for $457K in sales — 62% of New York's total, and likely 30%+ of total national sales. Two states (California + New York = $768K combined) likely represent the majority of the entire business. This geographic concentration creates single-state revenue risk: any California-specific disruption (regulatory, economic, competitive) has outsized national impact.
Profit grew at only 14.24% against 20.36% sales growth — expenses or costs are scaling faster than revenue. The profit growth rate is 30% slower than the sales growth rate. In a healthy retail operation, profit should ideally grow at least as fast as sales (operating leverage). The gap here suggests rising COGS, freight, discount pressure, or return handling costs are consuming the incremental revenue dollar.
Who This Template Is For
- Retail Operations Directors and Supply Chain Managers who need a single dashboard to monitor sales volume, profit, orders, and returns across North American regions — with year-by-year trend data to assess whether the business is scaling efficiently or accumulating hidden cost pressure.
- Finance Analysts and CFOs in retail companies who need to quickly surface regional profit ratio disparities (like Central's 1.09 vs. West's 1.18) and YoY growth rate mismatches between sales and profit — without building a custom model from scratch.
- Category Managers and Merchandising Teams who need to track which sub-categories (Binders, Phones, Copiers, Chairs, Storage) are growing fastest and align inventory, supplier negotiations, and promotional investment accordingly.
How to Use
- Download the PBIX file from the Flexa Intel gallery.
- Open in Power BI Desktop (free from Microsoft — no premium license required).
- Connect your retail data source — compatible with SQL databases, SAP, Oracle Retail, Dynamics 365, or any ERP/POS system exportable to CSV/Excel. Map fields to: Region, State, City, Segment, Category, Sub-Category, Sales, Profit, Orders, Returns, Date.
- All visuals refresh automatically — KPI sparklines, regional table, sales trend, segment donut, sub-category growth chart, and dynamic ranking table all update from your connected data. Use year buttons and the Reset Filters button to slice across time periods instantly.
The Business Overview by Regions table shows Sales, Orders, Returns, Profit, and Profit Ratio — but want to extend it with drill-down rows by state or city within each region, conditional formatting that flags Central's underperforming profit ratio in red, and a variance column showing YoY change for every metric in one scrollable grid? Flexa Tables is a Microsoft-certified Power BI visual built for exactly this kind of hierarchical retail performance tabulation — with expandable region → state → city breakdowns, multi-metric columns, and color-coded thresholds that turn a flat summary table into a full operational management view.
Other Templates
 Free Sales & Revenue
Power BI Shark Tank Analytics Dashboard Template (Free PBIX Download)
 Free Supply Chain & Logistics
IBERDROLA Distribution of Renewable Energy Generation Dashboard – Key Insights (2005–2024)
 Free Sales & Revenue
Power BI Amazon Sales Dashboard — India E-Commerce Analytics (Free PBIX Download)
If you find this website helpful, share it with friends and colleagues to boost their Power BI skills and work efficiency!
Like this site? Share it