Power BI Executive Overview Dashboard Template (Free PBIX Download)
Introduction
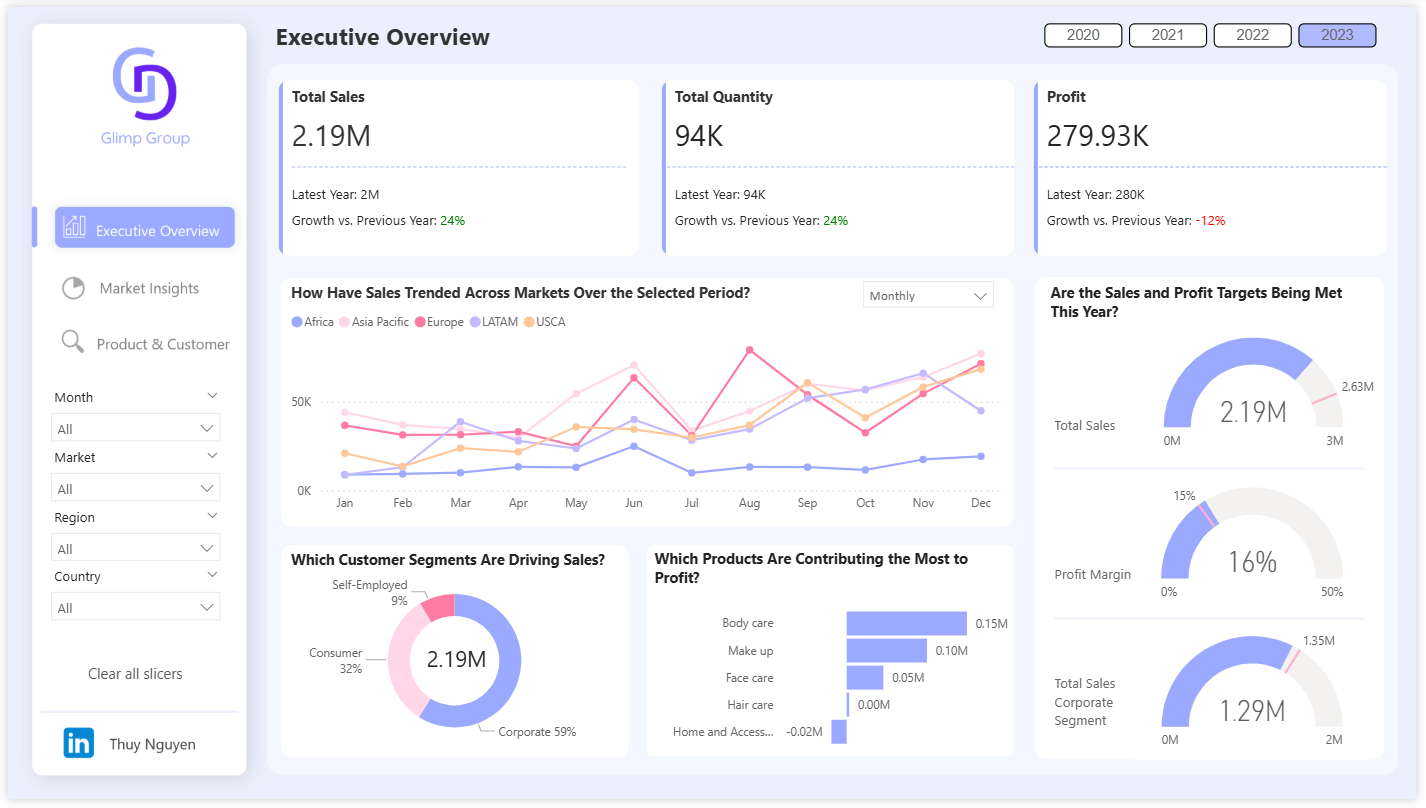
This free Power BI Executive Overview dashboard template gives leadership teams a complete picture of business performance at a glance — covering total sales, profit, quantity, regional market trends, customer segments, and product-level profit contribution. Built for multi-market, multi-year reporting across 5 global regions, it enables executives to monitor targets, diagnose profit gaps, and spot growth opportunities without opening a single spreadsheet.
What's Inside This Template
1. Top-Line KPI Cards
Three headline metrics anchor the dashboard with current-year vs. prior-year growth signals:
| KPIValueYoY Growth | ||
| Total Sales | 2.19M | +24% ✅ |
| Total Quantity | 94K | +24% ✅ |
| Profit | 279.93K | -12% ⚠️ |
The divergence between Sales (+24%) and Profit (-12%) is the most critical signal on the page — revenue is accelerating but profit is declining, which immediately raises a cost structure or pricing question for the executive reading this report.
2. Sales Trend Across Markets (Monthly Line Chart)
A multi-line monthly trend chart tracks sales performance across 5 global markets:
- Africa · Asia Pacific · Europe · LATAM · USCA
Key observations visible in the chart:
- Asia Pacific (pink) is consistently the top-performing market and shows a strong peak around July–August before a December dip
- Europe (red) is the second-highest market with similar seasonality
- Africa (blue) is the lowest-performing region but shows a flat, stable trend — low contribution but low volatility
- LATAM and USCA are mid-tier and cluster closely together throughout the year
- The July–August spike across most markets suggests a strong seasonal demand period — likely a mid-year promotion or seasonal buying cycle
3. Customer Segments Driving Sales (Donut Chart)
Total Sales of 2.19M is distributed across three customer segments:
| SegmentShare | |
| Corporate | 59% |
| Consumer | 32% |
| Self-Employed | 9% |
Corporate accounts generate more than half of all revenue, making B2B retention and account management a top strategic priority. Consumer segment at 32% represents a meaningful secondary channel, while Self-Employed at 9% is the smallest — possibly an underserved growth opportunity or a deliberately narrow segment.
4. Products Contributing Most to Profit (Bar Chart)
Product-level profit contribution reveals which categories drive and drag the bottom line:
| Product CategoryProfit Contribution | |
| Body care | +0.15M ✅ Highest |
| Make up | +0.10M ✅ |
| Face care | +0.05M ✅ |
| Hair care | ~0.00M ⚠️ Break-even |
| Home & Accessories | -0.02M ❌ Loss-making |
Body care is the clear profit engine. Home & Accessories is the only category destroying value — a product line review or pricing adjustment is warranted. Hair care at near-zero margin is a watch item.
5. Sales & Profit Target Gauges (Right Panel)
Three gauge charts benchmark actual performance against annual targets:
| MetricActualTargetAttainment | |||
| Total Sales | 2.19M | 2.63M | 83% — behind target |
| Profit Margin | 16% | 50% | 32% — significantly below target |
| Sales (Corporate Segment) | 1.29M | 1.35M | 96% — nearly on track |
The Profit Margin gap (16% actual vs 50% target) is the most alarming figure on the dashboard. This is not a minor variance — it suggests either the target was set aggressively, or there has been a meaningful deterioration in cost structure or product mix in 2023.
Key Insights From the Data
- Revenue–Profit Divergence is the #1 Flag: Sales grew 24% but profit fell 12%. This means cost of goods or operating expenses grew faster than revenue in 2023 — something the executive team needs to investigate at the product or market level.
- Home & Accessories is destroying value: It's the only product category with negative profit contribution (-0.02M). Even if it drives volume, the margin drag needs to be addressed — reprice, reduce SKUs, or exit.
- Corporate segment is nearly on target (96%) while total sales is at 83%: This means the gap to total sales target is being driven by the Consumer and Self-Employed segments underperforming — not the core B2B business.
- Profit Margin at 16% vs 50% target is a structural problem, not a rounding error: A 34-point gap this late in the year (viewing 2023 full year) indicates the margin target was either unrealistic or a significant cost event occurred mid-year.
- Asia Pacific seasonality = a planning opportunity: The consistent July–August peak in Asia Pacific sales suggests a predictable demand window. Planning promotions and inventory ahead of this window could amplify the peak further.
- Africa is stable but underdeveloped: Flat across all 12 months with the lowest absolute sales — but consistency can be an asset. A targeted growth push in Africa could yield incremental upside with lower volatility risk than mature markets.
Dashboard Navigation
This template includes 3 report pages:
| PageFocus | |
| Executive Overview | Top-line KPIs, market trends, segment & product summary |
| Market Insights | Deep-dive by region, market, and country |
| Product & Customer | SKU-level and customer-level analysis |
Slicers available: Month · Market · Region · Country — all cross-filter every visual simultaneously.
Who This Template Is For
| RoleUse Case | |
| Sales Directors & CSOs | Monitor revenue vs. target across regions and segments in real time |
| CFOs & Finance Teams | Diagnose the revenue–profit gap and identify margin leakage by product |
| BI Developers | Use as a production-ready template — connect your own data and deploy in hours |
| Business Analysts | Replace static Excel summary reports with an interactive executive view |
How to Use This Template
- Download the PBIX file
- Open in Power BI Desktop
- Connect your own data source (Excel, SQL Server, SharePoint, or any supported connector)
- KPI cards, trend lines, gauges, and segment charts all update automatically
- Publish to Power BI Service for stakeholder sharing
Upgrade Your Executive Reporting
Want to add dynamic variance tables, conditional row formatting, and drill-through financial summaries to this dashboard? Explore Flexa Tables — a Microsoft-certified Power BI visual built for executive and financial reporting.
Other Templates
 Free Operations & Production
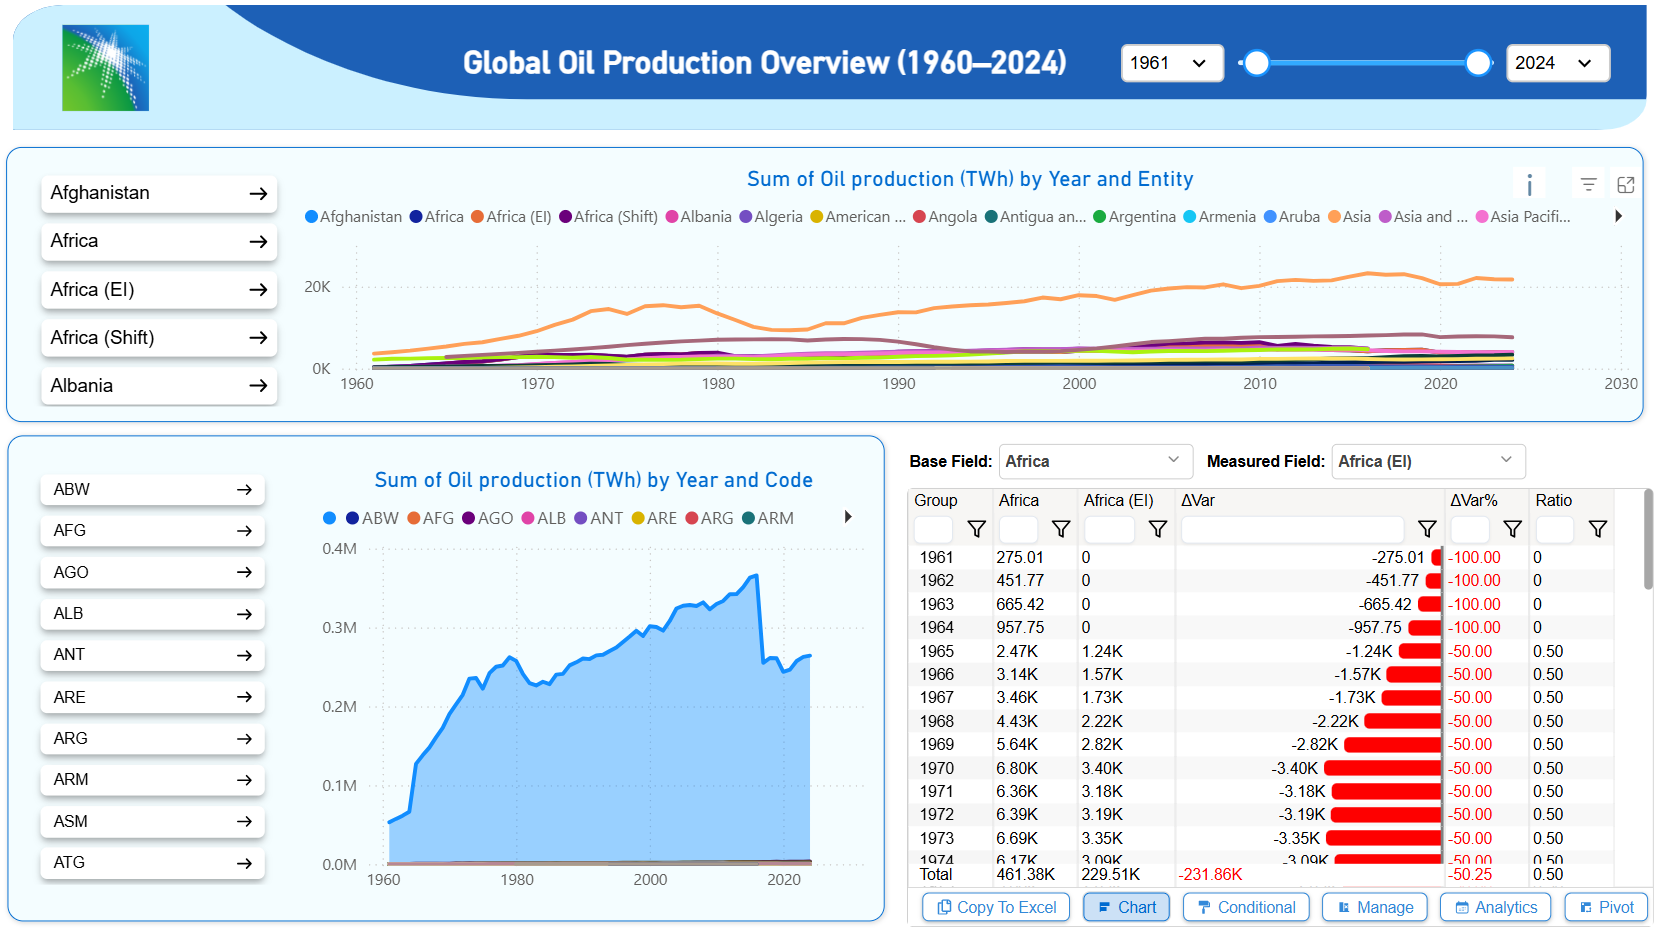
Executive Summary: Global Oil Production Analysis (1960–2024)
 Free Sales & Revenue
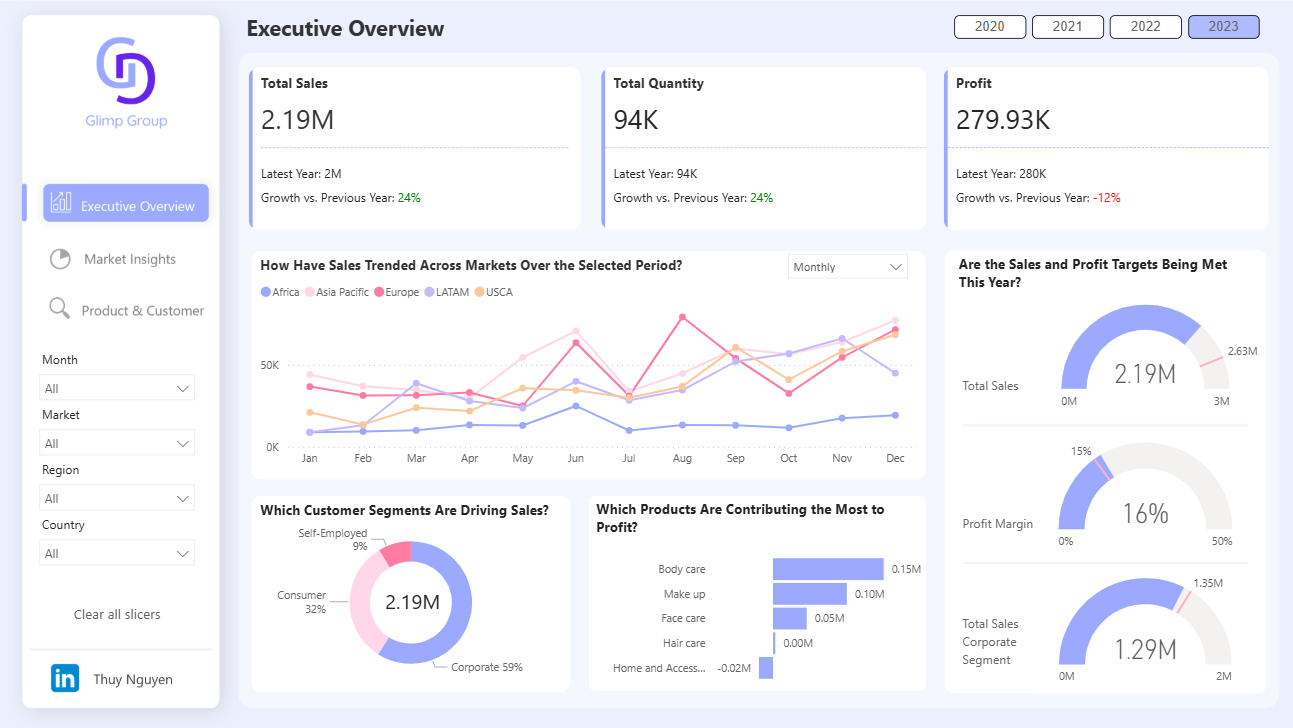
Power BI Executive Overview Dashboard Template — Global Sales & Profit Target Tracking (Free PBIX Download)
 Free Finance & Accounting
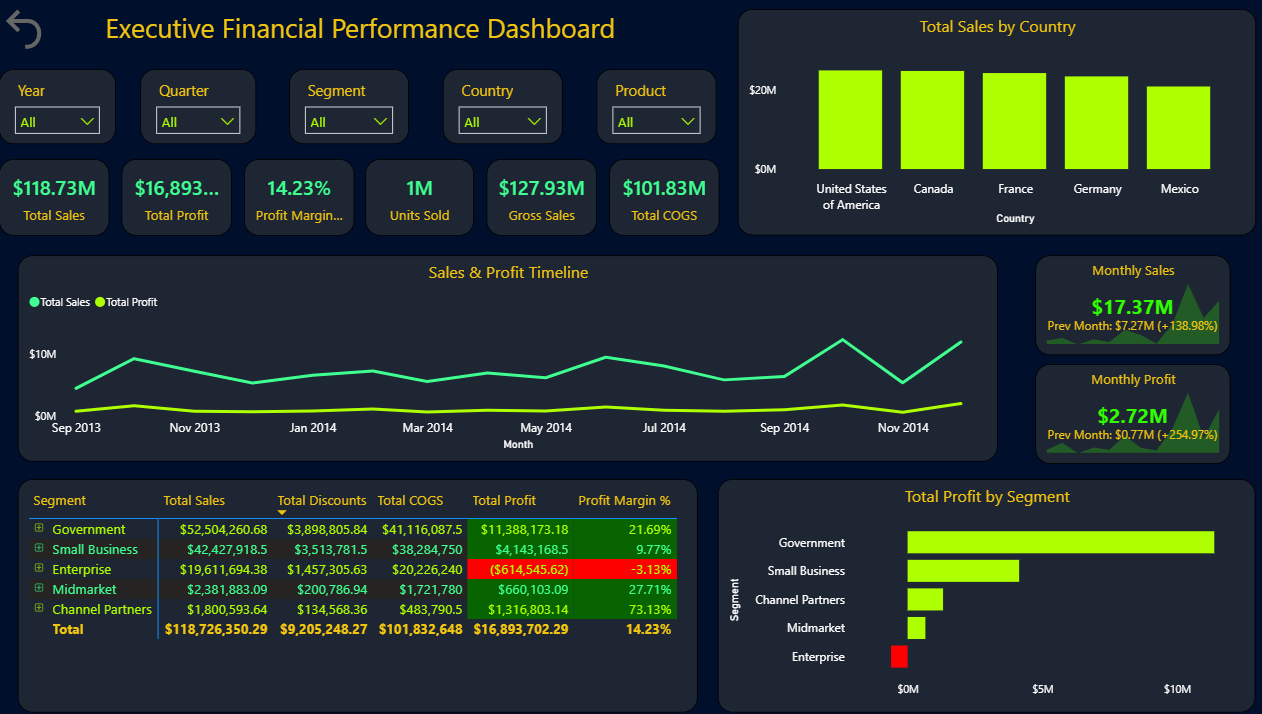
Power BI Executive Financial Performance Dashboard Template (Free PBIX Download)
If you find this website helpful, share it with friends and colleagues to boost their Power BI skills and work efficiency!
Like this site? Share it