Power BI Udemy Course Analytics Dashboard Template (Free PBIX Download)
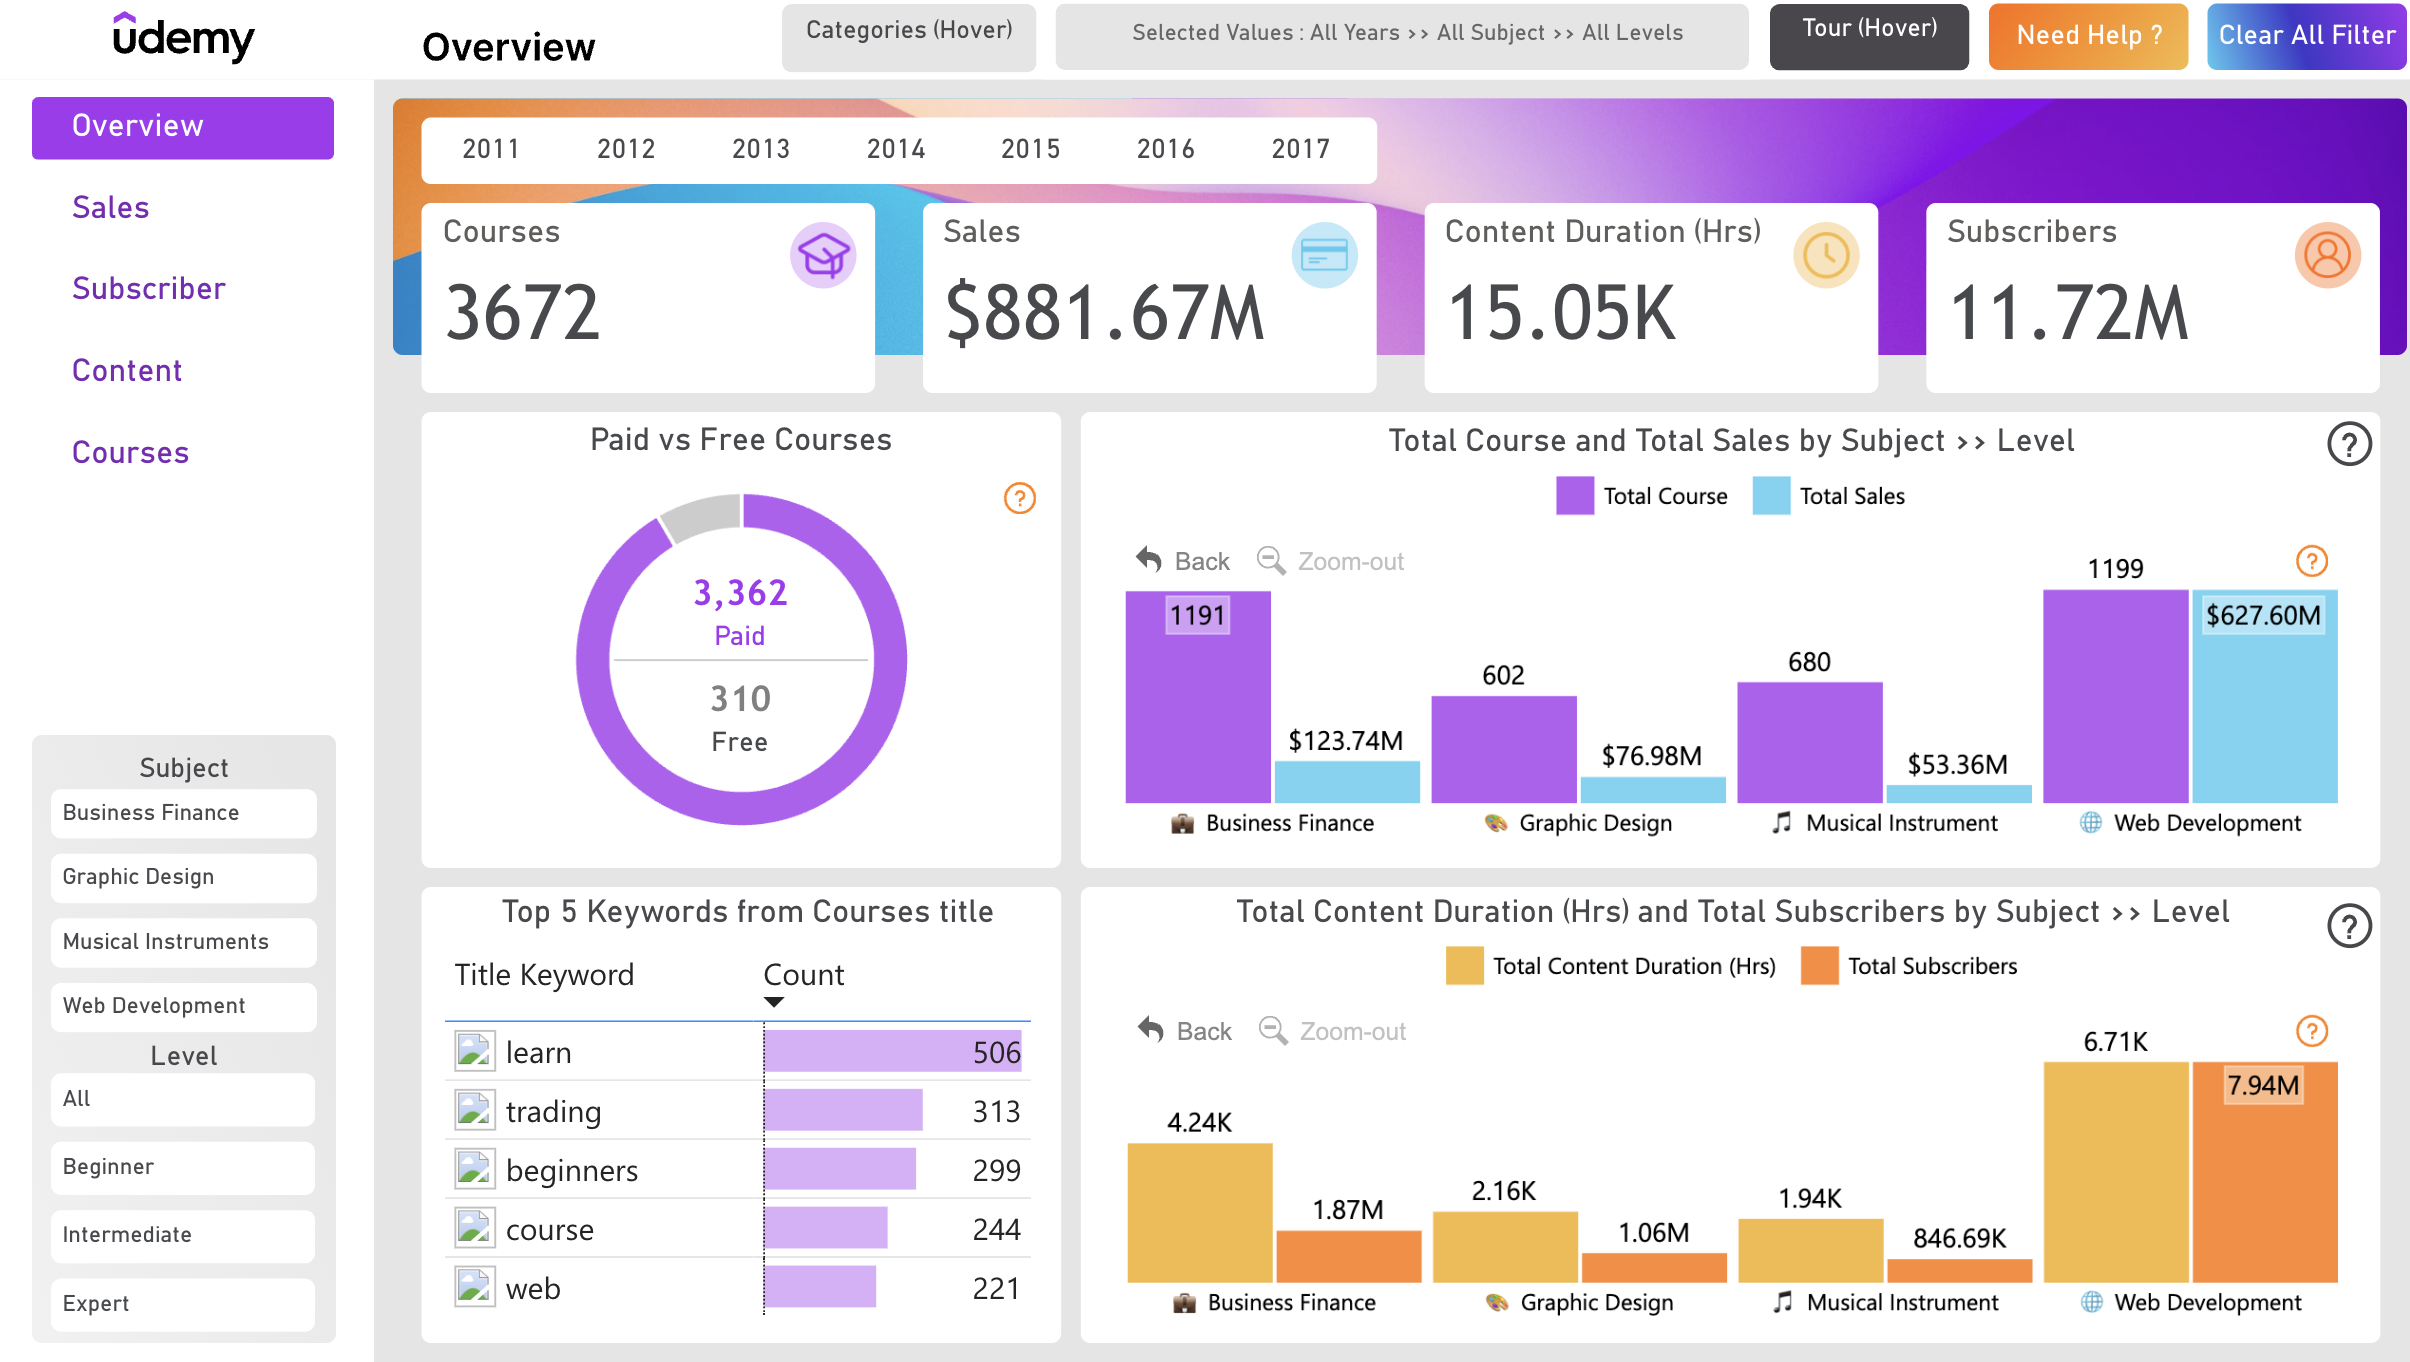
Introduction: This Power BI dashboard analyzes Udemy's course marketplace across 3,672 courses, $881.67M in total sales, and 11.72M subscribers spanning 2011 to 2017. It covers four subject categories — Business Finance, Graphic Design, Musical Instruments, and Web Development — with drill-down by course level (Beginner, Intermediate, Expert). The dashboard is structured across five tabs (Overview, Sales, Subscriber, Content, Courses), making it a comprehensive reference for edtech analysts, online course creators, and BI developers working with subscription or marketplace datasets.
What's Inside This Template
Top KPI Banner
| MetricValue | |
| Total Courses | 3,672 |
| Total Sales | $881.67M |
| Content Duration | 15.05K hours |
| Total Subscribers | 11.72M |
The ratio of $881.67M revenue across 11.72M subscribers yields an average revenue per subscriber of approximately $75.2 — a meaningful figure for a platform where individual course prices range from $10 to $200+. The 15.05K hours of total content across 3,672 courses averages 4.1 hours per course — consistent with Udemy's characteristic short-to-medium format courses rather than deep university-style curricula.
Paid vs Free Courses
- Paid: 3,362 (91.6%)
- Free: 310 (8.4%)
The 91.6% paid ratio confirms Udemy operates primarily as a paid marketplace, not a freemium funnel. The 310 free courses likely serve as lead-generation tools — instructors offering free introductory courses to build subscriber bases before upselling paid content. The near-absence of free courses (8.4%) also means the $881.67M revenue figure is almost entirely transactional, not advertising-driven.
Total Course and Total Sales by Subject
| SubjectCoursesSales | ||
| Web Development | 1,199 | $627.60M |
| Business Finance | 1,191 | $123.74M |
| Graphic Design | 602 | $76.98M |
| Musical Instruments | 680 | $53.36M |
This is the most revealing chart in the dashboard. Two critical asymmetries emerge:
Web Development dominates revenue disproportionately to course count. Web Development has 1,199 courses (32.6% of total) but generates $627.60M (71.2% of total revenue). Business Finance has nearly identical course count (1,191) but generates only $123.74M — one-fifth of Web Development revenue. This means the average Web Development course generates approximately $523K in sales versus $103K for Business Finance — a 5x revenue gap between categories with equivalent course volumes.
Musical Instruments is the most inefficient category by revenue per course. 680 courses generating $53.36M = $78.5K average per course — the lowest of all four categories, and less than half of Web Development's per-course revenue. The category has significant content investment (1.94K hours of content, second highest) but converts that investment into revenue poorly relative to peers.
Graphic Design punches below its weight. Only 602 courses (fewest by far) generating $76.98M — $127.9K average per course, making it more efficient than Business Finance on a per-course basis despite having 50% fewer courses.
Total Content Duration and Total Subscribers by Subject
| SubjectContent HoursSubscribers | ||
| Web Development | 6.71K hrs | 7.94M |
| Business Finance | 4.24K hrs | 1.87M |
| Graphic Design | 2.16K hrs | 1.06M |
| Musical Instruments | 1.94K hrs | 846.69K |
Web Development's subscriber dominance is even more extreme than its revenue dominance. 7.94M subscribers = 67.7% of all platform subscribers, despite being one of four categories. This confirms Web Development is not just the highest-revenue category — it is the primary reason people come to Udemy. The platform's identity is essentially "a place to learn web development" for the majority of its user base.
The content hours vs subscriber ratio reveals depth differences across categories:
- Web Development: 6.71K hrs for 7.94M subscribers = 1,183 subscribers per hour of content
- Business Finance: 4.24K hrs for 1.87M subscribers = 441 subscribers per hour
- Graphic Design: 2.16K hrs for 1.06M subscribers = 491 subscribers per hour
- Musical Instruments: 1.94K hrs for 846.69K subscribers = 436 subscribers per hour
Web Development attracts 2.7x more subscribers per hour of content than any other category — confirming it is not just larger but structurally more demand-intensive.
Top 5 Keywords from Course Titles
| KeywordCount | |
| learn | 506 |
| trading | 313 |
| beginners | 299 |
| course | 244 |
| web | 221 |
"Learn" appearing in 506 course titles (13.8% of all courses) reflects instructor SEO behavior — "Learn Python in 30 Days", "Learn Web Design from Scratch" — a title formula that became standard because it matches how beginners search. "Trading" at 313 is a Business Finance sub-category signal — Forex, stock, and crypto trading courses were a high-volume content type in this period. "Beginners" at 299 confirms the platform's audience skews toward entry-level learners, which also explains why the average content duration is modest at 4.1 hours — beginners don't want 40-hour deep dives. "Course" appearing 244 times in course titles is pure SEO keyword stuffing — instructors literally putting the word "course" in their course title to match search queries.
Key Insights
- Web Development is Udemy's revenue engine with structural dominance that no other category approaches. $627.6M of $881.67M total revenue (71.2%) from one category, with 7.94M of 11.72M subscribers (67.7%), means Udemy's business is fundamentally a web development learning platform with three adjacent categories attached. Any platform strategy that doesn't center Web Development is misaligned with where value actually concentrates.
- Business Finance has a revenue efficiency problem despite equal course volume to Web Development. 1,191 courses generating $123.74M vs 1,199 courses generating $627.6M — the category has equivalent content supply but one-fifth the demand. This points to either lower average course pricing, lower completion/purchase rates, or a more fragmented audience that's harder to convert than the highly motivated web development learner who has clear career ROI from the skill.
- The paid-to-free ratio of 91.6% / 8.4% suggests Udemy had not yet adopted aggressive freemium funneling by 2017. Post-2017, most course platforms shifted toward free content as the primary acquisition mechanism. This dataset captures the pre-freemium era of edtech, which is historically significant for analysts studying platform business model evolution.
- "Beginners" as the third most common keyword confirms the platform's positioning as an entry-level learning tool, not professional development. This has implications for pricing power — beginners are more price-sensitive than professionals seeking certification or career advancement. It also explains why average revenue per subscriber ($75.2) is modest despite $881.67M total.
- Musical Instruments is the category most at risk of elimination. Lowest revenue ($53.36M), lowest subscribers (846.69K), second-highest content hours (1.94K), lowest revenue per content hour, and least efficient subscriber acquisition. The category exists but doesn't generate returns commensurate with its content investment. A platform optimization analysis would flag this category for strategic review.
- "Trading" as the second-most common keyword (313 occurrences) during 2011–2017 reflects the pre-crypto retail trading surge. This era saw explosive growth in Forex and stock trading courses targeted at retail investors. Post-2017, crypto trading courses would likely have entered this list. The keyword data is a timestamp of the financial education zeitgeist of that specific period.
Who This Template Is For
- Edtech Analysts and Online Course Creators benchmarking course performance, category positioning, and subscriber acquisition across a real marketplace dataset
- Product Managers at learning platforms analyzing content supply vs demand imbalances by subject and level
- BI Developers and Data Analysts building marketplace dashboards that combine sales, subscriber, content, and course-level dimensions across multiple tabs
How to Use
- Download the PBIX file
- Open in Power BI Desktop
- Data is embedded from the public Udemy course dataset — no connection setup required
- Use Subject and Level filters (left sidebar) to segment all visuals simultaneously
- Use the timeline (2011–2017) at the top to filter by year
- Navigate between Overview, Sales, Subscriber, Content, and Courses tabs for deeper analysis per dimension
Soft CTA:
"Need to display course catalog data in a structured table with sortable columns, revenue variance by category, and conditional formatting by performance tier? Flexa Tables is a Microsoft-certified Power BI visual built for exactly this kind of multi-level tabular reporting."
Other Templates
 Free Education
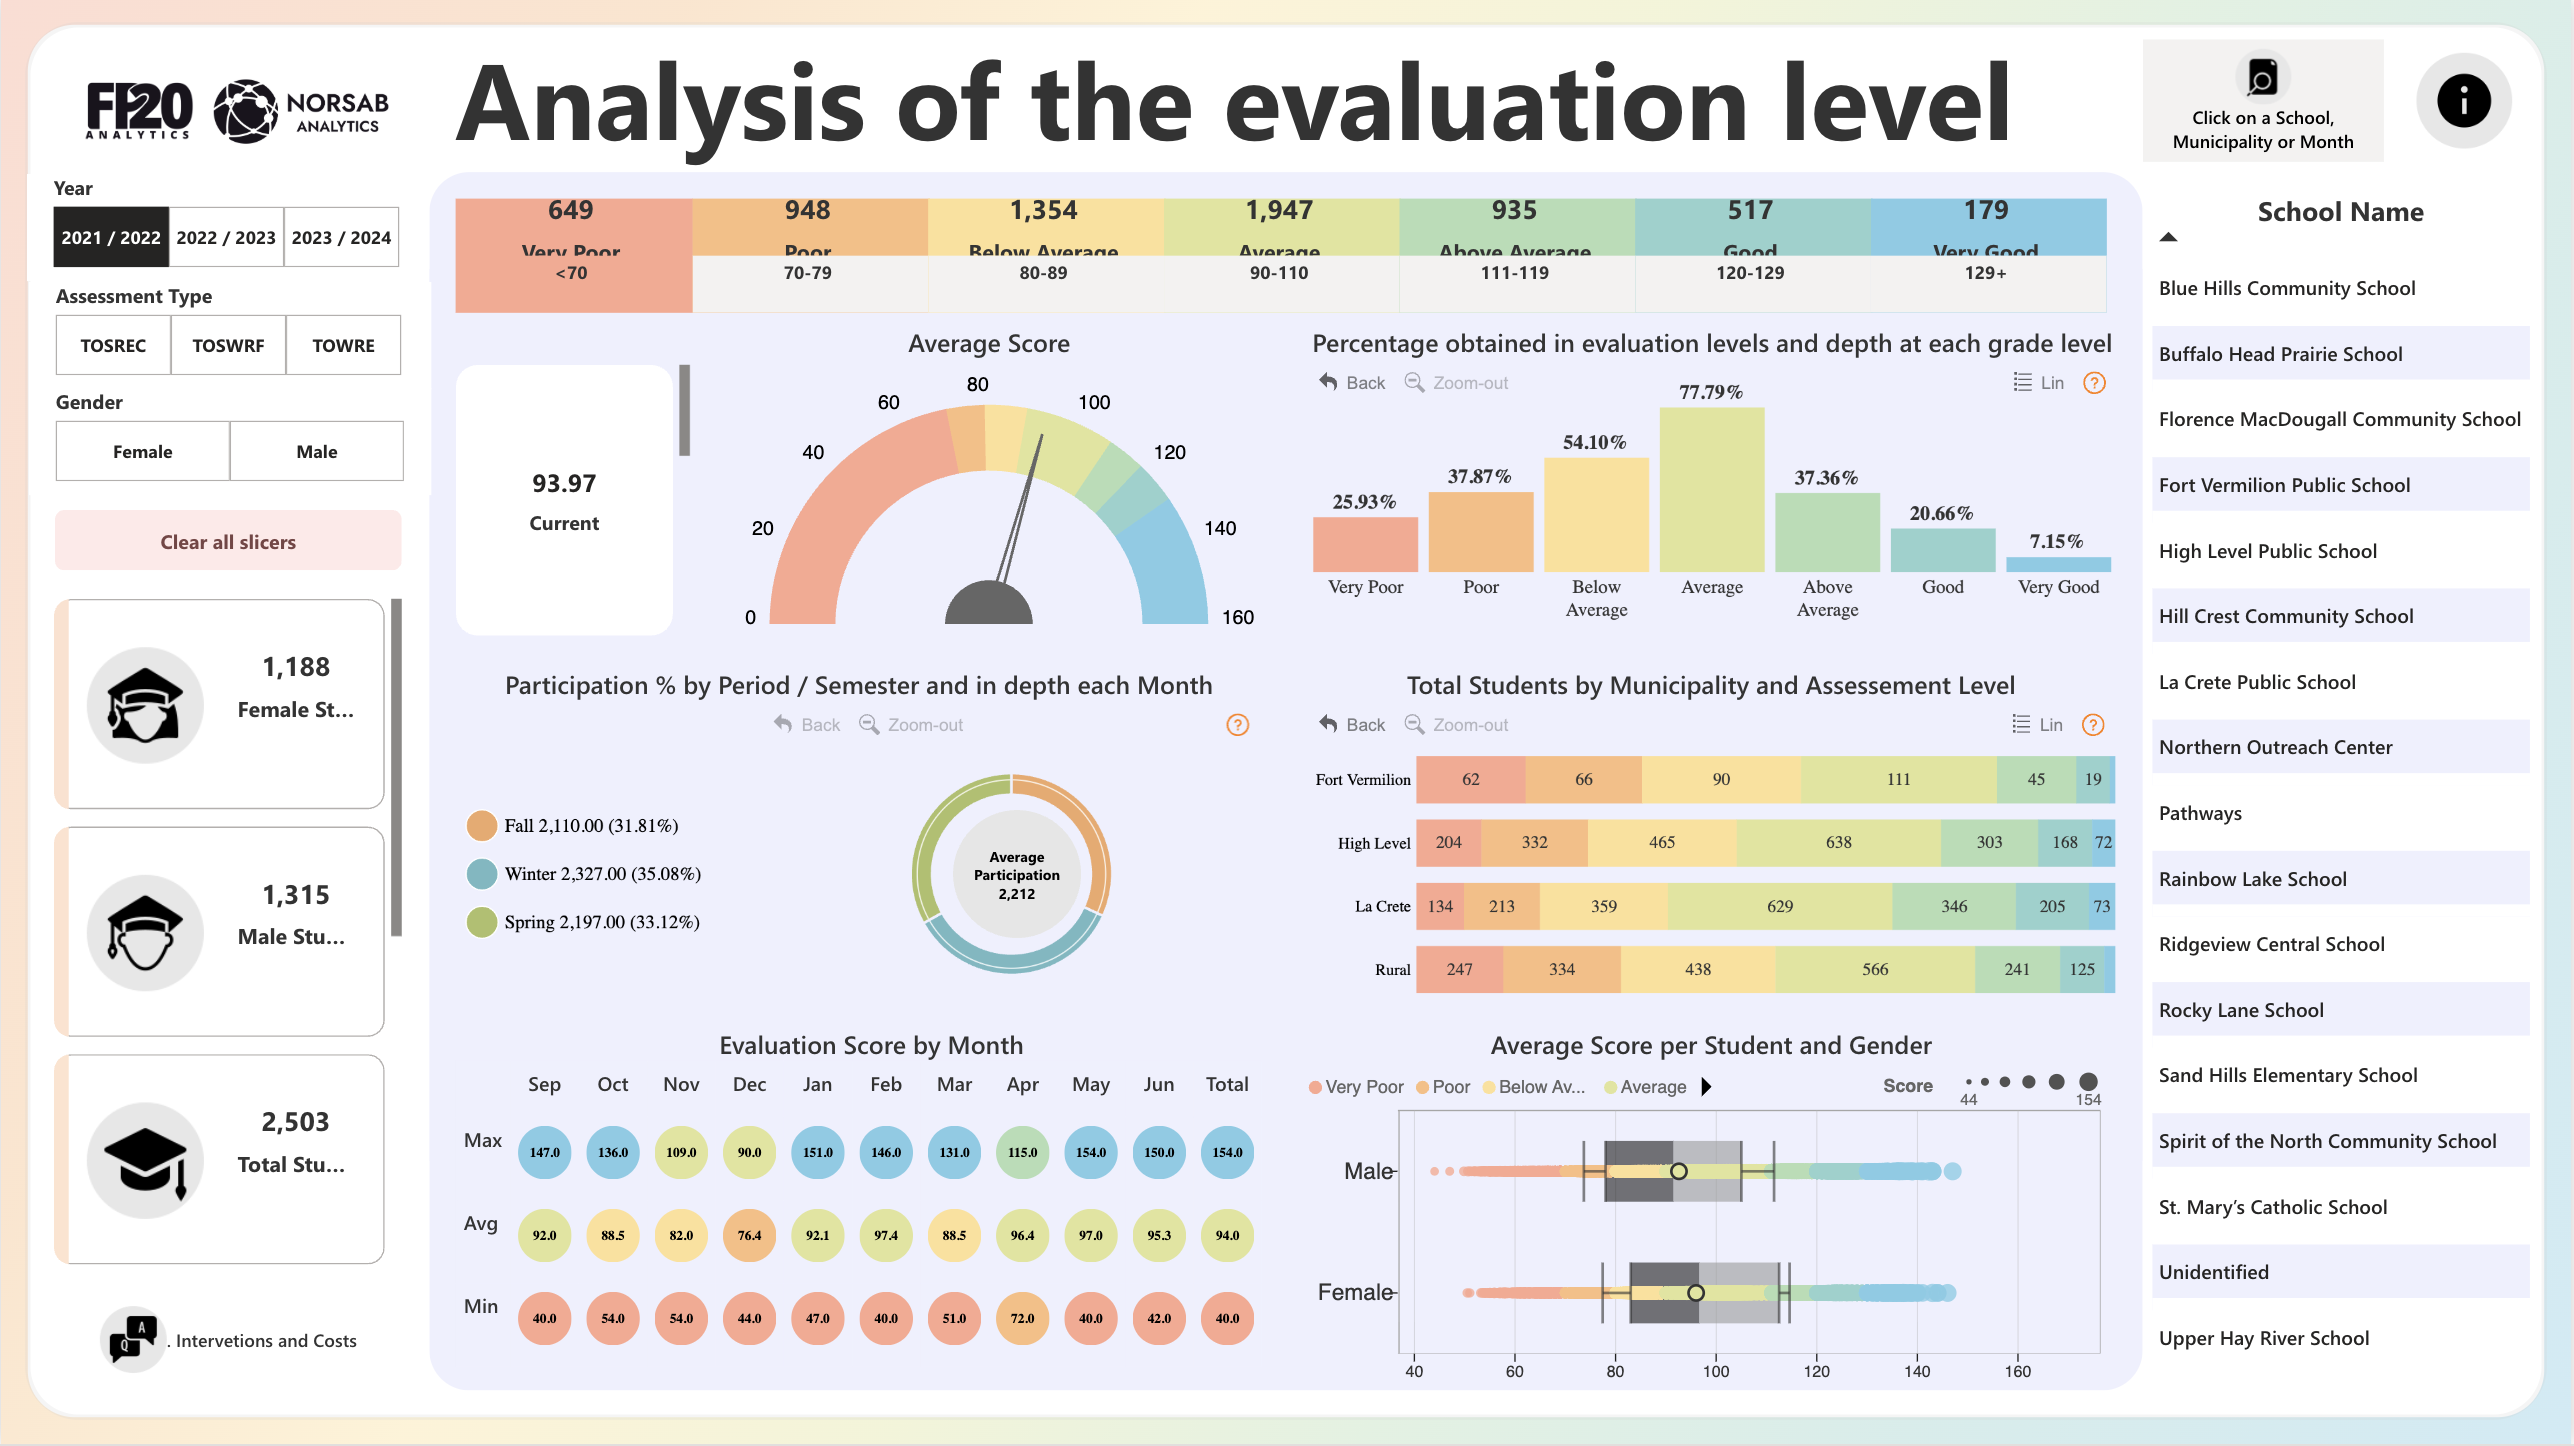
Power BI Student Evaluation Level Dashboard Template (Free PBIX Download)
 Free Sales & Revenue
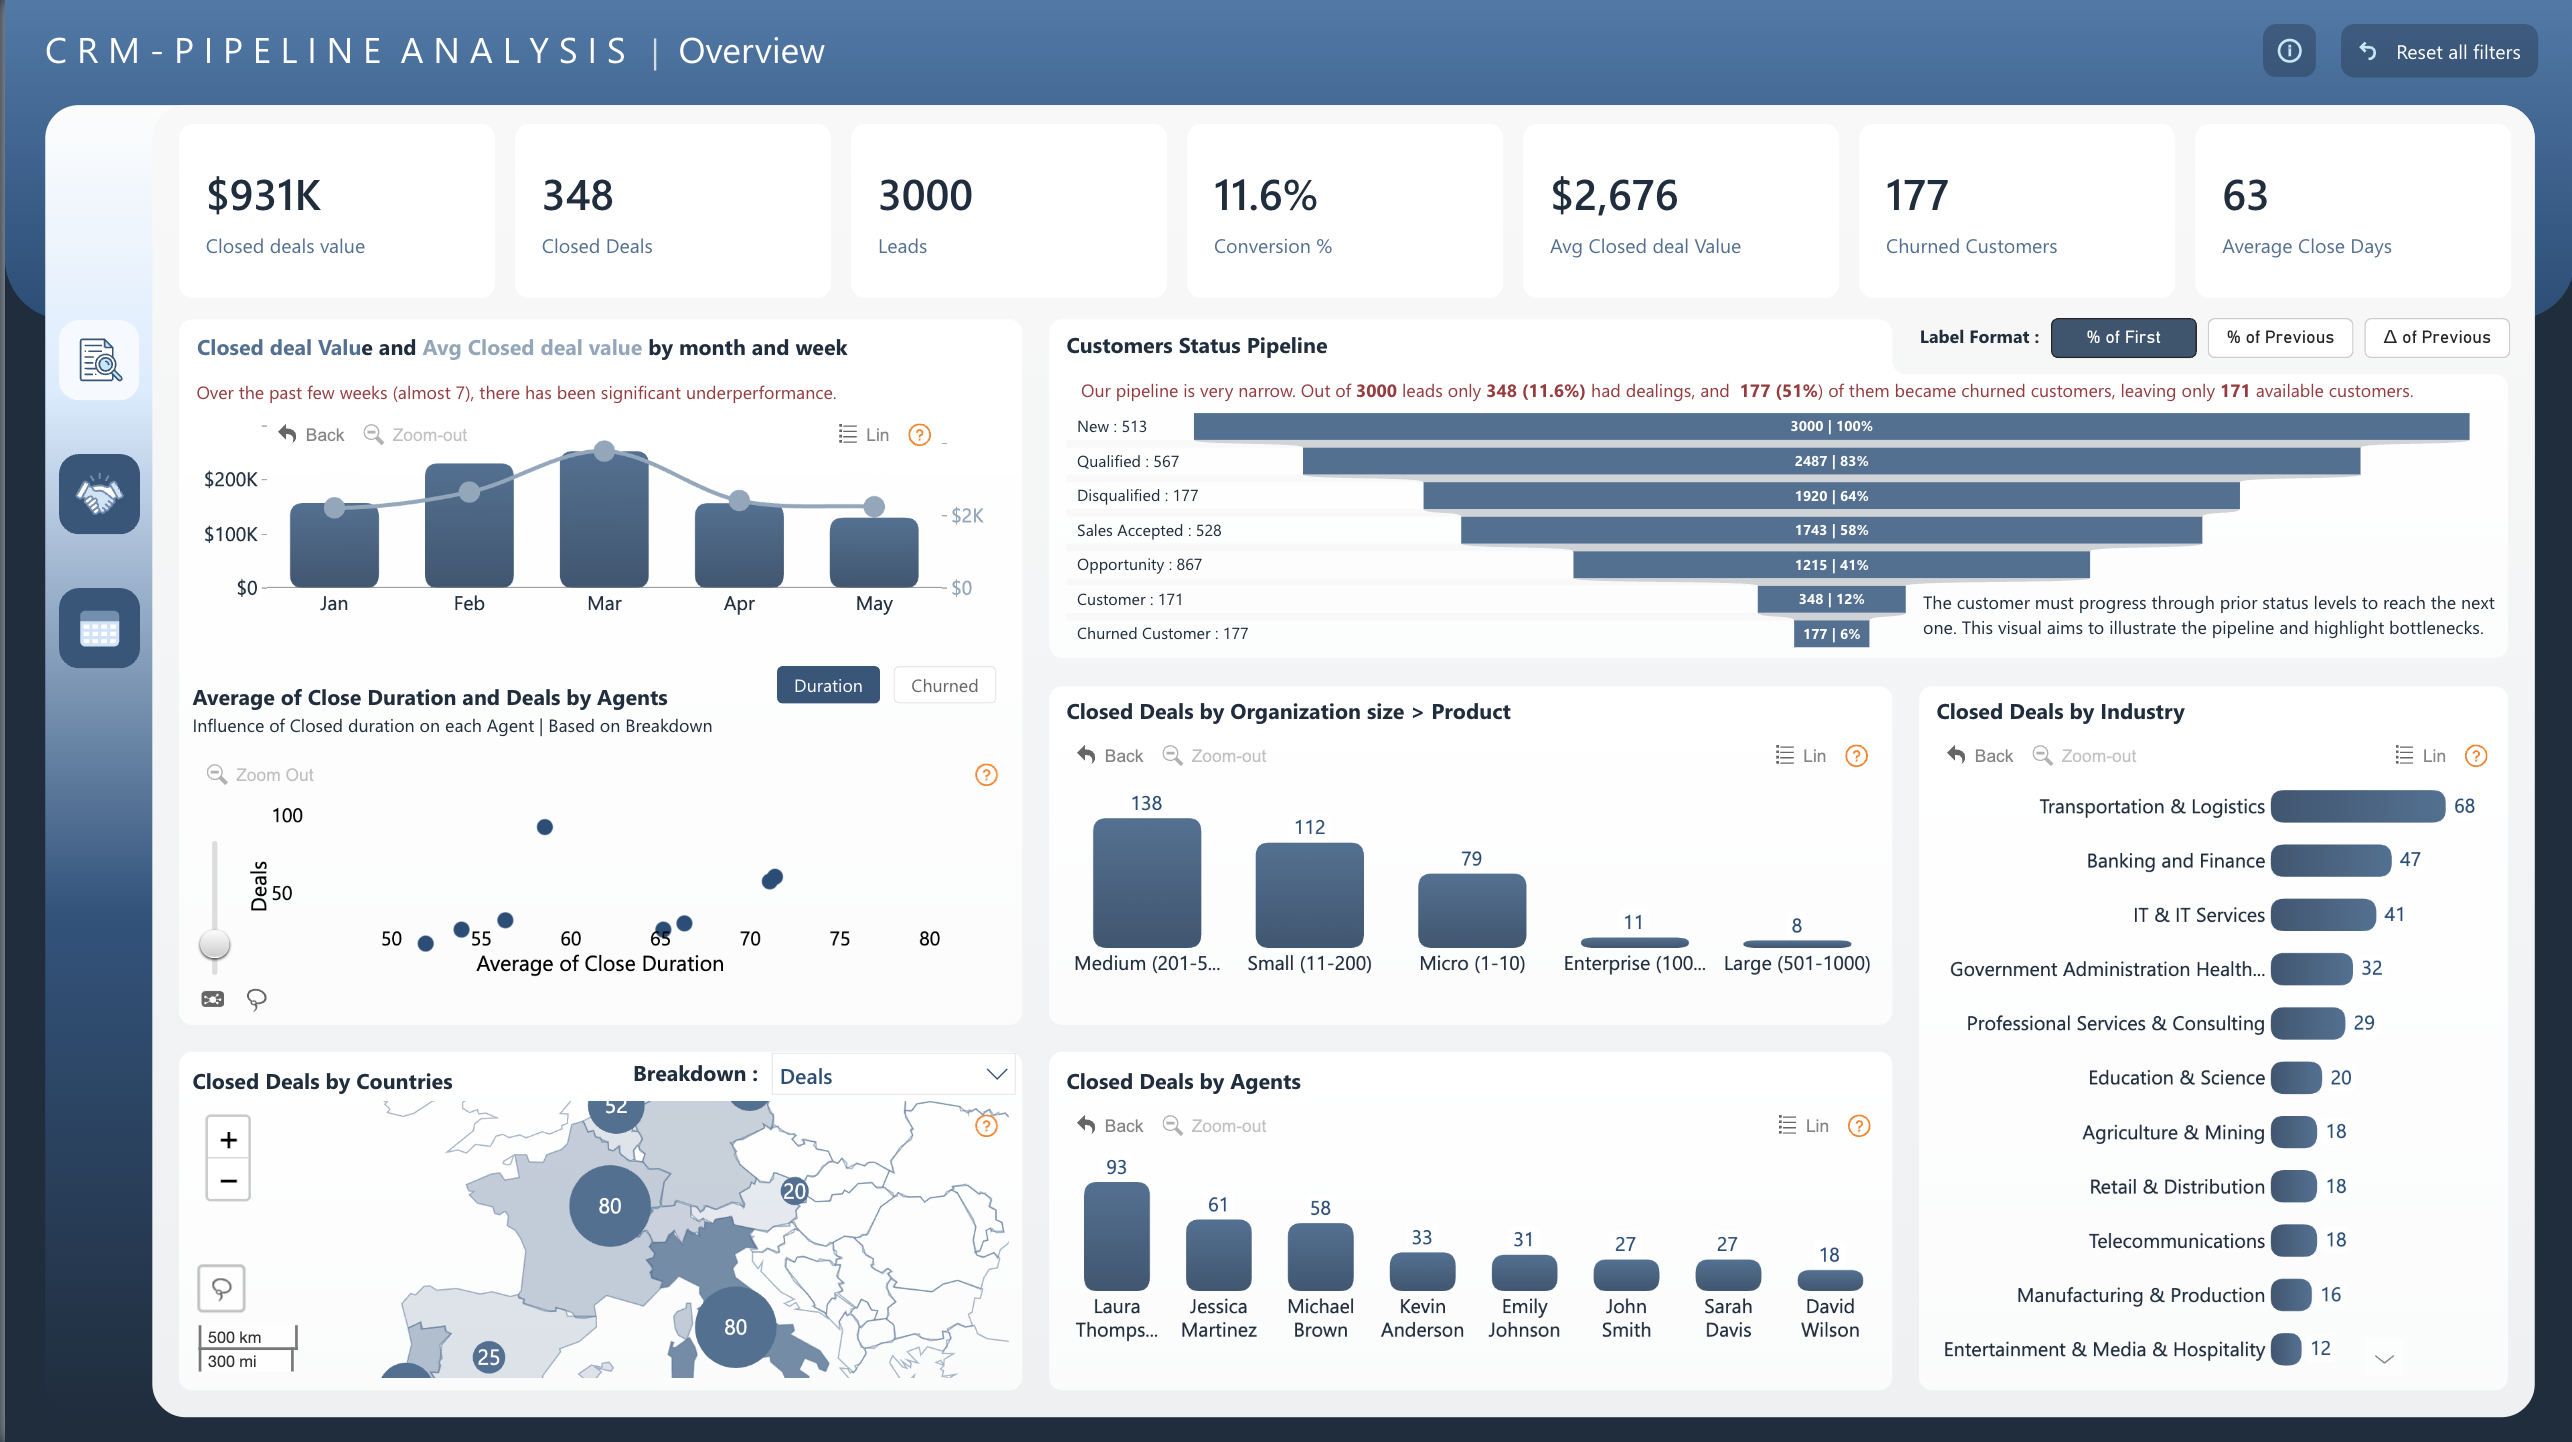
Power BI CRM Pipeline Analysis Dashboard Template (Free PBIX Download)
 Free Operations & Production
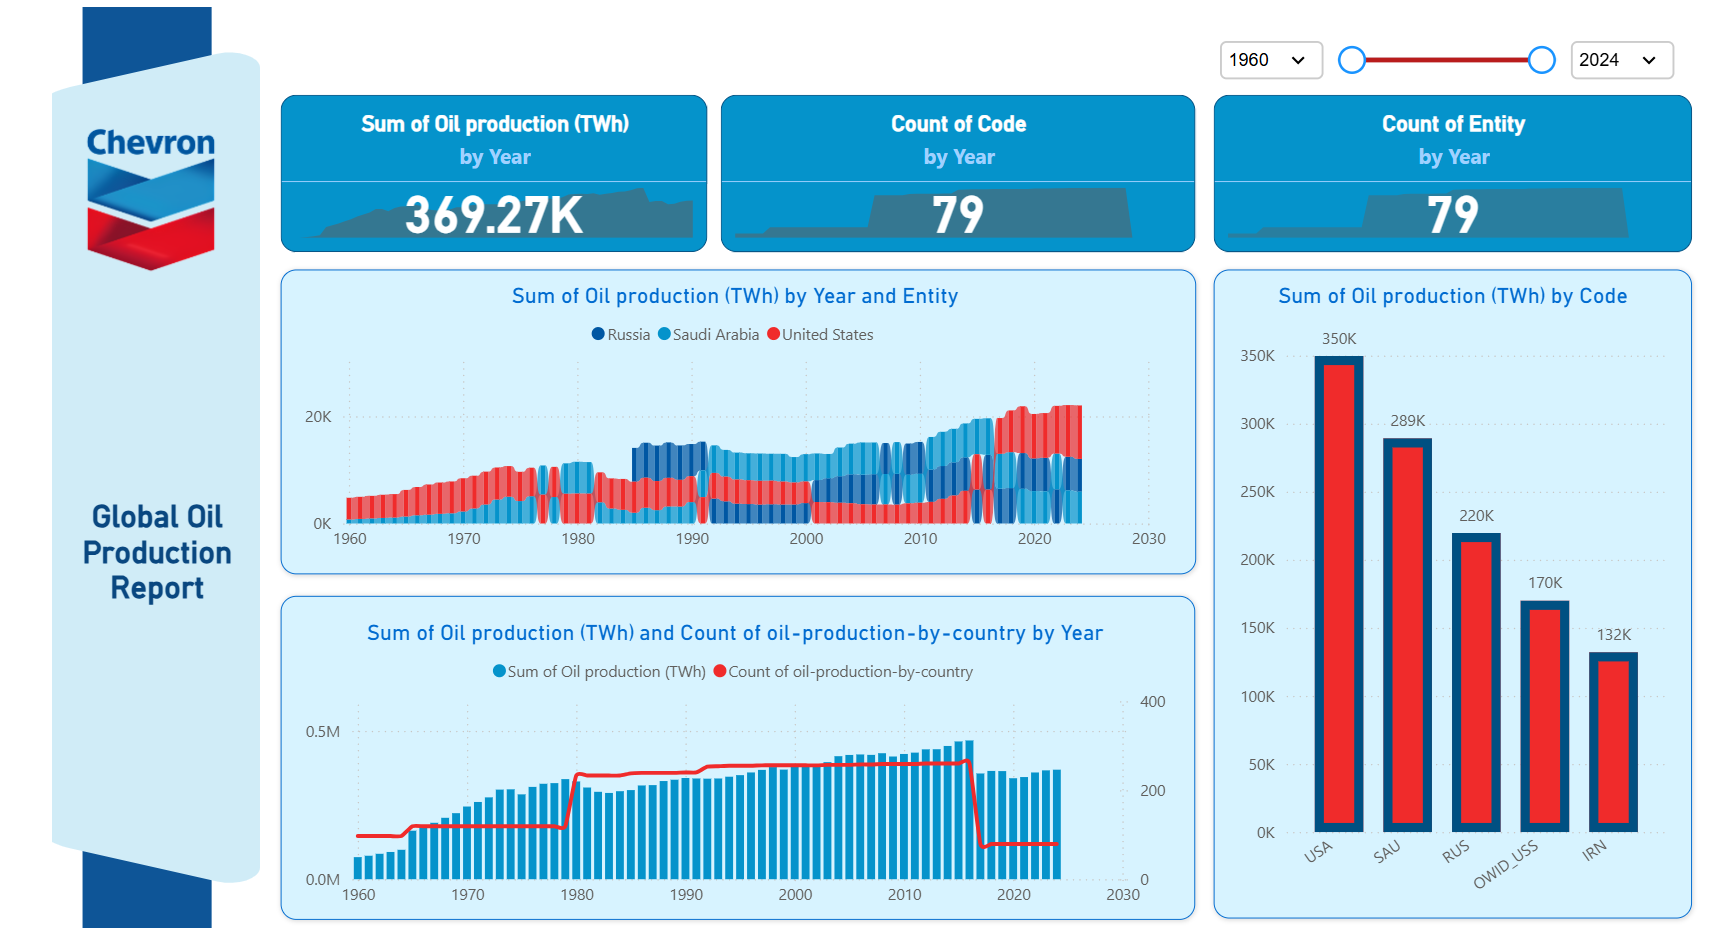
Global Oil Production Report
If you find this website helpful, share it with friends and colleagues to boost their Power BI skills and work efficiency!
Like this site? Share it