
Insights & Tutorials
Blog
Power BI tutorials, tips, and best practices from the Flexa Intel team.
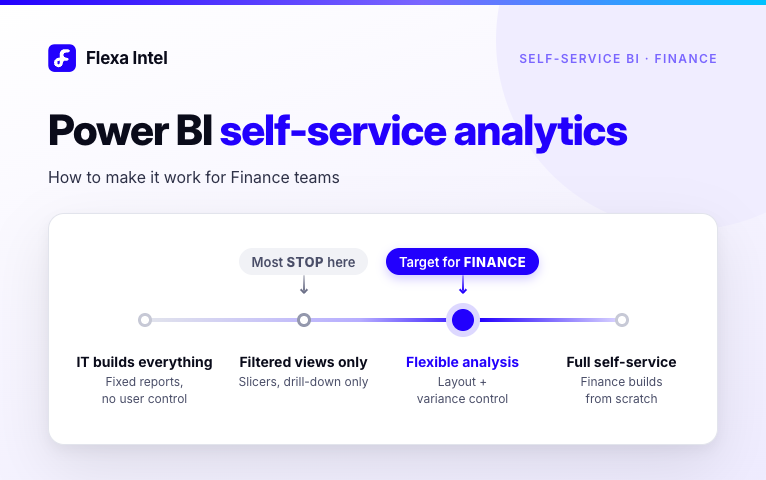
Power BI Self-Service Analytics
Only 20% of non-IT users can meet their own BI needs today. Learn why Power BI self-service analytics falls short and the setup that works for finance.
by AdminAugust 12, 2026


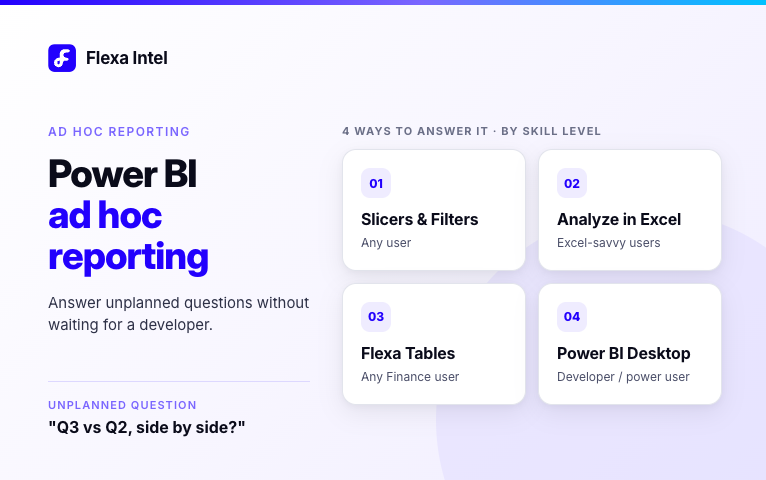
Power BI Ad Hoc Reporting
Power BI ad hoc reporting lets users answer unplanned questions without a developer. See what works natively and which tools make it truly self-service.
by AdminAugust 11, 2026
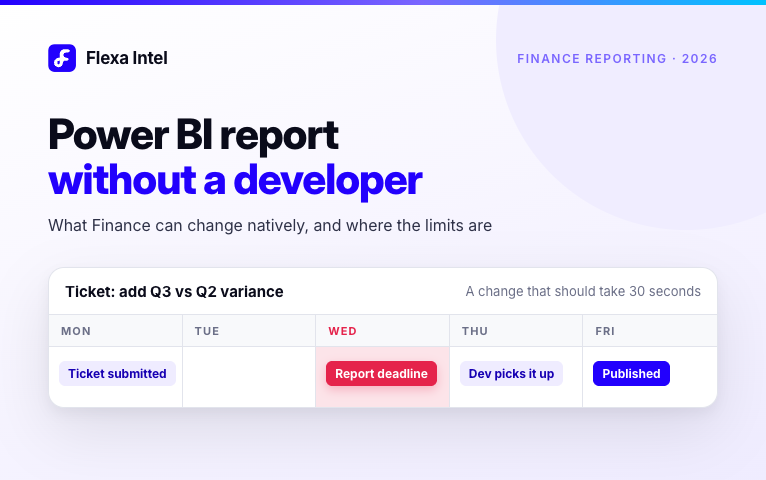
Power BI Report Without Developer
Can finance teams change Power BI reports without a developer? See what's possible natively, where the limits are and how to remove it for good.
by AdminAugust 11, 2026
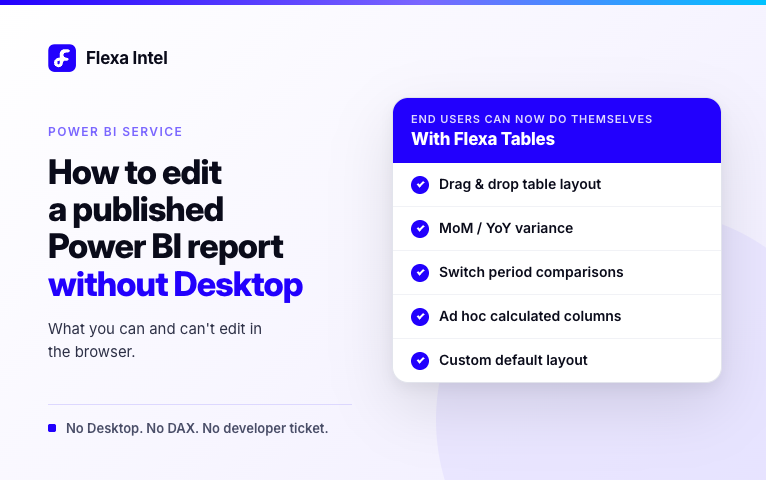
How to Edit Published Power BI Report Without Desktop
Tired of developer tickets for every layout change? See what you can and can't edit in a published Power BI report, and how to drop the Desktop dependency.
by AdminAugust 11, 2026
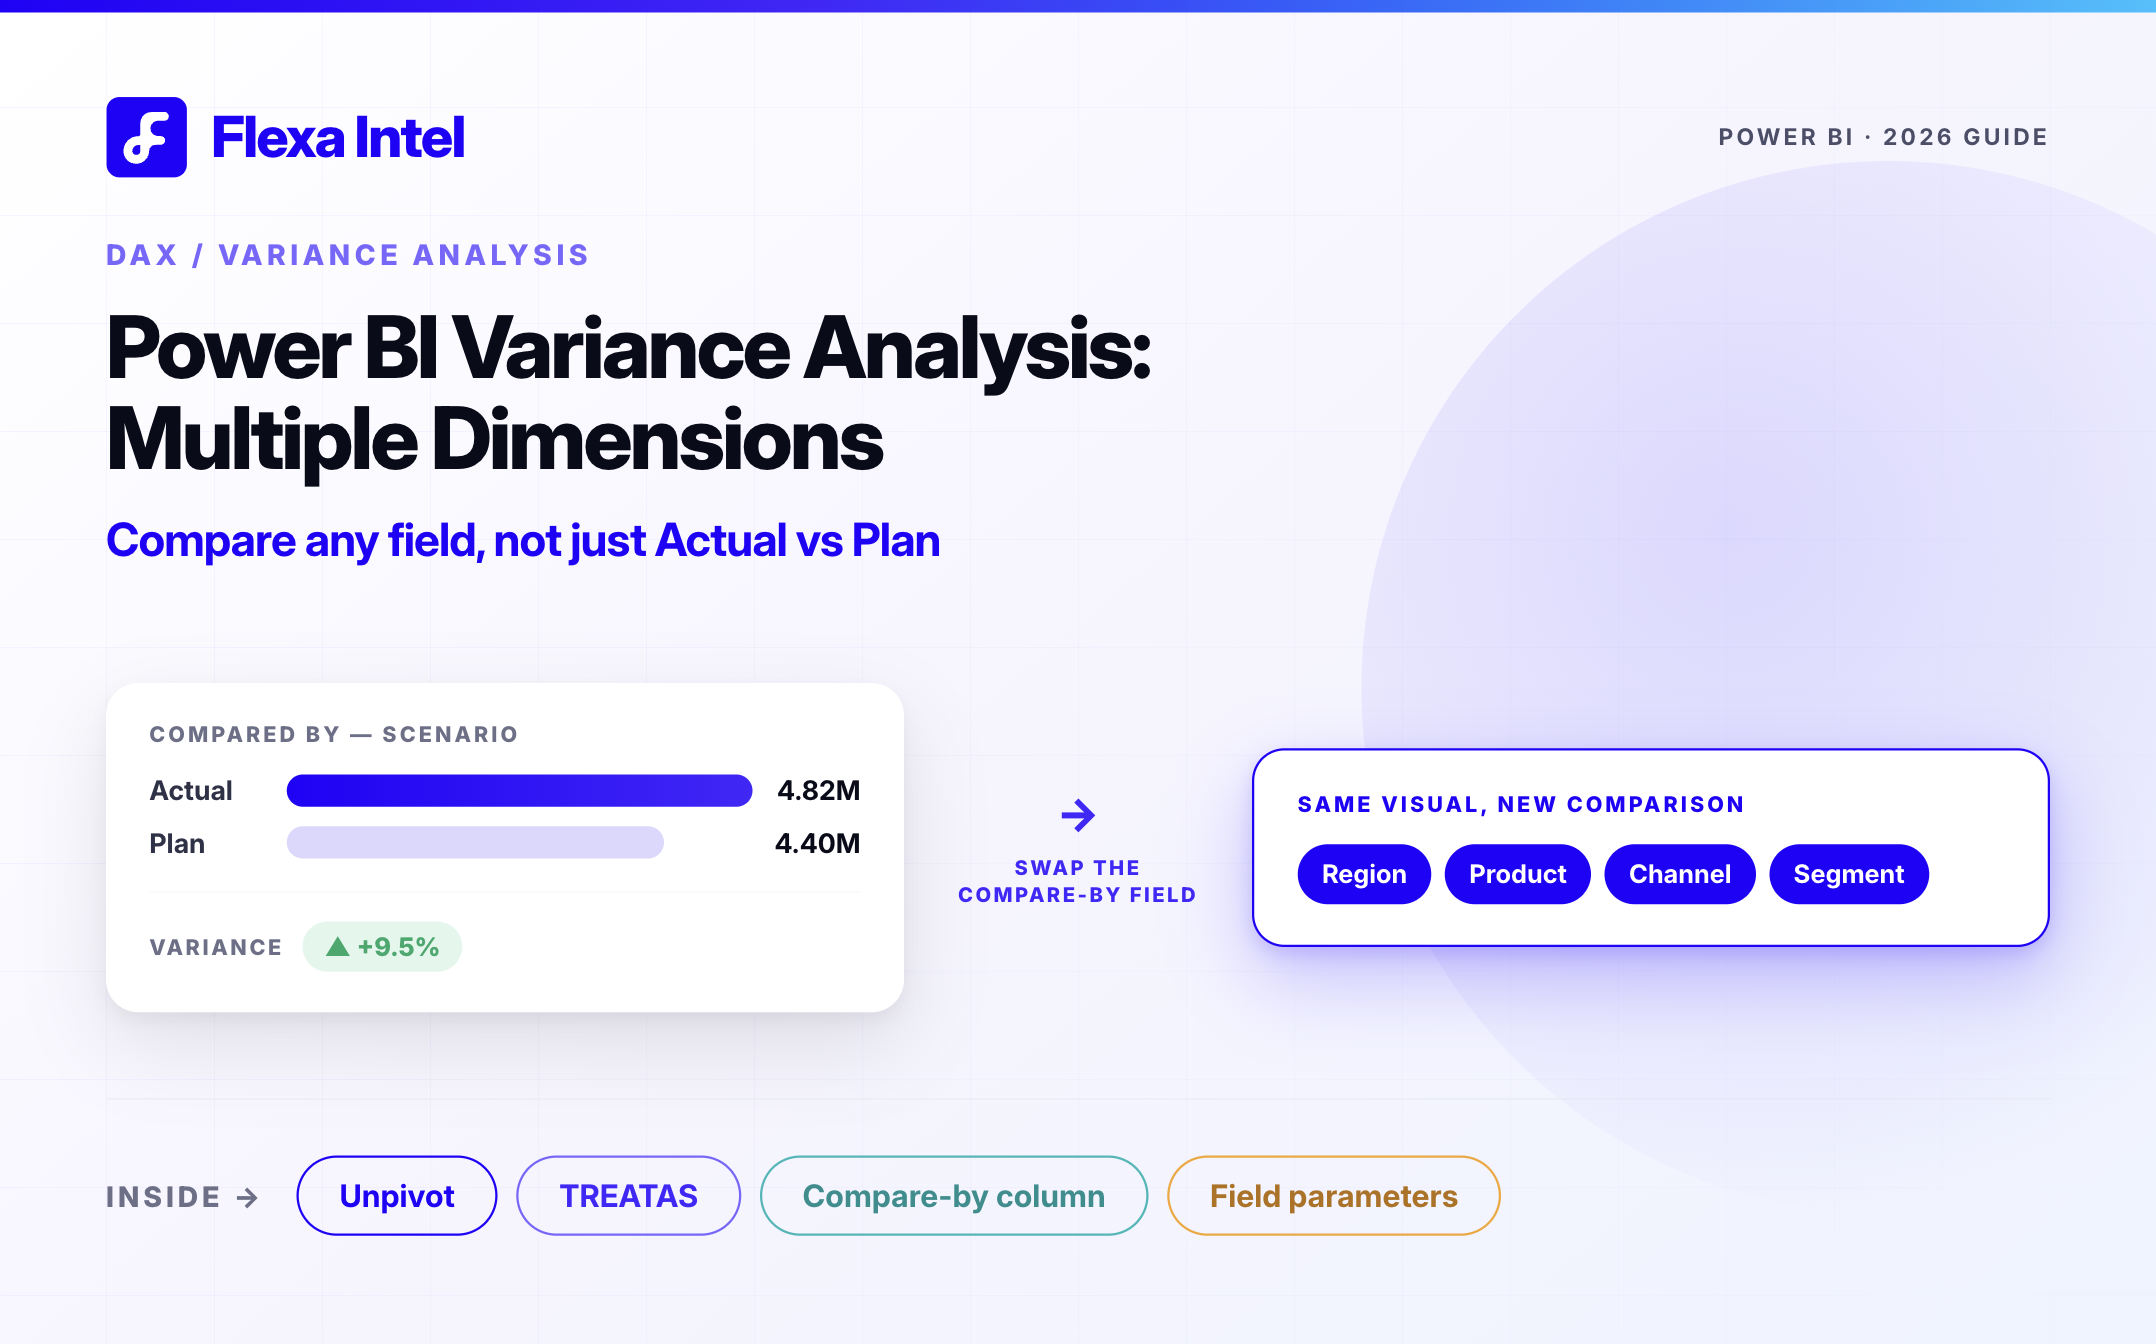
Power BI Variance Analysis: Multiple Dimensions
See how to compare Power BI variance by region, product, and scenario at once, including the DAX steps needed when Actual and Plan sit in separate tables.
by AdminAugust 5, 2026
.png?alt=media&token=5e9e02de-f712-4b96-bb97-c2e4f8b47919)
Power BI Variance Analysis: Dynamic vs Fixed Comparison
Power BI variance tools run on two models: fixed (AC/PL/PY) or dynamic (any dimension). See how each works, what breaks, and which one fits your report.
by AdminAugust 3, 2026
.png?alt=media&token=5e47739d-4a10-4b3d-af83-4927d1046146)
How to Show Variance in Power BI Table
Add a variance column to any Power BI table — DAX measures for absolute and % variance, plus a no-DAX method for reports that are already published.
by AdminAugust 3, 2026
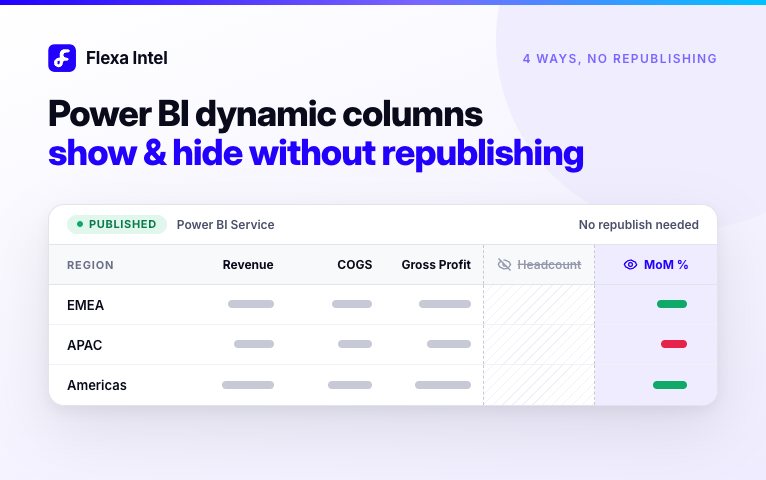
Power BI Dynamic Columns Show Hide Without Republishing
4 ways to show or hide Power BI columns dynamically without republishing: Field Parameters, bookmarks, BLANK() trick and Flexa Tables, with setup steps.
by AdminAugust 3, 2026
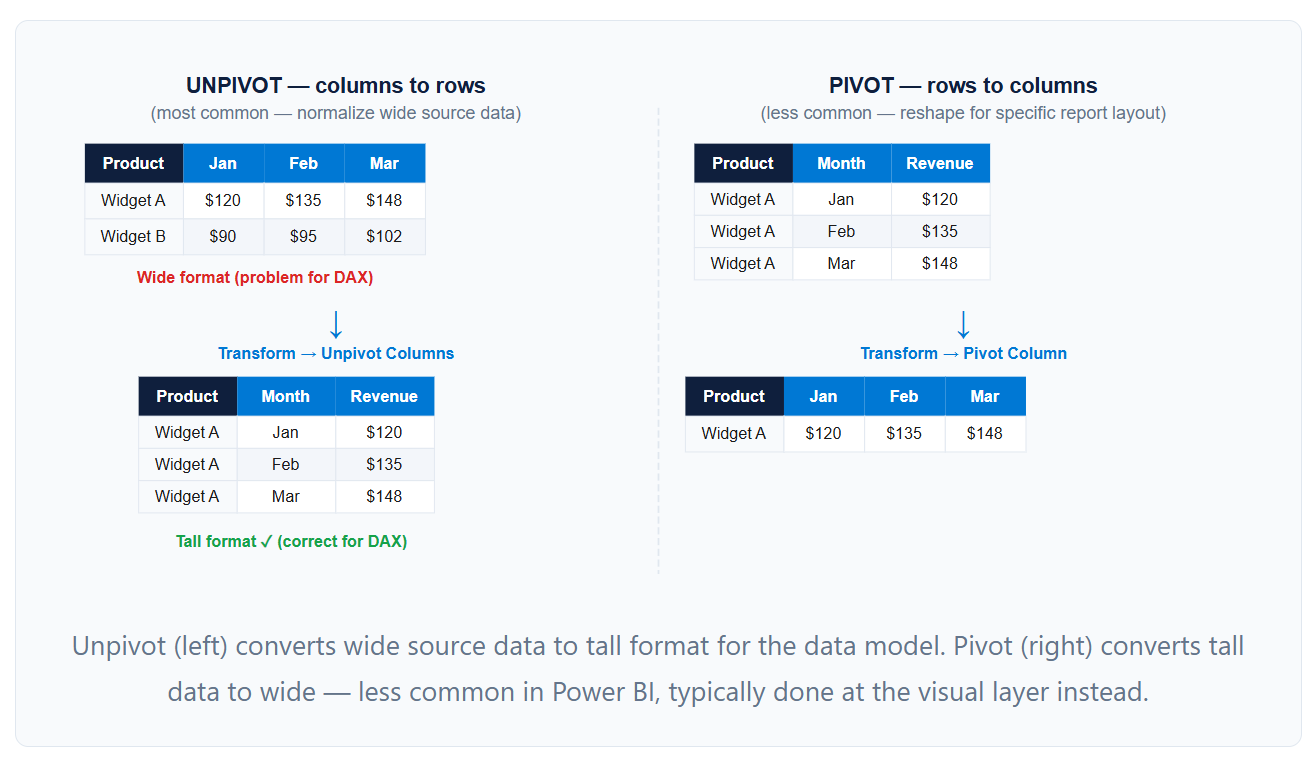
Power BI Rows to Columns Unpivot Pivot Complete Guide
Convert rows to columns (pivot) and columns to rows (unpivot) in Power BI: Power Query steps, when to use each, common errors and dynamic pivot tips.
by AdminAugust 3, 2026
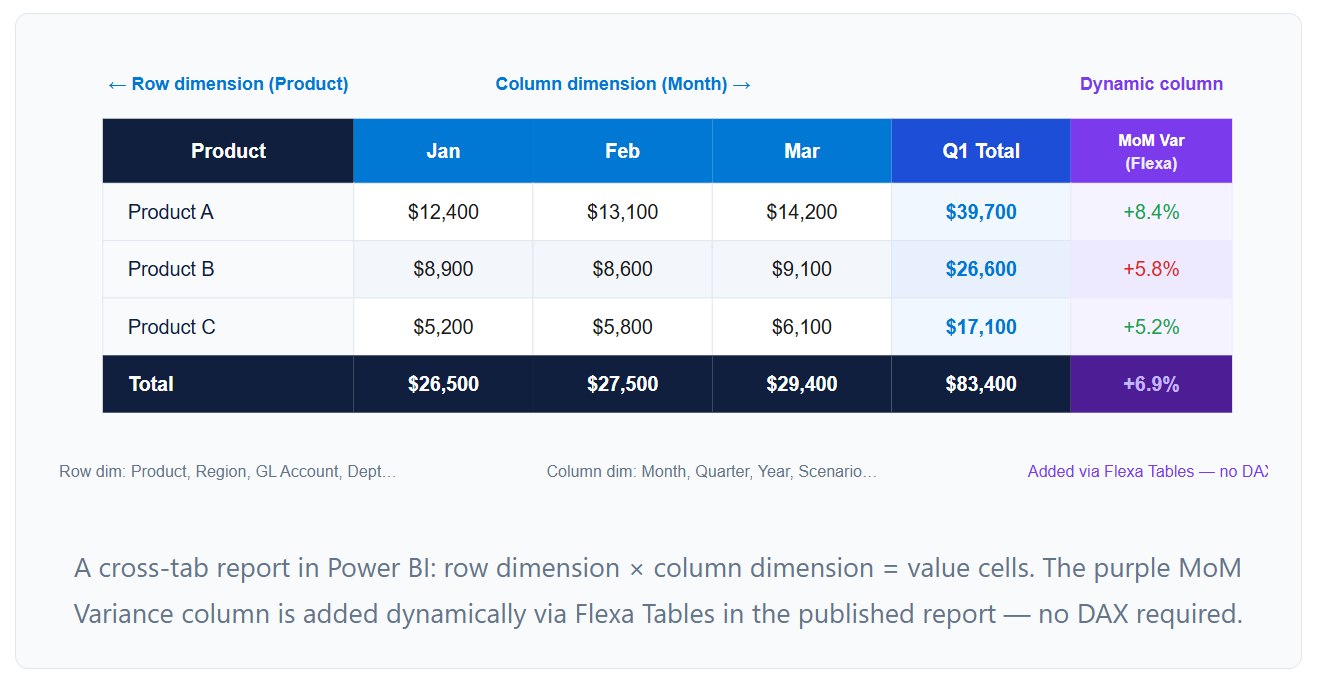
Power BI Cross Tab Report
Build a cross-tab report in Power BI: compare Matrix, Power Query pivot and custom visuals, learn when to use each, and add dynamic columns without DAX.
by AdminJuly 31, 2026
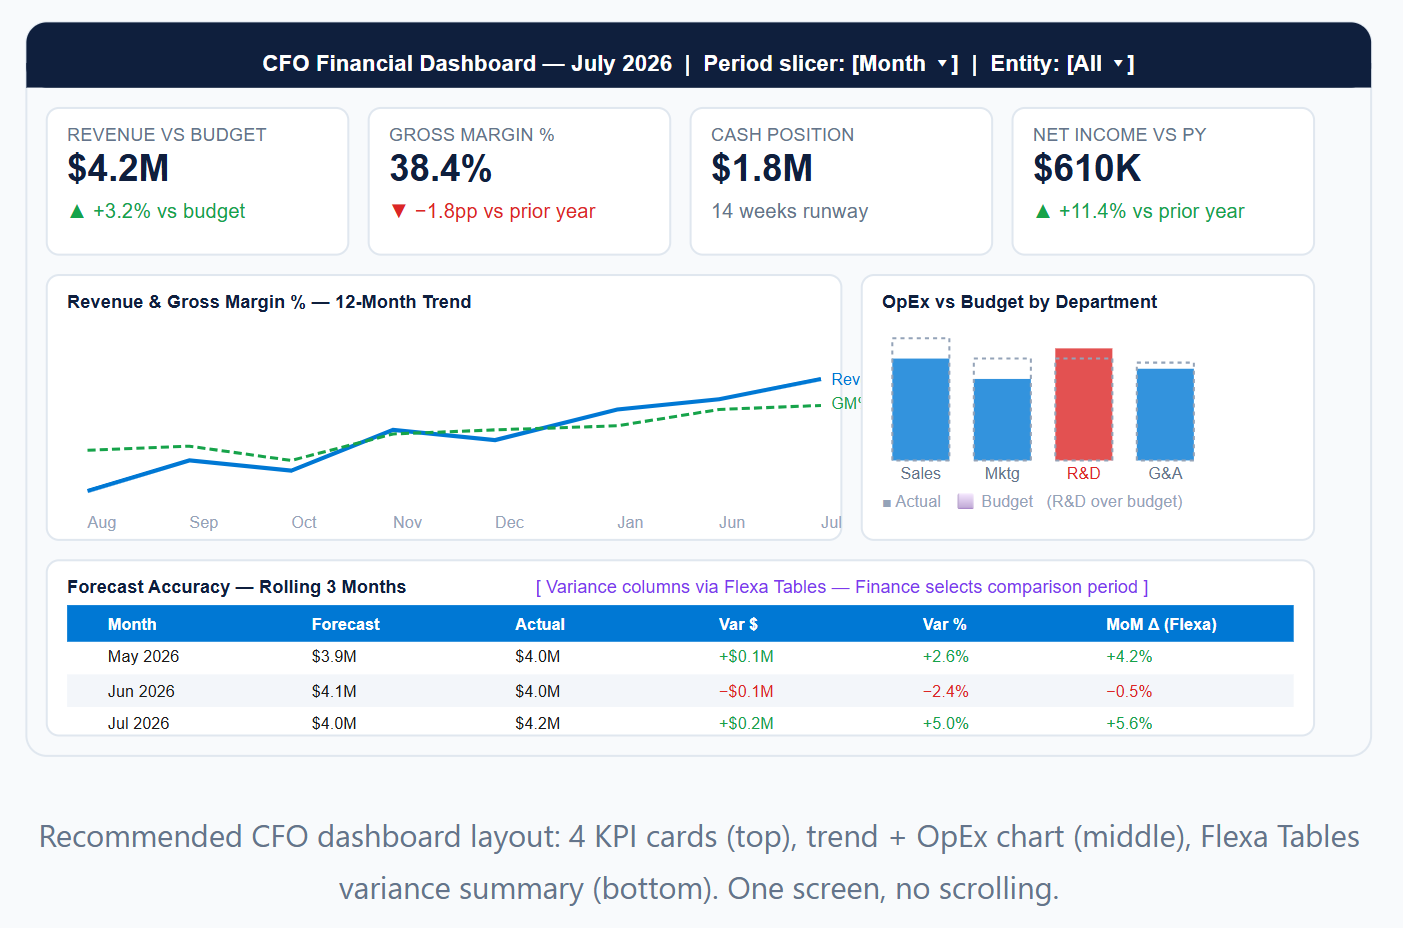
Power BI Financial Dashboard CFO
Build a Power BI financial dashboard for CFOs: which KPIs to show, how to structure the layout, and how to give CFOs self-service variance without IT help.
by AdminJuly 31, 2026
Power BI Actual vs Forecast: 3 Ways to Compare
DAX matrix, variance charts, or drag-and-drop — see three ways to build Actual vs Forecast comparisons in Power BI and which one fits your report.
by AdminJuly 30, 2026