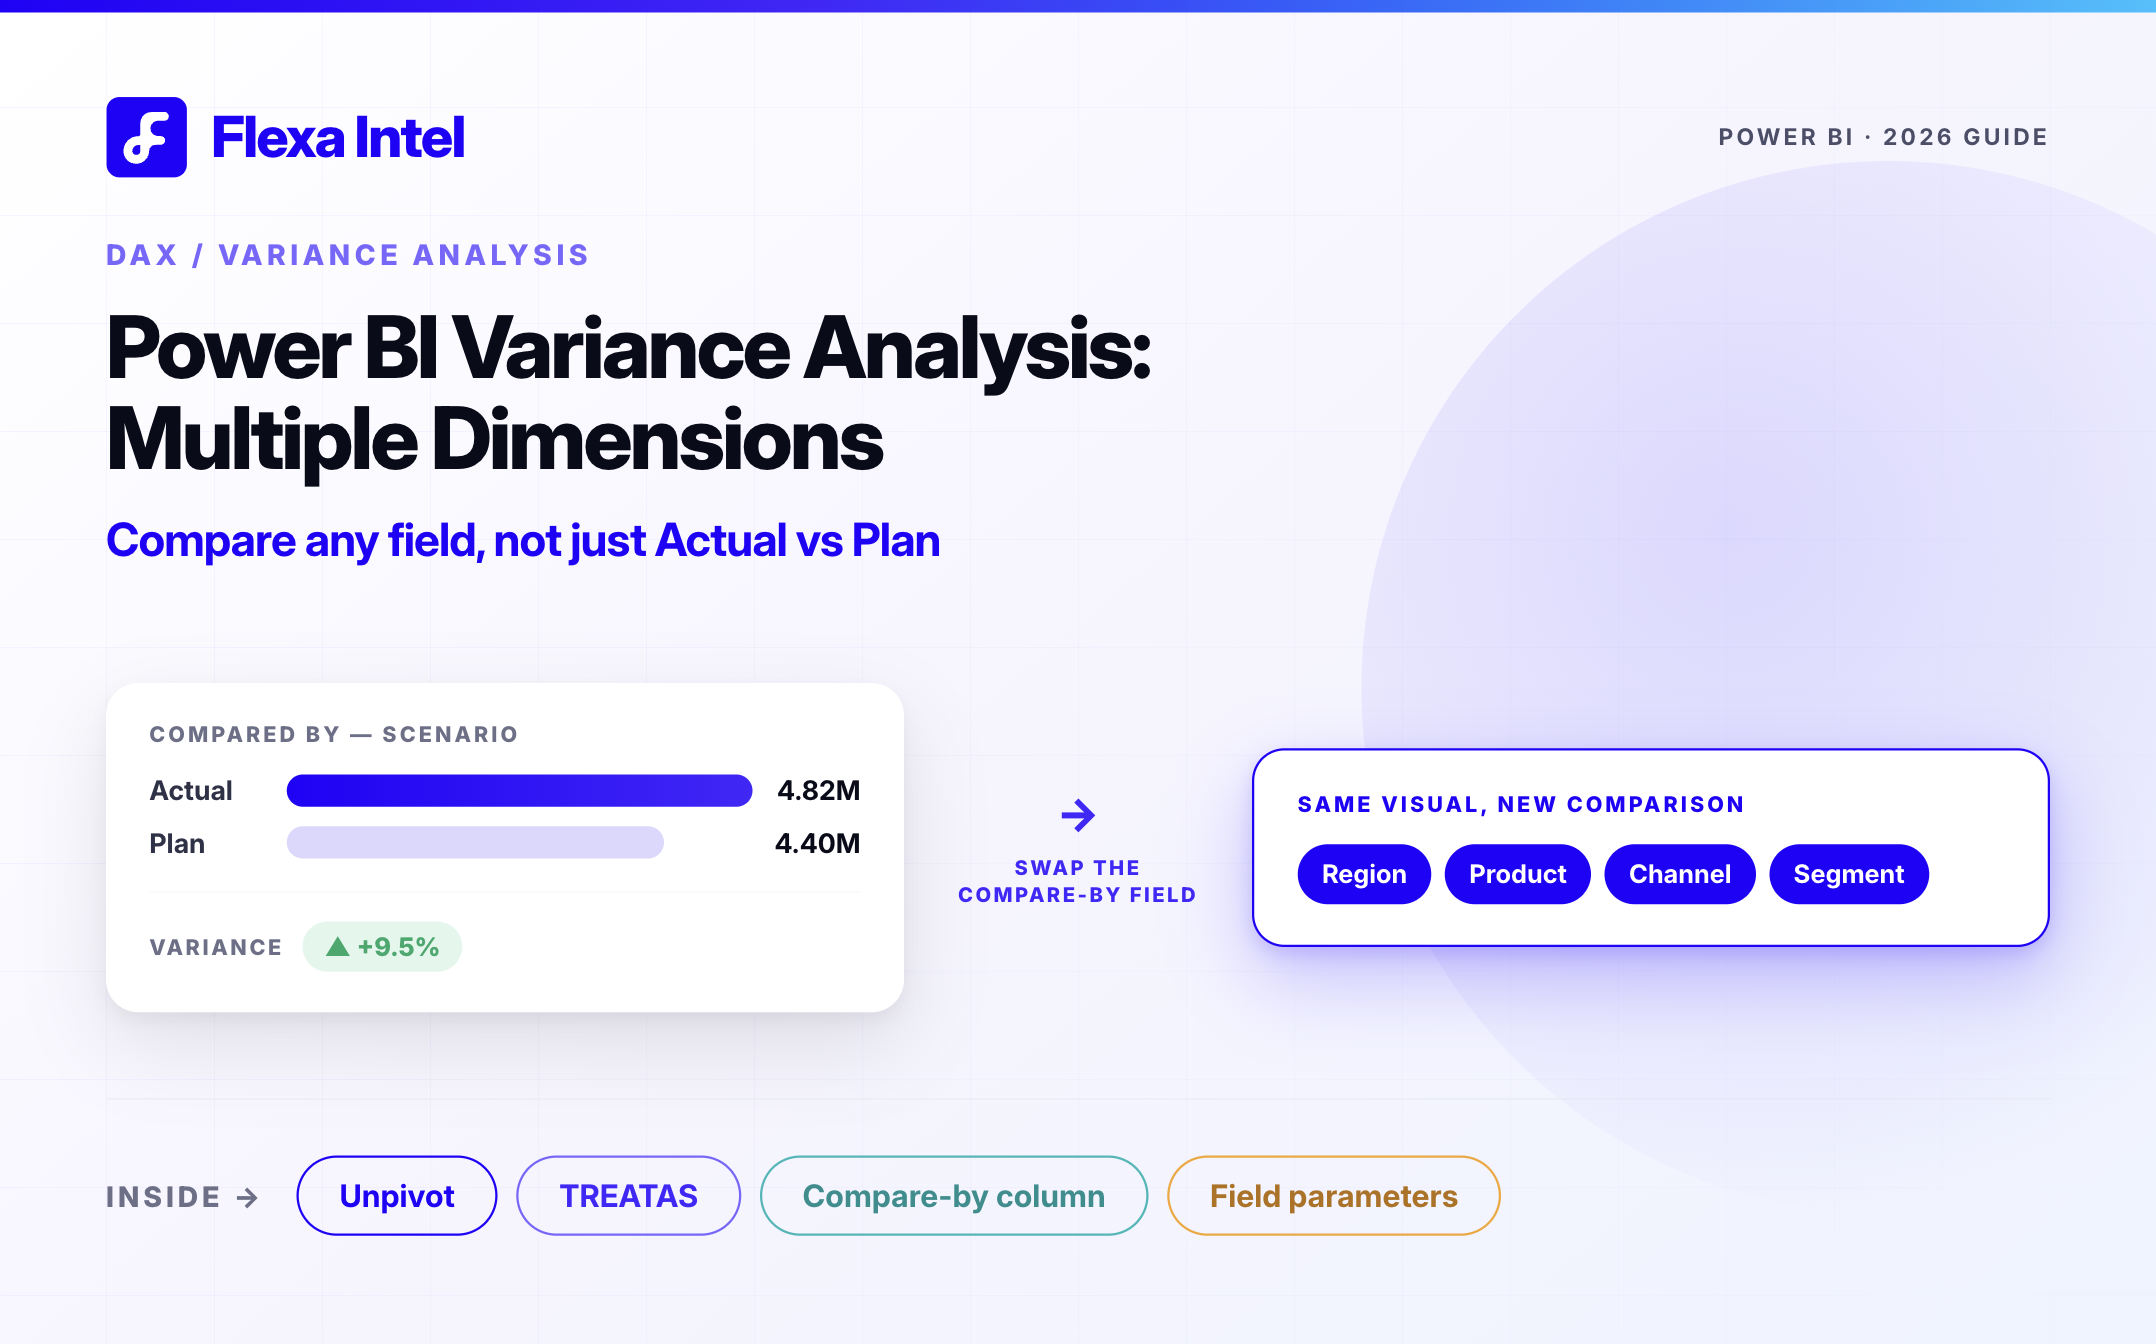
Quick answerA dynamic variance comparison in Power BI isn't limited to Actual vs Plan — it works on any field with two or more categorical values (Category, Region, Channel...), broken down by any other field on the rows. If your comparison field already exists as a normal column, it works with zero setup. The one common exception is Actual/Plan/Prior Year, which usually needs a prep step first because those values are typically modeled as separate measures rather than as values in a shared column — unpivot them into one long table, or bridge them with a DAX TREATAS pattern. For the difference between this dynamic approach and a fixed AC/PL/PY model, see our Dynamic vs Fixed comparison guide.
Most variance walkthroughs default to one framing: Actual vs Budget. But "Compared By" isn't locked to that scenario at all — it works on any field with two or more categorical values. Consulting vs Hardware. East vs West. Q1 vs Q2. Actual vs Plan is just one example of a much more general pattern: which two values to compare (from any field) and which other dimension to break it down by (on the rows). Mixing these two up is exactly where reports get rebuilt unnecessarily — so this guide keeps them separate from the start.
Two independent choices, on any fields — Actual/Plan is one example, not the only one.
This guide uses Actual vs Plan as the running example because it's the case that needs a prep step first (Step 2 below). If your comparison field already exists naturally — like a Category or Region column — you can skip straight to Step 3 with zero setup.
2Step 1: Check Your Data Model
Before building anything, answer one question: does the field you want to compare by already exist as values in one column (like Category: Consulting/Hardware, or Region: East/West) — or is it something like Actual/Plan/Prior Year that was modeled as separate measures instead?
TipIf your comparison field is already a normal attribute column — Category, Region, Channel, anything — there's nothing to prepare. Drag it straight into "Compared By" and skip to Step 3. The prep work below is specifically for values like Actual/Plan/Prior Year that typically live as separate measures, not as values in a shared column.
To check this for Actual/Plan/Prior Year specifically, open your model view (or a quick pivot table against each source): do they already share a common dimension at the same grain, or do they live in separate tables with no shared key?
Most teams land in the right-hand case — that's the one this guide focuses on preparing.
3Step 2: Creating the Compare-By Column
This step is specifically for the Actual/Plan/Prior Year case — if your comparison field already exists as a normal column (Category, Region, Channel...), you don't need any of this. If Actual, Plan, and Prior Year live in separate tables as separate measures, you need one shared column before either a fixed or dynamic tool can compare them across dimensions cleanly. There are two credible ways to get there.
Option A — Unpivot into one long table (recommended for most cases). In Power Query, append Actual, Plan, and Forecast into a single table and add a "Scenario" column that labels which is which before combining. This is the same best-practice pattern documented in the Microsoft Fabric Community for exactly this situation: once combined, you need one measure, not one per comparison pair.
Power Query steps
1. Home > Combine Queries > Append (Actual, Plan, Forecast)
2. Before appending, add a Custom Column to each: Scenario = "Actual" / "Plan" / "Forecast"
3. Result: one fact table with columns [Date, Region, Product, Scenario, Amount]
4. "Scenario" is now your compare-by column
Option B — Bridge separate tables with TREATAS. If you'd rather not restructure the tables, DAX's TREATAS function can create a virtual relationship between tables that don't share a physical key, based on matching dimension values. This is the same technique documented by DAX Patterns (SQLBI) for budget-vs-actual models at different granularities:
Actual vs Plan Variance =
VAR ActualAmount =
SUM ( FactActual[Amount] )
VAR PlanAmount =
CALCULATE (
SUM ( FactPlan[Amount] ),
TREATAS ( VALUES ( 'Date'[Month] ), FactPlan[Month] ),
TREATAS ( VALUES ( 'Product'[ProductID] ), FactPlan[ProductID] )
)
RETURN
ActualAmount - PlanAmount
Pattern adapted from SQLBI's DAX Patterns (daxpatterns.com/budget) and RADACAD's budget-vs-actual model writeups — adjust table and column names to your own model.
TipOption A is easier to maintain long-term: once the data is unified, every future comparison — new region, new scenario, new product — just works. Option B avoids touching your existing tables but means every new comparison may need its own TREATAS pairing. Interestingly, this same TREATAS technique appears in Zebra BI's own documentation for combining Actuals and Plan — it's a standard DAX pattern, not specific to any one tool.
One more native option worth knowing: Power BI's Field Parameters feature lets report viewers swap which measure or dimension a visual uses, which can reduce how often you need a full reshape for simple dimension-switching needs.
4Step 3: Building the Dynamic Comparison
Once a field is ready for "Compared By" — either one that already existed naturally, or the one you built in Step 2 — building the comparison itself works the same way regardless of which field it is. Fixed-model tools (Zebra BI, Inforiver) are built around Actual/Plan/Prior Year roles specifically, so it's worth being clear about where that stops working:
Can it do this?
Fixed-model tools
Dynamic (Compared By)
Compare Actual vs Plan
✓ Yes — the intended use
✓ Yes
Compare Category (Consulting vs Hardware)
✗ No — not a scenario role
✓ Yes, zero setup
Add a new scenario (Forecast v2)
⚠ New measure / remap
✓ New value in the field
Here's what the dynamic side of that table looks like in practice — the same visual, on two different kinds of "Compared By" field:
Example 1 — Category, zero setup
Base Field:Consulting ▾Measured Fields:Hardware ▾
City
Consulting
Hardware
ΔVar
Albany
167.8K
255.6K
+87.8K
Atlanta
165.8K
206.8K
+41.0K
Compared By
✓Category
already a normal column, no prep
Example 2 — Actual vs Plan, needs Step 2 first
Base Field:Actual ▾Measured Fields:Plan ▾
Region
Actual
Plan
ΔVar
Northeast
470.6K
466.3K
-4.4K
South
493.8K
500.7K
+6.9K
Compared By
✓Scenario
built in Step 2
Flexa note"Compared By" isn't locked to Actual/Plan — it accepts any field with two or more values, so it works immediately on natural columns like Category or Region. The only reason Actual/Plan needs Step 2 first is that those values typically live as separate measures instead of as values in a shared column. Once either type of field is in place, switching what's on the rows (City, Region, Product...) is a normal pivot change, same as any matrix. More on the underlying concept in our Dynamic vs Fixed comparison guide.
5Adding a New Scenario Next Quarter
Say your team adds "Forecast v2" as a new scenario next quarter. Region, Product, and any other breakdown were never the hard part — they're just matrix rows, equally easy to change in any tool. The real difference shows up when the thing being compared changes, not when the breakdown does.
Task
Fixed AC/PL/PY layout
Compare-by structure (this guide)
Swap the row field (Region → Product)
Same effort either way
Same effort either way
Add "Forecast v2" as a new scenario
⚠ Remap measures
✓ New value in the Compared By field
Report maintenance over a year
Grows with every new scenario
Stays close to flat
6Common Mistakes
1
Comparing values that don't share a unit
Variance between electricity spend and marketing spend tells you nothing — only enable variance where the two values represent the same metric at two points, scenarios, or segments.
2
Mismatched grain before comparing
If Actual is daily and Plan is monthly, aggregate to a common grain first — otherwise the "compare-by" join will silently drop or duplicate rows.
3
Forgetting blanks on one side
A region with Actual but no Plan yet (or vice versa) should show as a gap, not a false 100% variance — handle blanks explicitly in your measure.
4
Skipping the model check in Step 1
Building the comparison before confirming your table shape is the most common source of rework — five minutes in model view saves an afternoon of rebuilding.
Build this comparison without the DAX overhead
Flexa Tables adds category-based, multi-dimension variance to any table or matrix in Power BI Service.
For the conceptual difference between fixed and dynamic variance models before you start building, see our Power BI variance analysis guide.
7FAQ
How do I calculate variance when Actual and Plan are in separate Power BI tables?
You have two options: unpivot Actual, Plan, and Prior Year into one long fact table with a shared category column (the simplest, most maintainable path), or keep the tables separate and bridge them at query time using DAX's TREATAS function to create a virtual relationship on matching dimension values.
What is a compare-by column and when do I need one?
A compare-by column is a shared field (like "Scenario" with values Actual, Plan, Forecast) that lets a dynamic variance visual know which values to compare. You need one whenever Actual, Plan, and Prior Year live in separate, unrelated tables rather than already sharing a common dimension.
Does adding a new comparison scenario require rewriting my DAX?
Not if you built the compare-by column approach. Once Actual, Plan, and Forecast share one column, a new scenario like "Forecast v2" is just a new value in that column and a new row in your data load, not a new measure or a new visual.
Is there a way to automate the reshape or unpivot step in Power BI?
The unpivot step itself is a one-time Power Query transformation, not something that needs to run manually each refresh, so it effectively becomes automatic once set up correctly. Power BI's Field Parameters feature can also reduce how often you need this kind of transformation for report-level dimension switching.
When should I not enable variance between two columns in Power BI?
Skip variance when the two values don't share a meaningful unit or business relationship, for example comparing electricity spend to marketing spend. Variance is only informative when the two values represent the same metric at two points, scenarios, or segments.
Does a dynamic variance comparison only work with Actual, Plan, and Forecast?
No. A dynamic "Compared By" field works with any column that has two or more categorical values, such as Product Category or Region, with zero setup. Actual/Plan/Forecast is just the common case that needs a prep step first, because those values are usually modeled as separate measures rather than as values already sitting in a shared column.