
Zebra BI Alternative for Power BI: Honest Comparison for 2026
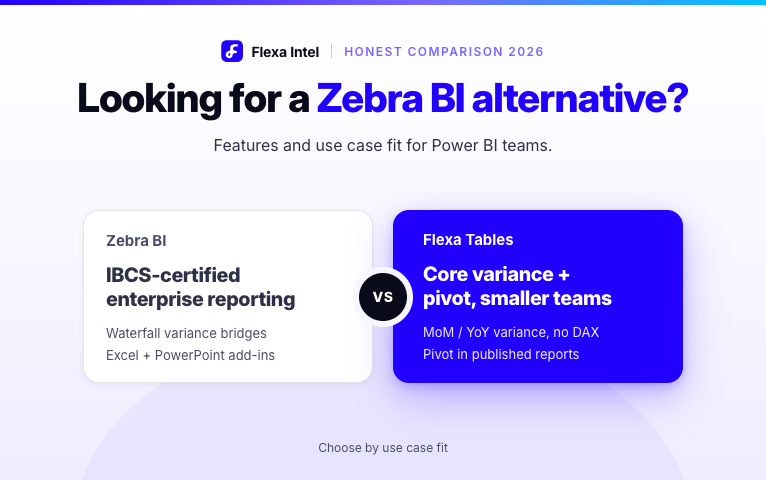
The best Zebra BI alternative for most Power BI teams is Flexa Tables (from $7/user/month for small teams, no minimum user count) — it covers the core Finance use cases of pivot-style table restructuring and MoM/YoY variance without the 10-user minimum and viewer licensing that makes Zebra BI expensive for small teams. If you need IBCS-certified formatting or waterfall charts, Zebra BI remains the market leader with no direct equivalent.
Zebra BI is the market leader for IBCS-certified financial reporting in Power BI — and it deserves that position. The visuals are polished, the variance analysis is deep, and the IBCS compliance is unmatched.
The problem for many teams is not the product. It is the pricing model.
Zebra BI charges every user who views a report — not just the developers who build it. Combined with a 10-user minimum, a 3-person Finance team pays for 10 licenses. Introductory rate: $50/month (year 1, billed annually). Standard rate from year 2: $68/month ($816/year). Independent reviewers note: price your full viewer audience before committing.
This guide maps the honest alternatives — what they cover, what they miss, and which use case each fits.
Real Cost Comparison by Team Size
Flexa Tables tiers: Flash Deal $2.99/user (1 user) · Small Team $7/user (1–10 users) · Medium $6.50/user (10–100 users). First month free. Zebra BI Starter covers 10 users at $50/month year 1, $68/month from year 2.
| Team Size | Flexa Tables | Zebra BI | |
|---|---|---|---|
| 1 user (consultant / individual) | $2.99/month (Flash Deal, 1 user) | $50/month yr 1 (10 users, annual billing) | $95/month |
| 3 users (small Finance team) | $21/month ($7×3) | $50/month (still 10-user min, yr 1) | $285/month |
| 5 users | $35/month ($7×5) | $50/month (still 10-user min, yr 1) | $475/month |
| 10 users | $70/month ($7×10) | $50/month yr 1 → $68/month yr 2+ | $950/month |
| 20 users | $130/month ($6.50×20) | $100+/month yr 1 → $136+/month yr 2+ | $1,900/month |
| Minimum possible cost | $2.99/month (Flash Deal, 1 user) $7/month (Small Team) | $50/month (Starter, 10 users) | $95/month (1 creator) |
The multiplier for small teams: A 3-user Finance team pays 2.4x more for Zebra BI than Flexa Tables in year 1 ($50 vs $21/month), growing to 3.2x from year 2 ($68 vs $21). For a 1-person consultant, the gap is 16.7x in year 1 ($50 vs $2.99 Flash Deal).
Feature Comparison: What Each Visual Actually Does
| Feature | Flexa Tables | Zebra BI | |
|---|---|---|---|
| Core Table & Variance (most common Finance needs) | |||
| Drag-and-drop field restructuring in published report | ✓ Yes | ✓ Yes | |
| MoM / YoY / QoQ / DoD variance (no DAX) | ✓ One click | ✓ Yes | |
| Budget vs Actuals comparison | ✓ Yes | ✓ Yes | |
| Ad hoc period comparison (user selects) | ✓ Yes | ⚡ Limited | |
| Subtotals and row grouping | ✓ Yes | ✓ Yes | |
| Conditional formatting | ✓ Yes | ✓ Advanced | |
| Zebra BI Differentiators (not in alternatives) | |||
| IBCS-certified formatting | ✗ No | ✓ Market leader | |
| IBCS waterfall chart with variance bridges | ✗ No | ✓ Yes | |
| Small multiples | ✗ No | ✓ Yes | |
| Zebra AI (AI-powered dashboard generation) | ✗ No | ✓ Yes (separate product) | |
| Excel + PowerPoint add-in | ✗ No | ✓ Yes | |
| Writeback / data entry in Power BI | ✗ No | ⚡ Commenting only | |
| Scenario planning and forecasting | ✗ No | ✗ No | |
| Pricing & Access | |||
| Starting price | $7/user/month (1–10 users) Flash Deal: $2.99 for 1 user | $50/month yr 1 → $68/month yr 2+ (Starter, 10 users) | $95/creator/month |
| Minimum user requirement | None | 10 users | |
| Viewer licensing | $7/user (Small Team) | Every viewer needs license | |
| Annual commitment required | No — monthly available | Yes | |
| Microsoft-certified | ✓ Yes | ✓ Yes | |
When to Use Each Option
Core variance + pivot, smaller team
- Team is under 20 users
- Primary need: MoM/YoY variance and pivot restructuring
- IBCS compliance is not a requirement
- Budget is a constraint
- BI consultant building for clients
- Monthly flexibility preferred over annual lock-in
- Want to try before committing to enterprise contract
IBCS-certified enterprise reporting
- Organization mandates IBCS reporting standards
- Board packs require consistent waterfall + variance notation
- Team is 20+ users (per-user cost becomes competitive)
- Need Excel and PowerPoint add-ins in same license
- Zebra AI is part of the analytics workflow
- Annual contract is acceptable
Enterprise planning + writeback
If you need data entry, scenario planning, or writeback in Power BI — Inforiver serves a different use case entirely. It is not a direct Zebra BI or Flexa Tables alternative; it is an enterprise planning tool that happens to include table visuals.
Simple display, no self-service needed
- Report is purely for display — no Finance interactivity
- Layout never changes after publishing
- No variance columns needed
- Budget for custom visuals is zero
What Zebra BI Does That Alternatives Cannot Replace
This guide is honest: there are things Zebra BI does that Flexa Tables does not — and if you need them, Zebra BI remains the right choice regardless of price.
IBCS certification — no equivalent exists
IBCS (International Business Communication Standards) is a standardized notation system for financial charts and tables — specific rules for how variances are displayed, how axes are labeled, and how comparisons are formatted. Zebra BI Tables and Charts are widely regarded as the reference implementation of IBCS-style variance reporting in Power BI. If your organization's reporting policy or board pack template requires IBCS compliance, Zebra BI is the only Power BI visual with official certification. Flexa Tables does not implement IBCS notation and is not a substitute for this use case.
Waterfall charts with variance bridges
Zebra BI's waterfall charts — showing how individual line items contribute to a total variance — are a distinctive capability for financial storytelling. The bridge format (start → drivers → end) is a staple of CFO-level reporting. Flexa Tables covers tabular variance analysis but does not have waterfall chart functionality.
Consistent formatting across Power BI, Excel, and PowerPoint
Zebra BI offers add-ins for Excel and PowerPoint so that the same IBCS-formatted visuals appear consistently across all three Microsoft applications. For organizations that produce board packs spanning Power BI dashboards, Excel models, and PowerPoint slides, this cross-application consistency is a genuine differentiator with no direct equivalent.
Bottom line: If IBCS compliance, waterfall bridges, or cross-application formatting are requirements — evaluate Zebra BI on its merits and price the full viewer audience carefully before committing. If the core need is self-service variance and pivot at an affordable per-user rate — Flexa Tables covers that use case at a fraction of the cost.
How to Switch from Zebra BI to Flexa Tables
If you are currently on Zebra BI and evaluating a switch, the migration is straightforward for reports primarily using the table and variance features.
- 1
Audit your reports: Identify which reports use Zebra BI Tables vs Zebra BI Charts. Reports using Charts (waterfall, small multiples) cannot be directly migrated — they depend on Zebra BI-specific features. Reports using Tables are good migration candidates.
- 2
Install Flexa Tables from AppSource: Add Flexa Tables to your Power BI Desktop from the AppSource marketplace. The free trial gives full access during evaluation.
- 3
Replace Zebra BI Tables with Flexa Tables: In each report, delete the Zebra BI Table visual and add a Flexa Tables visual in its place. Drag the same fields into the Flexa Tables visual. Reconfigure conditional formatting and column formatting as needed.
- 4
Test variance features: Confirm that MoM, YoY, and Budget vs Actuals variance columns work correctly with your dataset. Flexa Tables uses the existing DAX measures in your model — no new measures needed.
- 5
Publish and validate with Finance users: Publish the updated report and have Finance verify that the self-service features (drag-and-drop, variance columns) work as expected in Power BI Service.
Migration timeline: A single report migration typically takes 1–2 hours including testing. A portfolio of 5–10 reports can be migrated in a day. The main effort is reconfiguring conditional formatting — field mapping is straightforward.
Try Flexa Tables — The Affordable Zebra BI Alternative
The core Finance use cases — pivot-style table restructuring, MoM/YoY variance, period comparison — from $7/user/month for small teams (1–10 users), with no minimum user count and monthly billing available.
- Drag and drop fields in published Power BI reports
- MoM, YoY, QoQ, DoD variance — one click, no DAX
- Compare any two periods Finance selects
- No minimum user count — pay for actual users only
- Monthly billing available — no annual commitment required
- Microsoft-certified, free trial on AppSource
Frequently Asked Questions
What is the best Zebra BI alternative for Power BI?
For teams needing pivot-style tables and MoM/YoY variance without the 10-user minimum: Flexa Tables from $7/user/month for small teams. For IBCS-certified reporting at enterprise scale: Zebra BI remains the market leader.
Is there a cheaper alternative to Zebra BI for Power BI?
Yes — Flexa Tables at $7/user/month for small teams (no minimum). A 3-user Finance team pays $21/month ($7×3) vs $50/month minimum for Zebra BI in year 1 (2.4x difference), growing to 3.2x from year 2 ($68/month standard).
Does Flexa Tables do the same thing as Zebra BI?
Flexa Tables covers the core Finance use cases: drag-and-drop table restructuring, MoM/YoY/Budget vs Actuals variance without DAX, and ad hoc period comparison. Zebra BI adds IBCS certification, waterfall charts, small multiples, and Excel/PowerPoint add-ins. Flexa Tables is not a full replacement for IBCS-compliant enterprise reporting — it is the best alternative when the core need is affordable variance analysis without the enterprise pricing model.
Why is Zebra BI expensive for small teams?
Zebra BI charges every viewer (not just developers), with a 10-user minimum. A 3-person Finance team pays for 10 licenses. Introductory rate $50/month year 1 (billed annually, covers 10 users). Standard rate from year 2: $68/month ($816/year). For large teams where cost is spread across many users, this is manageable — for small teams, it is disproportionate.
What does Zebra BI do that alternatives cannot?
IBCS-certified formatting (the only certified option), IBCS waterfall charts with variance bridges, small multiples, Zebra AI, and consistent formatting across Excel and PowerPoint. If these are requirements, Zebra BI has no direct equivalent.
Can I switch from Zebra BI to Flexa Tables?
Yes — for reports using Zebra BI Tables (not Charts). Migration involves replacing the visual in Desktop and reconfiguring field mappings. Reports using Zebra BI's waterfall or small multiples features would need redesigning. A single report migration typically takes 1–2 hours.


