
Power BI Custom Visuals for Small Business: What's Worth Adding (2026)
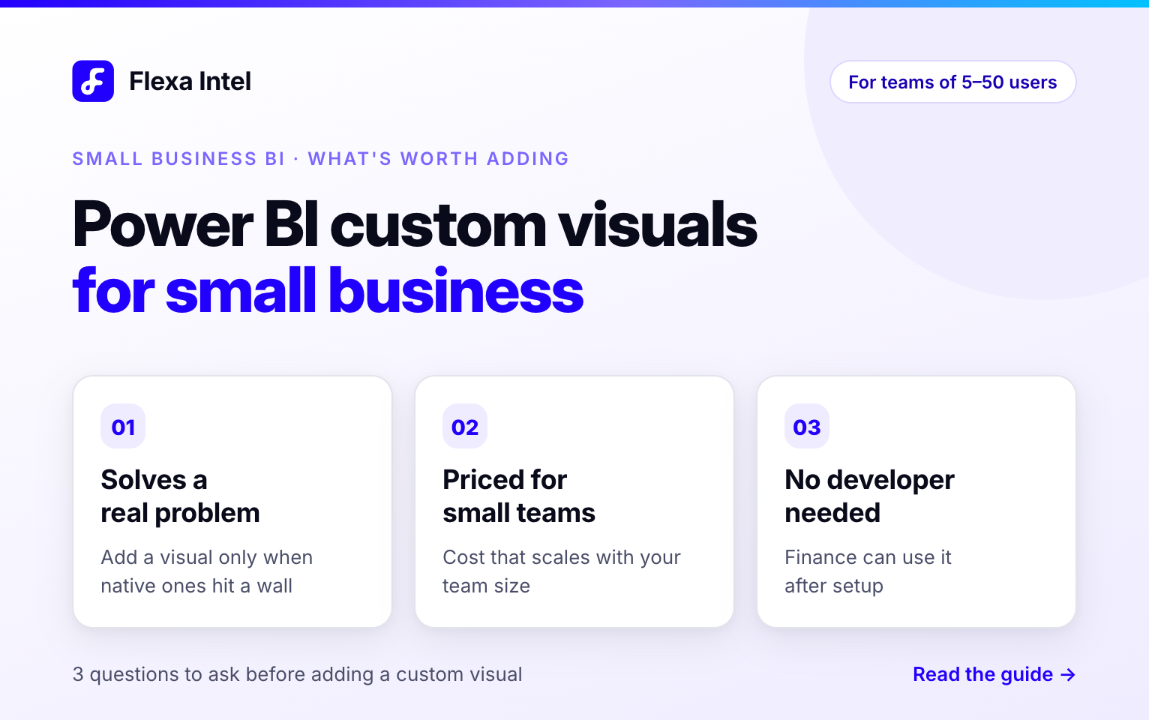
Most Power BI custom visuals are built and priced for enterprise teams of 50–500 users. Small businesses and SMB Finance teams (5–20 users) need a different evaluation framework: does it solve a real problem, does it cost proportionally to our team size, and can Finance use it without a developer after setup? By that measure, most custom visuals fail. Flexa Tables — from $7/user/month for small teams, no minimum user count, self-service variance and pivot — is the exception built for teams your size.
Small business Power BI users face a specific problem: most of the content, tutorials, and tool recommendations are written for enterprise teams. The custom visual market is dominated by products with 10-user minimums, annual contracts, and feature sets built for companies with dedicated BI teams and IBCS compliance mandates.
If you're a 10-person company where the Finance Manager is also the person who built the Power BI report, this guide is for you.
The Real Cost of Power BI for a Small Business Team
Independent research from Forrester found organizations using Power BI achieved 366% ROI over three years, and for SMBs specifically, that value tends to show up faster because their data environments are simpler and easier to stand up. The question is not whether Power BI is worth it for small businesses — it almost always is. The question is what to add to it.
Compare that to the cost of a single developer hour ($75–150 typically) spent making layout changes that Finance requested. At $105/month, the entire self-service stack costs less than two developer hours per month — and eliminates most routine change requests entirely.
SMB vs Enterprise: Different Needs, Different Stack
| Dimension | SMB (5–50 users) | Enterprise (50–500+ users) |
|---|---|---|
| BI team size | 1 developer or part-time | Dedicated BI team of 3–20 |
| Who builds reports | Finance Manager or owner | BI developer or analyst team |
| Reporting standard | Practical — does it answer the question? | IBCS, board formatting standards |
| Custom visual budget | $0–50/month total | $500–5,000+/month acceptable |
| Key self-service need | Finance adds variance without developer | IBCS compliance, writeback, planning |
| Biggest pain point | Change requests go to the only developer (who is also doing everything else) | Standardizing reporting across 50+ report authors |
| What breaks first | Developer bottleneck for layout changes | Governance and version control at scale |
Which Custom Visuals Are Worth It for Small Business
Evaluated against three criteria: solves a real SMB problem, priced for small teams, and Finance can use it without a developer.
Flexa Tables pricing: Flash Deal $2.99/user (1 user only) · Small Team $7/user (1–10 users) · Medium Team $6.50/user (10–100 users). First month free on all plans.
Flexa Tables — Self-service variance and pivot
Drag-and-drop table restructuring and MoM/YoY/Budget vs Actuals variance directly in the published report. No DAX required — Finance adds and removes columns themselves.
$7/user/month for small teams (1–10 users), no minimum user count, monthly billing available. Flash Deal: $2.99/month for 1 user. The only custom table visual priced for teams under 20 users. Eliminates the most common developer change requests for Finance.
Deneb — Custom chart types (if you know Vega-Lite)
Free, unlimited custom chart types using the Vega-Lite grammar. The most powerful free custom visual available.
Only worth it if someone on your team is comfortable with JSON/Vega-Lite syntax. If not, skip — the learning curve is steep and native Power BI charts cover 90% of SMB needs.
Charticulator replacement (Deneb) — For unique chart types
If you need a chart type that native Power BI doesn't have (custom waterfall, bump chart, slope graph), Deneb is the free path.
Microsoft retired Charticulator — do not build new reports on it. Deneb is the replacement. Only relevant if you genuinely need a chart type that native visuals can't produce.
Zebra BI — IBCS-certified enterprise financial reporting
The market leader for IBCS-compliant financial reporting, with waterfall charts, small multiples, and Excel/PowerPoint add-ins.
10-user minimum, annual contract, $50/month introductory rate growing to $68/month standard. For a 3-person Finance team, you pay for 10 licenses. The IBCS certification is valuable at enterprise scale — for SMB teams where "does it answer the question" is the standard, the price-to-value ratio is poor.
Inforiver — Enterprise planning and writeback
Full-featured enterprise planning tool with writeback, scenario planning, and advanced formatting.
$95/creator/month minimum. Designed for enterprise Finance teams running budgeting cycles across multiple departments. Overkill for SMB reporting needs — and significantly more expensive than alternatives.
Most AppSource visuals — Abandoned or thin wrappers
AppSource lists hundreds of custom visuals — the majority are outdated, watermarked, or thin wrappers around basic chart libraries.
Check the last update date before installing anything. If a visual hasn't been updated in 12+ months, it may not work with current Power BI versions. Stick to Microsoft-certified visuals for production reports.
Real SMB Use Cases — Who Uses What
Finance Manager building reports alone
Connects QuickBooks + CRM data in Power BI. Needs MoM revenue and gross margin variance for the weekly leadership meeting. No BI developer — Finance Manager does everything.
Operations team tracking project profitability
Project Manager needs to see budget vs actuals by project and by month, restructured differently for different client conversations. No BI team.
Building Finance reports for multiple small clients
Needs a custom visual that adds value to every Finance client engagement, works on small teams without minimum user requirements, and doesn't require enterprise contract approval.
Operations and Finance both need reports
Operations tracks production variance (actual vs target output by line). Finance tracks budget vs actuals by cost center. Two different teams, same tool.
Setting Up Power BI for a Small Business — The Practical Stack
- 1
Start with Power BI Pro licenses for report builders only. Not everyone needs Pro — only users who create or publish reports. Viewers in Premium workspaces can access for free. For a 3-person Finance team where 1 person builds and 2 just view, you may only need 1 Pro license initially.
- 2
Connect to your existing data first. Excel, SharePoint, QuickBooks, Xero, and most cloud accounting tools have direct Power BI connectors. Start with one data source, build one report, publish it, and see how your team uses it before adding more complexity.
- 3
Use native visuals for 90% of your report. Charts, cards, slicers, and the native Matrix cover most SMB reporting needs. Do not add custom visuals just because they exist — add them when you hit a specific wall that native visuals can't solve.
- 4
Add Flexa Tables when Finance needs variance and pivot self-service. Install from AppSource, add to the report, publish. Finance then adds their own MoM/YoY/Budget vs Actuals columns and restructures the table layout in Power BI Service without coming back to the developer.
- 5
Configure 2–3 bookmarks for standard views. Identify the views Finance switches between most often (weekly summary, monthly detail, YTD comparison) and save them as bookmarks with a button navigation bar. Eliminates "can you set up this view" requests permanently.
The SMB self-service test: Before your report goes live, ask: "Can Finance add a variance column themselves? Can they restructure the table without calling me?" If the answer is no to both, add Flexa Tables before publishing — it takes 10 minutes and eliminates the most predictable post-delivery requests.
AppSource admin setting to check: Some Microsoft 365 tenants have custom visuals disabled by default for security. Before your first custom visual install, go to the Power BI admin portal → Tenant settings → Custom visuals → and confirm "Allow custom visuals" is enabled. This is a 5-minute IT check that prevents a frustrating "visual won't install" situation later.
The Custom Table Visual Built for Teams Your Size
Flexa Tables is the only custom Power BI table visual without a minimum user requirement — designed and priced for small business Finance teams, not enterprise BI departments.
- From $7/user/month (Small Team) · Flash Deal $2.99 for 1 user · No minimum user count
- Monthly billing — no annual contract required
- MoM, YoY, Budget vs Actuals variance — one click, no DAX
- Drag and drop table restructuring in Power BI Service
- Microsoft-certified — passes tenant AppSource review
- Free trial — try before committing any licenses
Frequently Asked Questions
Are Power BI custom visuals worth it for small businesses?
Selectively. Native Power BI covers most needs. The one custom visual that consistently adds value for SMB Finance teams is Flexa Tables — self-service variance analysis and table restructuring without DAX, from $7/user/month for small teams (Flash Deal $2.99 for 1 user) with no minimum user count. Enterprise visuals like Zebra BI and Inforiver are priced and built for organizations much larger than most SMBs.
What Power BI custom visuals does a small business actually need?
Most SMB needs are met with native visuals. The specific gap: variance columns and table restructuring after publishing. Flexa Tables fills this at $7/user/month for small teams — no minimum user count, the only custom table visual priced for teams under 20 users.
Can small businesses use Power BI without an IT department?
Yes — Power BI is designed for business users. Finance teams can connect to Excel, SharePoint, and cloud accounting tools without IT. The common bottleneck is post-publish variance and layout changes. Flexa Tables removes this bottleneck without requiring developer access.
How much does Power BI cost for a small business?
Power BI Pro: $14/user/month. Flexa Tables: $7/user/month (Small Team). A 5-person Finance team with full self-service reporting: approximately $105/month — less than two developer hours per month, and it eliminates most routine change requests.
What is the difference between Power BI for small business vs enterprise?
SMBs need affordable, self-service options without minimum user requirements. Enterprise teams evaluate IBCS compliance, writeback, and planning features. For custom visuals: Flexa Tables for SMB, Zebra BI or Inforiver for enterprise requirements.
Can a small business Finance team use Power BI without a BI developer?
Mostly yes. Native filtering, slicers, and Q&A work without developers. The bottleneck is variance and layout changes post-publish. Flexa Tables removes this — Finance handles variance and restructuring themselves in Power BI Service.


