Flexa Tables vs Zebra BI vs Inforiver
Quick Answer
Flexa Tables is best for mid-market BI teams that need drag-and-drop pivot tables and variance analysis (DoD/MoM/YoY) without writing DAX — starting at $2.99/user/month, enterprise license where only developers need a key. Zebra BI is best for enterprise finance teams that require IBCS-compliant reporting — starting at $68/month for 10 users minimum. Inforiver is best for large enterprises that need write-back, planning, and budgeting inside Power BI — starting at $95/creator/month.
In This Article
If you've ever tried to build a financial report in Power BI, you've hit the same wall: the native Matrix visual looks like a pivot table, but it's locked once published. End users can filter and drill down, but they can't drag fields, add variance columns, or switch comparison periods without going back to Desktop.
That gap is what Flexa Tables, Zebra BI, and Inforiver all claim to fill — but they solve it in very different ways, for very different buyers. This article breaks down the real differences so you can make the right call without a sales call.
Disclosure: This article is published by Flexa Intel, the maker of Flexa Tables. We've done our best to represent Zebra BI and Inforiver accurately. All pricing data is sourced directly from each vendor's public pricing pages as of June 2026.
1. Product Overview
Flexa Tables
Drag-and-drop pivot + variance for mid-market BI teams
- ✓ Pivot tables with post-publish drag-and-drop
- ✓ One-click DoD / MoM / YoY variance — no DAX
- ✓ Enterprise license: only developers need a key
- ✓ Microsoft-certified, free trial on AppSource
- ✓ 5-star rating on AppSource
Zebra BI
IBCS-compliant financial reporting for enterprise finance
- ✓ IBCS-certified charts, tables, and cards
- ✓ Automated variance and ratio calculations
- ✓ Works in Power BI, Excel, and PowerPoint
- ✓ All users (designers + viewers) need a license
- ✓ 4.8 rating on Capterra (330+ reviews)
Inforiver
Full planning + reporting platform for enterprise
- ✓ Write-back and data entry inside Power BI
- ✓ Budgeting, forecasting, and scenario planning
- ✓ 100+ chart types and table formats
- ✓ Named creator licensing, unlimited viewers
- ✓ #1 Power BI AppSource partner (Lumel)
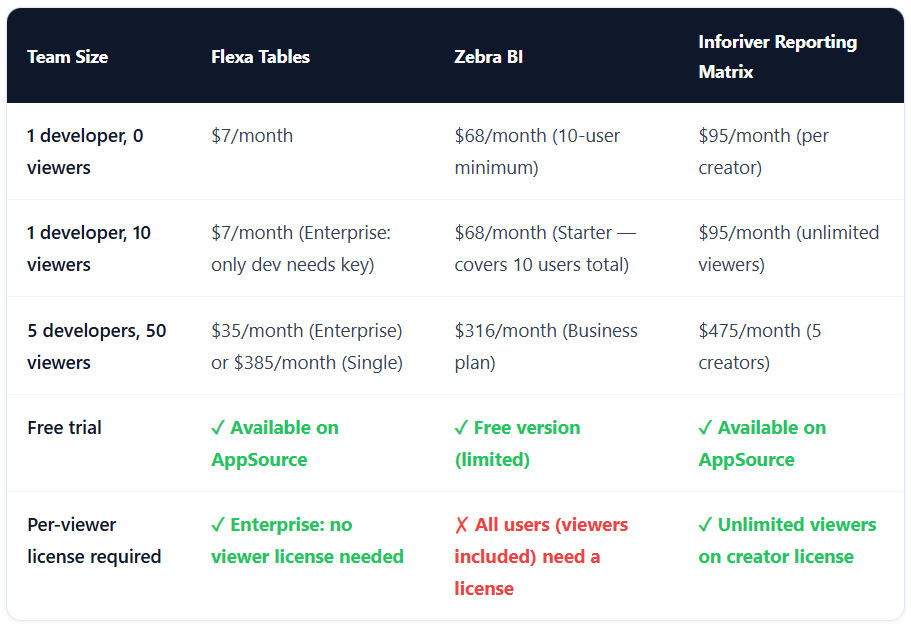
2. Pricing Comparison
Pricing is where the three products diverge most sharply. Here's what you'll actually pay at different team sizes:
| Team Size | Flexa Tables | Zebra BI | Inforiver Reporting Matrix |
|---|---|---|---|
| 1 developer, 0 viewers | $2.99/month | $68/month (10-user minimum) | $95/month (per creator) |
| 1 developer, 10 viewers | $2.99/month (Enterprise: only dev needs key) | $68/month (Starter — covers 10 users total) | $95/month (unlimited viewers) |
| 5 developers, 50 viewers | $15/month (Enterprise) or $164/month (Single) | $316/month (Business plan) | $475/month (5 creators) |
| Free trial | ✓ Available on AppSource | ✓ Free version (limited) | ✓ Available on AppSource |
| Per-viewer license required | ✓ Enterprise: no viewer license needed | ✗ All users (viewers included) need a license | ✓ Unlimited viewers on creator license |
Key pricing insight: Zebra BI's licensing model requires every person who views or interacts with a report to have a license — including passive viewers. For a team where 1 developer builds reports viewed by 50 Finance stakeholders, this changes the math significantly. Flexa Tables' Enterprise license and Inforiver's creator-based model both avoid this problem.
3. Feature Comparison
| Feature | Flexa Tables | Zebra BI | Inforiver |
|---|---|---|---|
| Table & Pivot Features | |||
| Drag-and-drop pivot after publish | ✓ | ✗ | Partial |
| User-restructurable columns in Power BI Service | ✓ | ✗ | Limited |
| Custom row/column sorting by end-users | ✓ | Partial | ✓ |
| Formatted P&L / income statement layout | Partial | ✓ (IBCS) | ✓ |
| Variance Analysis | |||
| DoD / MoM / YoY variance — no DAX | ✓ Built-in buttons | ✓ Automated | ✓ Automated |
| User selects comparison period in published report | ✓ | Partial | ✓ |
| Absolute + % variance in same column | ✓ | ✓ | ✓ |
| Actuals vs Budget vs Forecast | ✓ | ✓ | ✓ |
| IBCS & Standards | |||
| IBCS-certified visuals | ✗ | ✓ (first certified) | ✓ |
| Custom layout flexibility (non-IBCS) | ✓ Full flexibility | Limited by IBCS defaults | ✓ |
| Advanced / Enterprise Features | |||
| Write-back / data entry in Power BI | ✗ | ✗ | ✓ (Premium+) |
| In-cell comments | ✗ | ✓ | ✓ (Premium+) |
| Works in Excel / PowerPoint | ✗ Power BI only | ✓ | Power BI primary |
| Microsoft-certified | ✓ | ✓ | ✓ |
4. Which One Is Right for Your Use Case?
BI Developer building reports for Finance
End users need to explore and restructure reports without IT. → Flexa Tables — pivot restructuring in Service, variance buttons, no viewer licenses needed.
Enterprise Finance team requiring IBCS
Company standard is IBCS compliance and standardized management reports. → Zebra BI — first IBCS-certified visual, automated variance and ratio, Excel/PPT support.
Planning and budgeting inside Power BI
Need write-back, forecast input, or what-if scenarios directly in the report. → Inforiver Premium — the only option with true write-back in Power BI.
Small team (under 20 users), tight budget
Need variance analysis and pivot tables without enterprise pricing. → Flexa Tables — $2.99/user/month, enterprise license available, free trial no credit card.
Replacing Excel variance workbooks alongside Power BI
Finance team keeps a parallel Excel file for variance because Power BI can't do it. → Flexa Tables — built specifically for this use case, DoD/MoM/YoY as one-click buttons.
Multi-platform reporting (Power BI + Excel + PPT)
Reports need to look consistent across Power BI, Excel, and PowerPoint presentations. → Zebra BI — the only option that works natively across all three platforms.
5. Verdict by Team Size & Budget
🏆 Best for Mid-Market BI Teams (5–100 users)
Flexa Tables. For teams that need drag-and-drop pivot flexibility and variance analysis without writing DAX — and without paying enterprise pricing — Flexa Tables is the most cost-effective choice. The Enterprise license model (only developers need a key, viewers do not) means the per-report cost stays flat as your audience grows.
🏆 Best for Enterprise Finance (IBCS Required)
Zebra BI. If your organization has standardized on IBCS reporting or your CFO requires IBCS-compliant charts and tables, Zebra BI is the clear choice. The viewer-licensing model is expensive at scale, but the reporting quality and IBCS automation justify it for large finance teams.
🏆 Best for Planning + Reporting (Write-Back Required)
Inforiver Premium. If you need users to input data, enter forecasts, or run what-if scenarios inside the published report, Inforiver is the only option on this list. It's the most complex and most expensive, but it's in a different category — it's a planning platform, not just a visualization layer.
6. Frequently Asked Questions
What is the difference between Flexa Tables, Zebra BI, and Inforiver?
Flexa Tables focuses on drag-and-drop pivot tables and no-DAX variance analysis for mid-market teams. Zebra BI is built for IBCS-compliant financial reporting for enterprise finance teams. Inforiver is a full planning and reporting platform targeting enterprise use cases including write-back and budgeting. All three are Microsoft-certified custom visuals available on AppSource.
Is Flexa Tables cheaper than Zebra BI?
For most team configurations, yes. Flexa Tables starts at $2.99/user/month with an Enterprise license where only developers need a key (viewers do not). Zebra BI starts at $68/month for a minimum of 10 users, and crucially, both designers and viewers require a license. For a team with 1 developer and 20 viewers, Flexa Tables Enterprise costs $2.99/month vs. Zebra BI at a minimum of $68/month (and potentially much more if those 20 viewers are counted as licensed users).
Does Zebra BI require IBCS compliance?
Zebra BI visuals follow IBCS (International Business Communication Standards) by default. The charts and tables are designed to enforce IBCS conventions automatically. This is a significant advantage for organizations that require standardized financial reporting, but it limits custom layout flexibility for teams that don't need IBCS.
Can Inforiver do write-back in Power BI?
Yes. Inforiver Premium and Enterprise editions support write-back, allowing end users to enter data directly into Power BI reports and have it saved back to the data source. This is a feature neither Flexa Tables nor Zebra BI offers, and it's the primary reason to choose Inforiver for planning and budgeting workflows.
Which Power BI table visual is best for small teams?
For small teams (under 20 users) that need pivot tables and variance analysis without DAX or IBCS requirements, Flexa Tables is the most cost-effective option. The $2.99/user/month Single license and the Enterprise license model (no viewer licenses required) make it significantly cheaper than Zebra BI's 10-user minimum or Inforiver's $95/creator/month pricing.
Can I use Flexa Tables as a Zebra BI alternative?
Flexa Tables is a strong alternative to Zebra BI for teams that don't require IBCS compliance and want drag-and-drop pivot flexibility that Zebra BI doesn't offer. The main gaps: Flexa Tables does not support IBCS-certified charts, in-cell comments, or Excel/PowerPoint integration. If those features are requirements, Zebra BI is the better fit.
Try Flexa Tables Free on AppSource
No credit card required. Install in under 5 minutes. Works with your existing Power BI reports.
Get Free Trial on AppSource →See All Features


