Power BI For Finance Teams
Power BI for Finance Teams: The Practical Guide (2026)
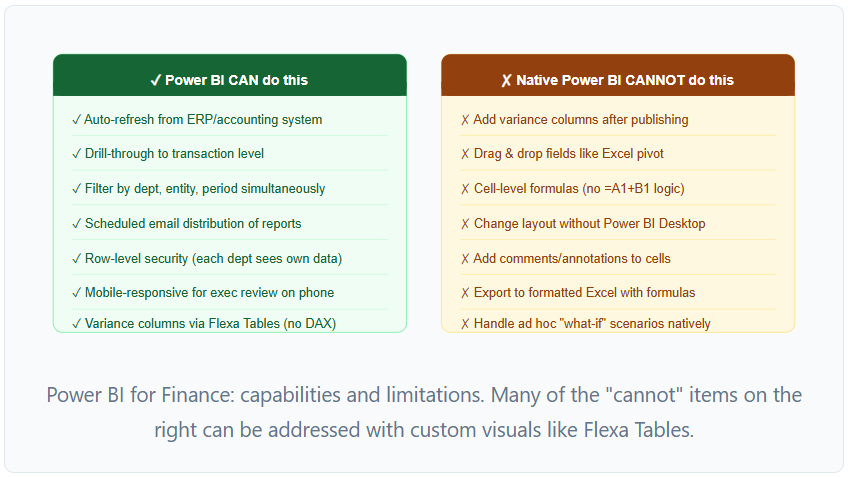
1. What Power BI Can and Can't Do for Finance
Finance teams come to Power BI with a specific problem: the monthly reporting cycle takes too long, relies on fragile Excel files, and produces static outputs that can't answer follow-up questions. Power BI solves most of this — but not all of it, and understanding the limitations upfront saves significant frustration.
The limitations on the right are the most common source of Finance team frustration with Power BI. The good news: most of them are solvable — either through better report design (flexible slicers, drill-through pages) or custom visuals like Flexa Tables that restore self-service capabilities in the published report.
2. Power BI by Finance Role: What Each Person Actually Needs
Not everyone on a Finance team uses Power BI the same way. Understanding what each role needs helps prioritise which reports to build and which capabilities matter most.
- Executive summary dashboard on mobile — 4–6 KPIs at a glance
- One-click drill from headline metric to department breakdown
- Automated email with PDF snapshot of key metrics every Monday
- No interest in DAX or data models — wants answers, not tools
- P&L Matrix with drill-through to journal entry level
- Budget vs actuals by GL account and cost center
- Ability to filter to specific entity or reporting period
- Export to Excel for audit trail (Power BI supports this)
- Row-level security so each controller sees their entity only
- Needs to add variance columns on the fly — MoM, YoY, Actual vs Forecast
- Wants to pivot data by different dimensions without IT involvement
- Builds rolling forecast models in Power BI Desktop
- Biggest pain point: every new variance request requires a Desktop session and republish
- Flexa Tables directly addresses this — variance columns added in Power BI Service, no Desktop
- Simple cost tracking dashboard for their department only
- Budget remaining gauge and top-5 spend categories
- Row-level security so they can't see other departments
- No DAX knowledge — needs zero-learning-curve interface
3. Which Reports to Build First
Finance teams that try to build everything at once — CFO dashboard, P&L, budget vs actuals, cash flow, departmental reports — typically end up with ten half-built reports that nobody uses. The right sequencing is based on which reports deliver the most value per unit of effort:
| Report | Build order | Why | Effort |
|---|---|---|---|
| Budget vs Actuals | 1st | Highest ROI — replaces most manual Excel work immediately | Medium |
| P&L Income Statement | 2nd | Automates monthly reporting pack — high executive visibility | High (P&L logic is complex) |
| Departmental Cost Tracking | 3rd | Reduces "can you send me my budget numbers" emails significantly | Low (reuses Budget vs Actuals model) |
| CFO Executive Summary | 4th | Pins KPIs from existing reports — no new data model needed | Low (reuses existing reports) |
| Forecast vs Actual | 5th | Adds forward-looking layer to existing budget model | Medium |
| Cash Flow Dashboard | Last | Requires separate treasury data model — standalone effort | High |
4. Connecting Power BI to Your ERP or Accounting System
The data connection is where most Finance teams get stuck. Power BI has built-in connectors for the major ERP and accounting platforms used in mid-market Finance:
| System | Connection method | Recommended approach |
|---|---|---|
| Microsoft Dynamics 365 Finance | Direct connector (Power BI) | Connect via OData feed or Azure SQL — avoid direct D365 connector in production (performance) |
| SAP S/4HANA / SAP BW | SAP HANA connector | Use a staging layer — direct SAP connection is slow for large GL datasets |
| Oracle Financials Cloud | Oracle Database connector | Export to SQL staging table nightly; connect Power BI to staging |
| NetSuite | ODBC / SuiteAnalytics | Export saved searches to CSV or connect via third-party connector (e.g., CData) |
| Xero | Xero connector (Power BI) | Direct connection works well for SMB; consider dataSights for multi-entity Xero consolidation |
| QuickBooks Online | QBO connector (Power BI) | Direct connection for basic GL data; exports for complex reporting |
| Excel / CSV exports | Excel/CSV connector | Put files in SharePoint — use SharePoint connector so Power BI refreshes when file updates |
5. Reducing IT Dependency: Self-Service for Finance Users
The most common complaint from Finance teams six months into a Power BI rollout: "Every time we need a new variance column or a different breakdown, we have to submit a ticket to IT and wait." This is a design problem, not a Power BI limitation — and it's solvable.
Three ways to reduce IT dependency
1. Design reports with Finance's questions baked in. Before building, interview Finance users about the top 10 questions they ask every month. Build slicers, drill-through pages, and Q&A tiles that answer those specific questions without requiring a report change. A report that answers 80% of Finance's questions self-sufficiently is worth more than a perfect report that requires IT for every follow-up.
2. Add self-service variance with Flexa Tables. The single most common Finance request after a report is published is "can you add a variance column?" — MoM, YoY, Actual vs Budget, Actual vs Forecast. Flexa Tables adds these as self-service capabilities in the published report. FP&A analysts select the two periods to compare and the variance column appears instantly — no IT ticket, no Desktop session, no republish.
3. Enable pivot-style restructuring with Flexa Tables. Finance users coming from Excel miss the ability to drag fields to restructure a table. The native Matrix visual locks layout after publishing. Flexa Tables restores drag-and-drop pivot flexibility in Power BI Service — Finance can switch from "GL Account rows" to "Cost Center rows" themselves, without involving IT.
6. A 90-Day Power BI Rollout Roadmap for Finance
| Phase | Weeks | Deliverable | Who does it |
|---|---|---|---|
| Phase 1 — Foundation | 1–3 | Data model: FactFinancials with Scenario column, DimDate, DimGLAccount, DimCostCenter. Connect to ERP export (Excel/CSV or direct). Validate data — row counts match GL trial balance. | BI Developer or Finance Analyst with Power BI Desktop |
| Phase 2 — Core Reports | 4–7 | Budget vs Actuals report (3 pages: overview, GL detail, waterfall). P&L Income Statement (2 pages: summary, monthly detail). Install Flexa Tables from AppSource — add to Budget vs Actuals for self-service variance. | BI Developer (report build) + Finance Controller (UAT) |
| Phase 3 — Distribution | 8–10 | Publish to Power BI Service. Configure row-level security (each department head sees own cost center). Set up scheduled refresh (daily or weekly). Configure email subscriptions for CFO and Controller. Train Finance users on slicer usage and Flexa Tables variance. | BI Developer (technical setup) + Finance Manager (user training) |
| Phase 4 — Expand | 11–13 | Departmental Cost Tracking report (reuses Phase 1 data model). CFO Executive Summary dashboard (pins tiles from Phase 2 reports). Forecast vs Actual report (add Forecast scenario to FactFinancials). | BI Developer + FP&A Analyst |
Give Finance teams self-service variance — without rebuilding reports
Flexa Tables lets FP&A and Finance analysts add MoM, YoY, and Actual vs Budget variance columns in published Power BI reports — no DAX, no Desktop, no IT tickets. Microsoft-certified, free trial on AppSource.
Get Free Trial on AppSource →FAQ
Is Power BI good for finance teams?
Yes — particularly for replacing Excel-based P&L packs, automating budget vs actuals reporting, and building CFO dashboards that refresh automatically. The main limitation is that published reports require IT involvement to modify. This is addressed by designing reports with flexible slicers and using custom visuals like Flexa Tables for self-service variance and pivot.
What Power BI reports should a Finance team build first?
Build Budget vs Actuals first — it has the highest ROI, replaces the most manual Excel work, and the data model it creates (single fact table with Scenario column) is reused by every subsequent Finance report. Then P&L Income Statement, then Departmental Cost Tracking, then CFO dashboard.
How do Finance teams use Power BI without knowing DAX?
Start with pre-built PBIX templates that include DAX measures. Use Power Query for data transformation (no DAX required). Use Flexa Tables for variance columns in published reports — no DAX needed. Power BI's built-in Quick Measures handle common calculations like MoM change and YTD totals with point-and-click configuration.
What is the biggest challenge for Finance teams using Power BI?
IT dependency after publishing: Finance users can filter and drill down but can't add variance columns, change layouts, or restructure the report without going back to Power BI Desktop. The solution is better report design (flexible slicers, drill-through pages) plus custom visuals like Flexa Tables that restore self-service capabilities.
How does Power BI connect to ERP systems for Finance reporting?
Power BI has built-in connectors for SAP, Oracle, Dynamics 365, and most major ERPs. For production use, connect to a staging database or data warehouse rather than directly to the ERP — this avoids performance issues and gives Finance a stable data model that doesn't break when the ERP schema changes. For smaller systems (Xero, QuickBooks), direct connectors work well.


