Power BI Actual vs Forecast DAX Dynamic Switching
Power BI Forecast vs Actual: The Complete Guide (2026)
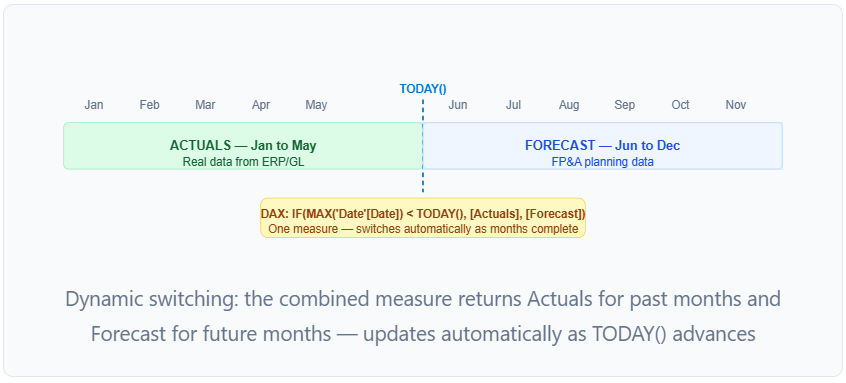
Combined = IF(MAX('Date'[Date]) < TODAY(), [Actuals], [Forecast]). This returns actuals for completed months and forecast for future months — no blank cells, no two separate visuals. For Actual vs Forecast variance without DAX, Flexa Tables adds variance columns directly in the published report.
- Data model: why one table beats two
- Dynamic switching: actuals for past months, forecast for future
- MTD forecast accuracy in Power BI
- Rolling forecast: multiple forecast versions
- Visualising forecast vs actual: combo chart pattern
- No-DAX variance: Flexa Tables for FP&A teams
- 3 common mistakes and fixes
- FAQ
1. Data Model: Why One Table Beats Two
The most common data model mistake for forecast vs actual in Power BI is storing Actuals and Forecast in two separate fact tables (FactActuals and FactForecast) with a shared date dimension. This creates unnecessary complexity:
- You need two sets of relationships — one from each table to DimDate, DimGLAccount, etc.
- Cross-filtering between the two tables requires
USERELATIONSHIPin every measure - When you add a third scenario (Budget, Revised Forecast), you add a third table and double the relationship complexity again
- Granularity differences (daily Actuals vs monthly Forecast) cause row context issues
The correct approach is a single fact table with a Scenario column — the same pattern used for budget vs actuals:
FactFinancials
| Date       | GLAccount | CostCenter | Scenario   | Amount  |
|------------|-----------|------------|------------|---------|
| 2026-01-31 | 4001      | CC-Sales   | Actual     | 125,000 |
| 2026-02-28 | 4001      | CC-Sales   | Actual     | 118,000 |
| 2026-06-30 | 4001      | CC-Sales   | Forecast   | 132,000 |
| 2026-07-31 | 4001      | CC-Sales   | Forecast   | 140,000 |
| 2026-01-31 | 4001 | CC-Sales | Budget | 120,000 |2. Dynamic Switching: Actuals for Past Months, Forecast for Future
The core problem most developers hit: when you display Actuals and Forecast in a Matrix with months in columns, you get two rows of numbers — one for Actuals (blank in future months) and one for Forecast (blank in past months). Finance wants one combined row.
The solution is a single Combined measure that switches based on date:
-- Base measures
Actuals =
CALCULATE(
    SUM(FactFinancials[Amount]),
    FactFinancials[Scenario] = "Actual"
)

Forecast =
CALCULATE(
    SUM(FactFinancials[Amount]),
    FactFinancials[Scenario] = "Forecast"
)

-- Dynamic switching measure
Actuals + Forecast Combined =
VAR _maxDate = MAX('DimDate'[Date])
RETURN
    IF(
        _maxDate < DATE(YEAR(TODAY()), MONTH(TODAY()), 1),
        [Actuals],
        IF(
            _maxDate >= DATE(YEAR(TODAY()), MONTH(TODAY()), 1),
            [Forecast],
            BLANK()
        )
)TODAY() directly as the cutoff. Using IF(MAX('Date'[Date]) < TODAY(), ...) switches mid-month — the current month shows Forecast even when partial Actuals exist. Use the first day of the current month (DATE(YEAR(TODAY()), MONTH(TODAY()), 1)) as the cutoff instead. This way, the current month shows Forecast until it's fully complete, then switches to Actuals on the first day of the next month.
Handling the current month (partial actuals + partial forecast)
For the current month, you often want to show Actuals for days already posted and Forecast for the remaining days. This requires a blended measure:
Current Month Blended =
VAR _today = TODAY()
VAR _currentMonthStart = DATE(YEAR(_today), MONTH(_today), 1)
VAR _isCurrentMonth =
    MAX('DimDate'[Date]) >= _currentMonthStart &&
    MAX('DimDate'[Date]) < DATE(YEAR(_today), MONTH(_today) + 1, 1)
RETURN
    IF(
        _isCurrentMonth,
        [Actuals] + [Forecast Remaining Days],
        IF(MAX('DimDate'[Date]) < _currentMonthStart, [Actuals], [Forecast])
    )
This pattern is complex to maintain as metrics multiply. It's one of the main reasons FP&A teams reach for Flexa Tables — the period switching is handled in the visual without additional DAX.
3. MTD Forecast Accuracy in Power BI
Forecast accuracy measures how close the forecast was to actuals for periods that have both. The standard formula:
Forecast Accuracy % =
VAR _actuals = [Actuals]
VAR _forecast = [Forecast]
RETURN
    IF(
        NOT ISBLANK(_actuals) && NOT ISBLANK(_forecast),
        1 - ABS(DIVIDE(_actuals - _forecast, _actuals)),
        BLANK()
    )
This returns a value between 0 and 1 — format as percentage. 100% = perfect, 0% = forecast was completely wrong. Add to a Matrix with months in columns to track accuracy over time.
MTD forecast accuracy (how accurate this month's forecast is so far)
Forecast Accuracy MTD =
VAR _today = TODAY()
VAR _actualsToDate =
    CALCULATE(
        [Actuals],
        'DimDate'[Date] <= _today
    )
VAR _forecastToDate =
    CALCULATE(
        [Forecast],
        'DimDate'[Date] <= _today
    )
RETURN
    IF(
        NOT ISBLANK(_actualsToDate) && NOT ISBLANK(_forecastToDate),
        1 - ABS(DIVIDE(_actualsToDate - _forecastToDate, _actualsToDate)),
        BLANK()
)4. Rolling Forecast: Multiple Forecast Versions
In rolling forecast environments, FP&A reforecasts monthly or quarterly. Each version is a new snapshot of the full-year expectation. To compare how the forecast has evolved, add a ForecastVersion column to your fact table:
FactFinancials
| Date    | Scenario   | ForecastVersion | Amount  |
|---------|------------|-----------------|---------|
| 2026-06 | Forecast   | Forecast_Jan26  | 130,000 |
| 2026-06 | Forecast   | Forecast_Feb26  | 128,000 |
| 2026-06 | Forecast   | Forecast_Mar26  | 135,000 |
| 2026-06 | Actual     | —               | 127,500 |
Then create measures for each version:
Forecast Jan Version =
CALCULATE([Forecast], FactFinancials[ForecastVersion] = "Forecast_Jan26")

Forecast Feb Version =
CALCULATE([Forecast], FactFinancials[ForecastVersion] = "Forecast_Feb26")

Forecast vs Jan Forecast Variance =
DIVIDE([Actuals] - [Forecast Jan Version], ABS([Forecast Jan Version]))
Add these as columns in a Matrix to see how the forecast evolved — which months were consistently revised up or down, and where Actuals finally landed relative to the earliest forecast.
5. Visualising Forecast vs Actual: Combo Chart Pattern
The combo chart (clustered column + line) is the standard visual for forecast vs actual. Setup in Power BI:
- Column Y-axis:
[Actuals]measure — shows bars only for months with actual data - Line Y-axis:
[Actuals + Forecast Combined]measure — connects past actuals to future forecast seamlessly - Constant line: Add a reference line at the budget target value (Format → Analytics → Constant line)
- Colors: Actuals bars = green (#166534), Forecast line = blue (#0078d4), Budget reference = grey dashed
6. No-DAX Variance: Flexa Tables for FP&A Teams
The DAX patterns above cover the standard forecast vs actual use case. But FP&A teams frequently face requests the original report didn't anticipate:
- "Can you show Actuals vs the January forecast version?" (not the current forecast)
- "Can you add a Forecast vs Budget variance column?"
- "Can you compare this month's forecast to last month's forecast?"
Each of these requires new DAX measures, a Desktop session, and a republish. For Finance teams that can't wait for IT, Flexa Tables (Microsoft AppSource) handles period and scenario comparison directly in the published report — no DAX, no Desktop access.
For teams also needing pivot table flexibility — restructuring the layout by cost center vs by GL account on the fly — Flexa Tables handles both variance and pivot in the same visual.
Add Actual vs Forecast variance without touching DAX
Flexa Tables lets FP&A users add Actual vs Forecast variance columns in the published report — no DAX, no Desktop, no waiting. Switch between forecast versions instantly. Free trial on Microsoft AppSource.
Get Free Trial on AppSource →7. Three Common Mistakes and Fixes
Mistake 1 — Using TODAY() as the cutoff, causing mid-month switching
Symptom: The current month shows Forecast in the matrix even though partial actuals have been posted for the first few days of the month.
Fix: Use DATE(YEAR(TODAY()), MONTH(TODAY()), 1) as the cutoff — switch to Actuals only when the full month is complete.
Mistake 2 — Storing Actuals and Forecast in separate tables
Symptom: DAX measures using USERELATIONSHIP return unexpected results when cross-filtering by department or GL account. Forecast data leaks into Actuals columns or vice versa.
Fix: Combine Actuals and Forecast into a single FactFinancials table with a Scenario column using Power Query Append. All measures then use simple CALCULATE with a Scenario filter — no USERELATIONSHIP needed.
Mistake 3 — Not handling months with both Actuals and Forecast
Symptom: The combined measure double-counts for months where both Actuals and Forecast rows exist (e.g., a month where actuals are partially posted and forecast is still in the table).
Fix: Design your ETL process to remove Forecast rows for months that have been fully actuals-posted. Or add a flag column IsActualised to FactFinancials and filter Forecast to only IsActualised = FALSE:
Forecast (future only) =
CALCULATE(
    SUM(FactFinancials[Amount]),
    FactFinancials[Scenario] = "Forecast",
    FactFinancials[IsActualised] = FALSE
)
FAQ
How do I show actuals and forecast in the same Power BI matrix?
Use a dynamic switching measure: Combined = IF(MAX('Date'[Date]) < DATE(YEAR(TODAY()), MONTH(TODAY()), 1), [Actuals], [Forecast]). This returns Actuals for completed months and Forecast for future months in one combined row — no blank cells, no two separate visuals.
What is the best data model for forecast vs actual in Power BI?
A single fact table with a Scenario column ("Actual", "Forecast", "Budget") joined to shared DimDate and DimGLAccount dimension tables. Avoid separate fact tables for Actuals and Forecast — the cross-table filtering complexity outweighs any perceived benefit. See the budget vs actuals data model guide for the full pattern.
How do I calculate forecast accuracy in Power BI?
Forecast Accuracy % = 1 - ABS(DIVIDE([Actuals] - [Forecast], [Actuals])). Returns 100% for a perfect forecast, 0% for a completely wrong forecast. Add to a Matrix with months in columns to track accuracy over time. Filter to dates where both Actuals and Forecast exist to avoid blank results.
How do I compare multiple forecast versions in Power BI?
Add a ForecastVersion column to your fact table (e.g., "Forecast_Jan26", "Forecast_Feb26"). Create measures for each version using CALCULATE with ForecastVersion filters. Display them side by side in a Matrix to see how the full-year forecast evolved each month.
Can I add forecast vs actual variance without DAX in Power BI?
Yes. Flexa Tables (Microsoft AppSource) lets FP&A users add Actual vs Forecast variance columns directly in the published report — no DAX, no Desktop required. Users select the two scenarios to compare and the variance column (absolute and %) appears instantly.


