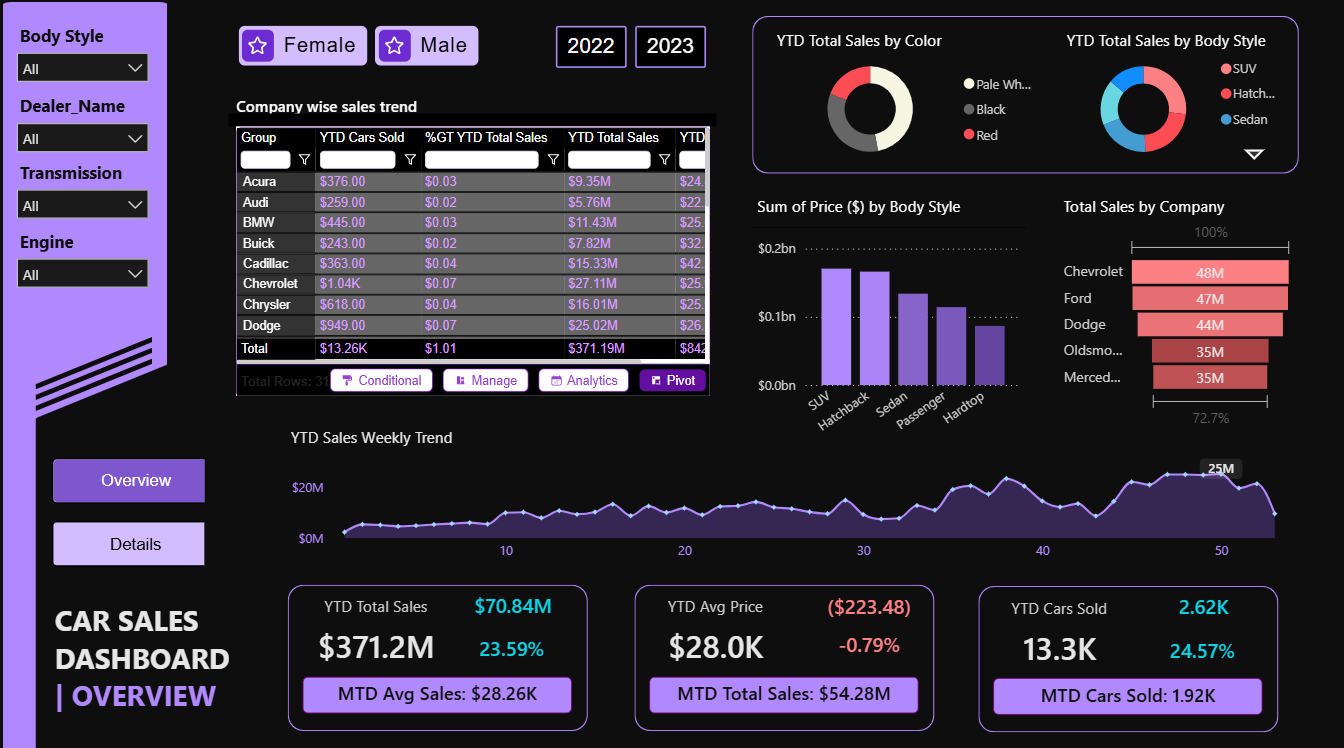
Car Sales Dashboard – Key Insights (YTD 2023)
976 Downloads
Description
Overall Performance (YTD)
- Total Sales Revenue: $371.2M ↑ +23.59% YoY
- Total Cars Sold: 13.3K ↑ +24.57% YoY
- Average Selling Price: $28.0K ↓ –0.79% YoY (slight price erosion despite strong volume growth)
Top Performing Brands (by YTD Cars Sold & Revenue)
| Rank | Brand | Cars Sold | Avg Price | Revenue | % of Total Sales |
| 1 | Chevrolet | 1,043 | $26.0K | $48M | 7.30% |
| 2 | Dodge | 949 | $26.4K | $47M | 6.74% |
| 3 | Ford | 886 | $28.7K | $47M | 6.85% |
| 4 | Volkswagen | 718 | $25.4K | — | 4.91% |
| 5 | Mercedes-Benz | 714 | $26.7K | $35M | 5.13% |
Body Style & Color Preferences
- Dominant Body Style: SUV is by far the most popular, followed by Hatchback and Sedan.
- Top Colors Sold: Pale White, Black, and Red dominate the market.
Sales Trend
- Weekly YTD sales show strong, consistent growth from ~$5M/week to a peak of ~$25M in the final weeks — indicating heavy Q4 seasonality and successful year-end push.
Month-to-Date (MTD) Snapshot
- MTD Total Sales: $54.28M
- MTD Avg Price: $28.26K
- MTD Cars Sold: 1.92K
**Key Takeaways
- Very strong volume-driven growth (+24.6% units, +23.6% revenue) despite a marginal drop in average price.
- Chevrolet, Dodge, and Ford are clear market leaders in unit volume and revenue contribution.
- SUVs continue to dominate buyer preference.
- Heavy Q4 concentration suggests successful promotional/seasonal campaigns at year-end.
Recommendation
Maintain aggressive Q4 momentum, explore mild price increases on high-demand SUVs, and replicate Chevrolet/Dodge playbook across slower brands (Volkswagen, Toyota) to capture more share.
The dashboard is designed using Flexa Design, Flexa Tables, and Flexa Charts from Flexa Intel.
Other Templates
 Free Sales & Revenue
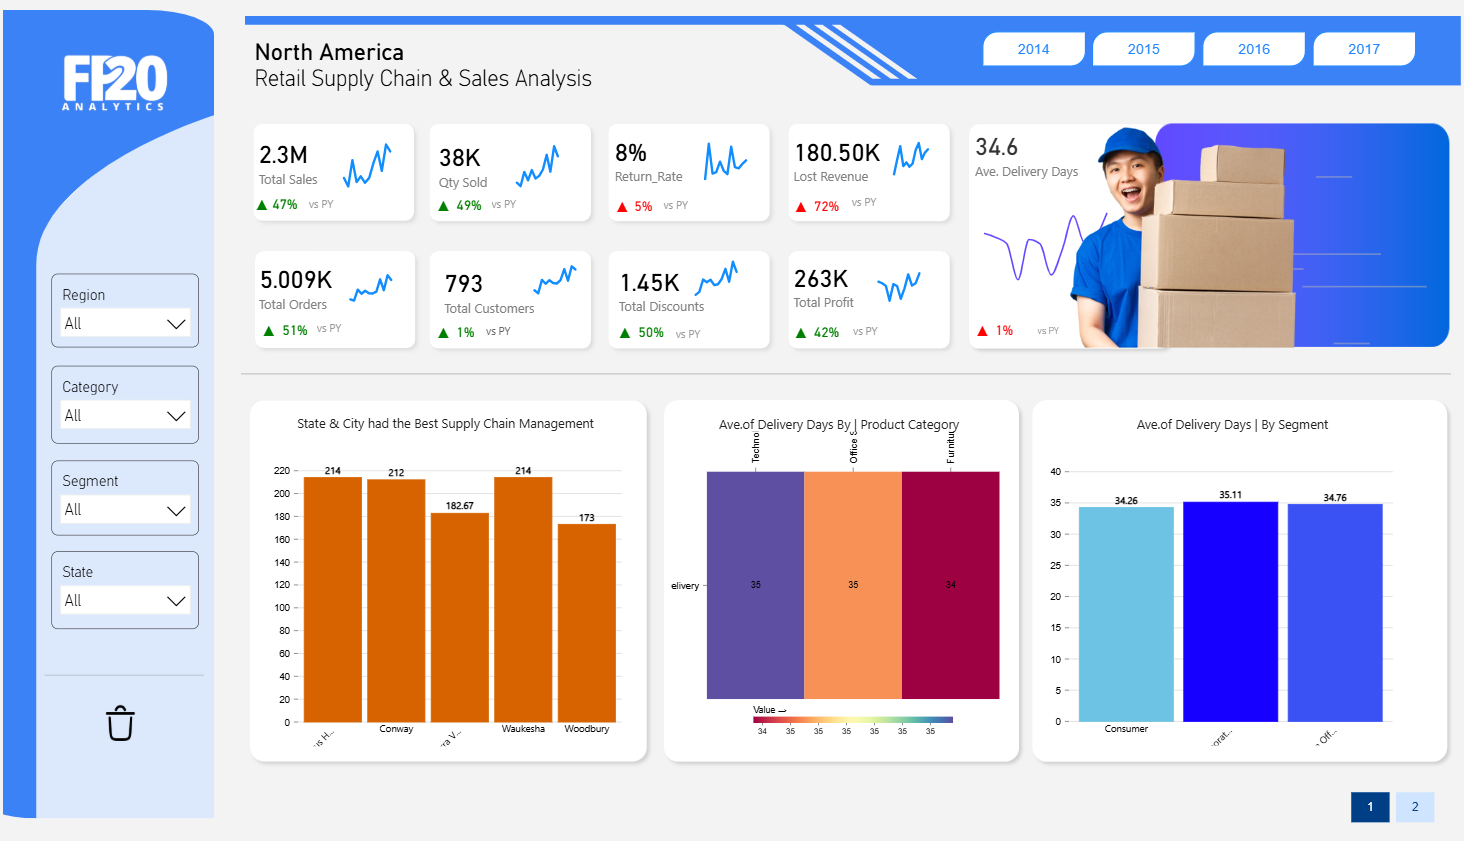
Retail Supply Chain & Sales Analysis dashboard
1.4k
 Free Sales & Revenue
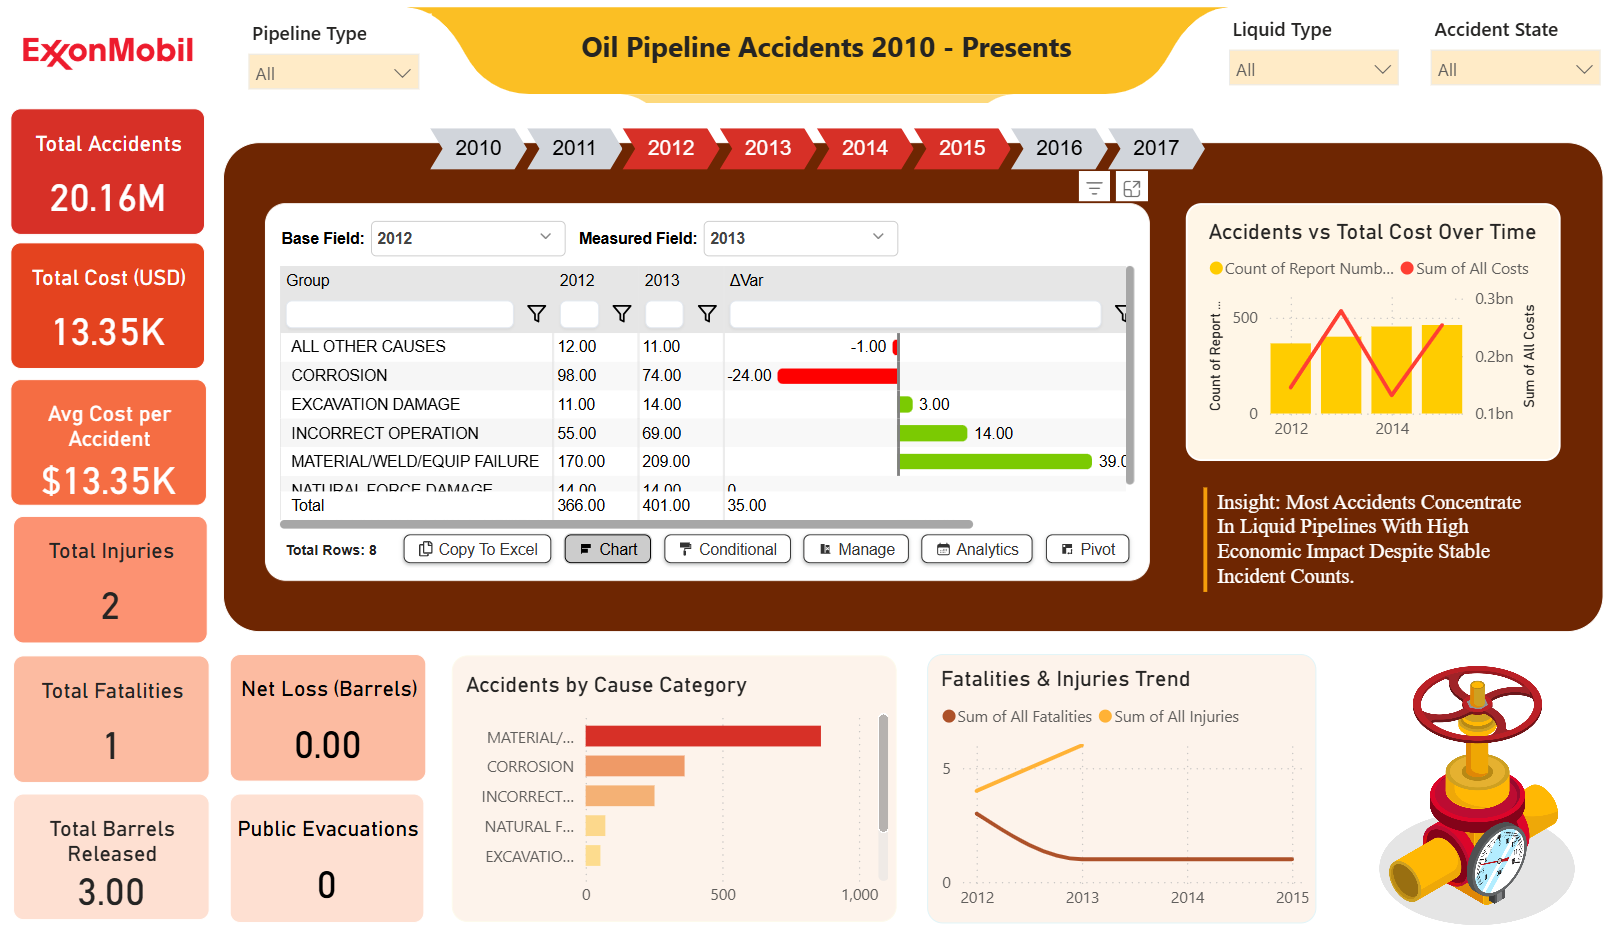
ExxonMobil Oil Pipeline Accidents Dashboard (2010–Present) – Key Insights
921
 Free Sales & Revenue
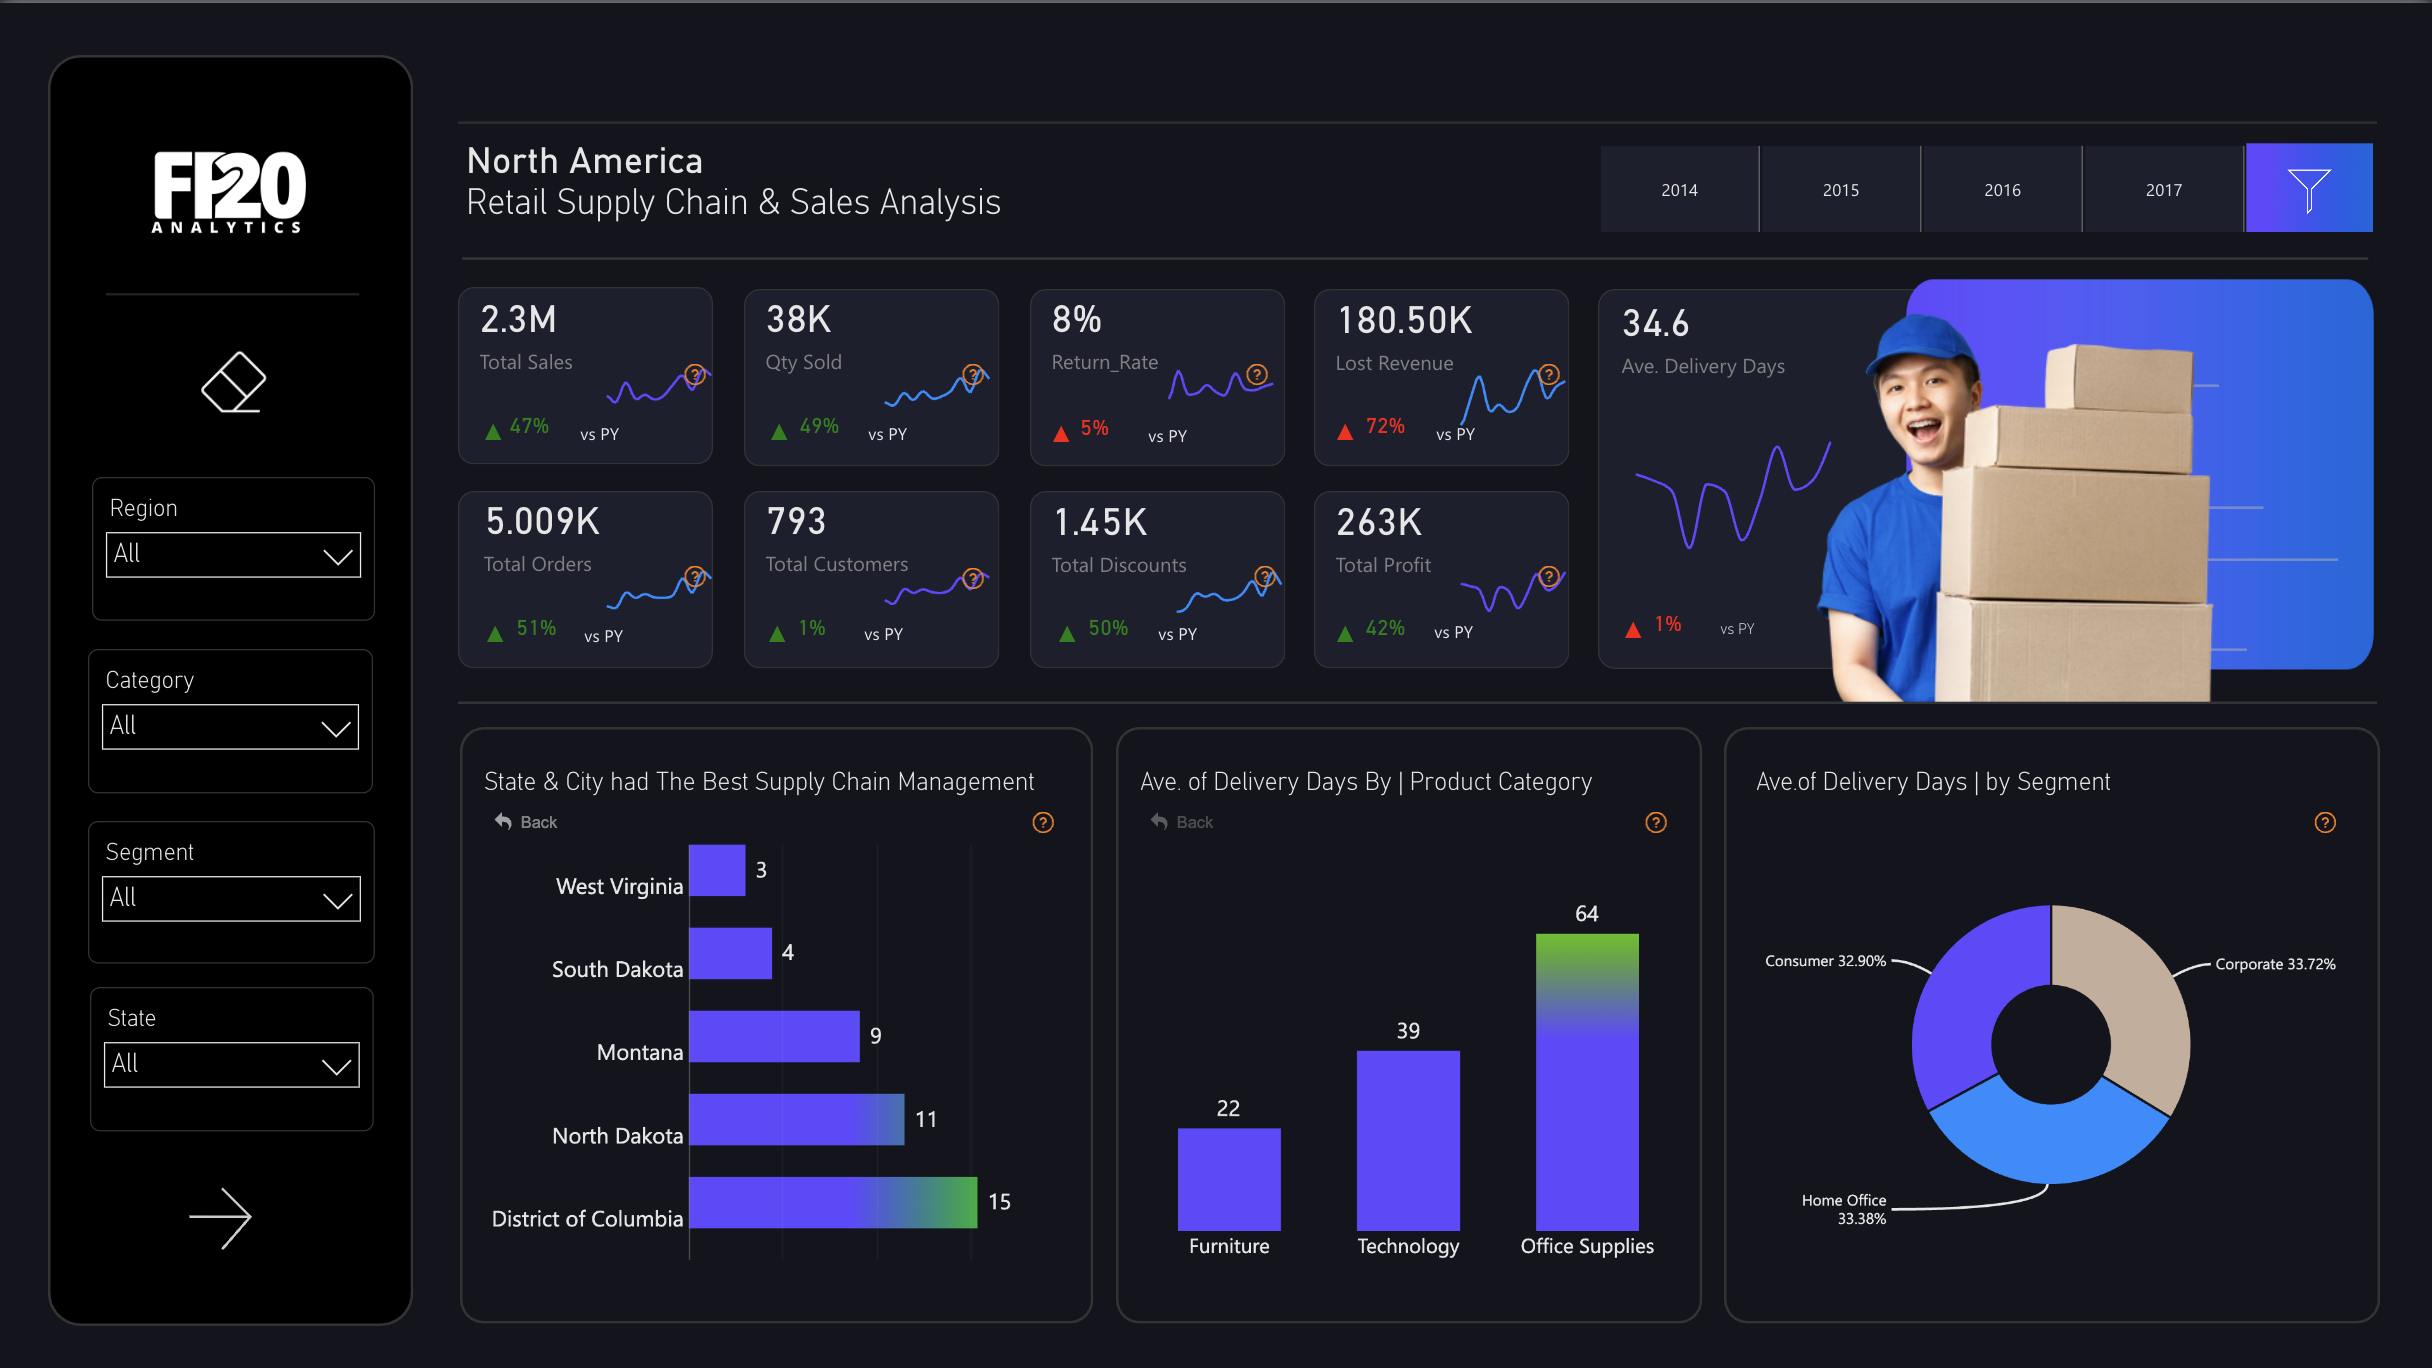
Power BI North America Retail Supply Chain & Sales Analysis Dashboard Template (Free PBIX Download)
81
If you find this website helpful, share it with friends and colleagues to boost their Power BI skills and work efficiency!
Like this site? Share it