
Project Management Dashboard – Schedule, Progress & Performance
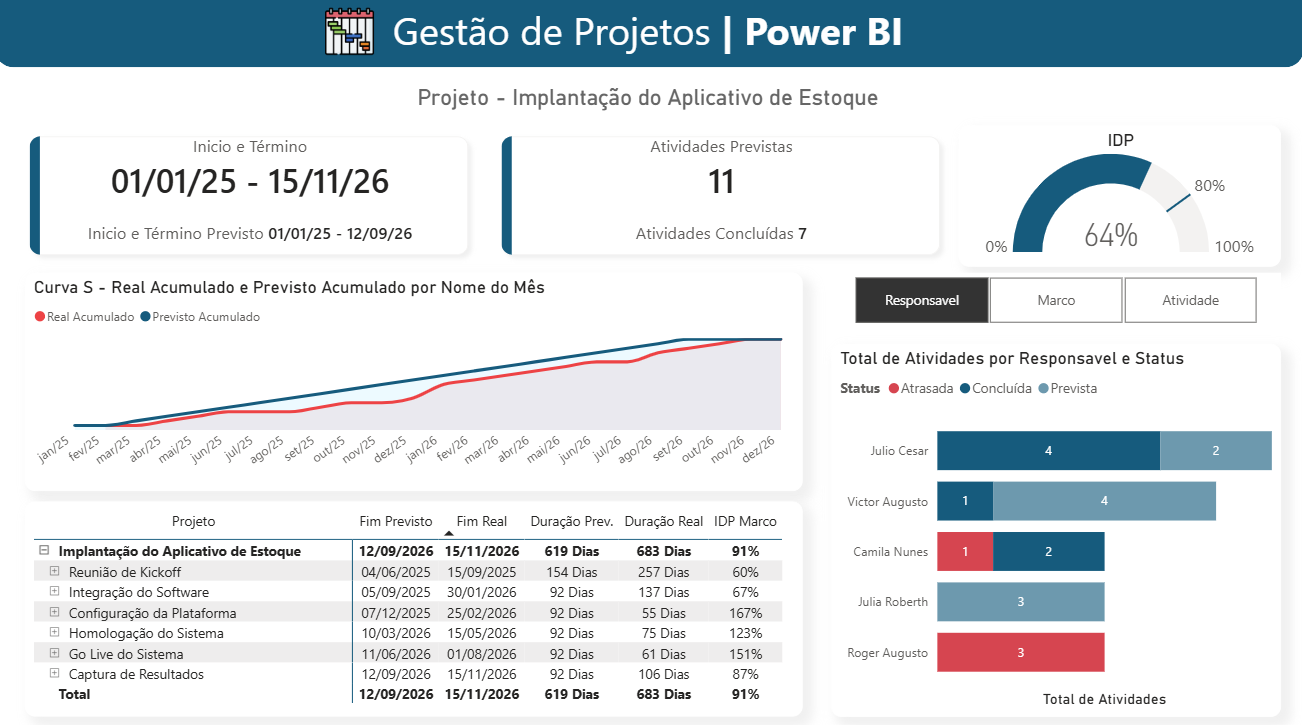
This Power BI Project Management Dashboard provides a complete overview of project progress, schedules and team performance in a clear and interactive format.
Designed for project managers, PMO teams and business leaders, the dashboard makes it easy to monitor planned versus actual performance, identify delayed activities and understand how each team member is contributing to project execution.
Key analyses included:
- Project start and end dates
- Planned and completed activities
- Project Performance Index (IDP)
- Planned vs. actual project progress
- S-Curve analysis
- Planned and actual activity duration
- Planned vs. actual completion dates
- Milestone performance
- Activity status by team member
- Delayed, completed and planned activities
- Detailed project and activity tracking
The dashboard helps project teams quickly identify schedule deviations, delayed tasks and execution risks, enabling better planning and more informed project management decisions.
Ideal for PMO teams, project managers, consultants, engineering companies, IT projects, implementation projects and organizations that need a structured view of project performance.
Other Templates

If you find this website helpful, share it with friends and colleagues to boost their Power BI skills and work efficiency!
Like this site? Share it