
E-Commerce Sales Dashboard – Revenue, Products & Market Analysis
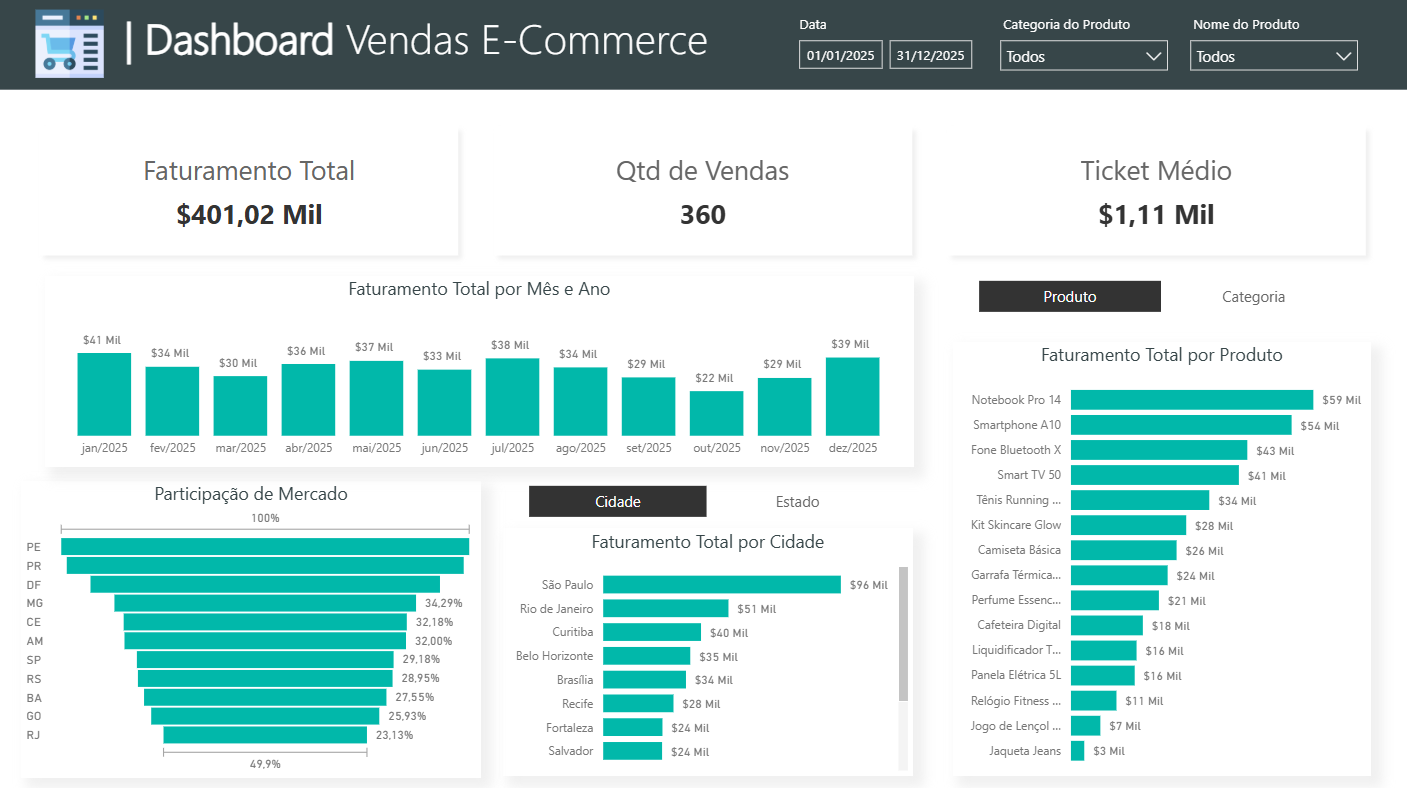
This Power BI E-Commerce Sales Dashboard provides a clear and interactive view of sales performance across products, categories, locations and time periods.
Designed for e-commerce, retail and sales teams, the dashboard helps monitor revenue, understand product performance and identify the markets and locations driving business results.
Key analyses included:
- Total revenue
- Number of sales
- Average order value
- Monthly revenue trends
- Revenue by product
- Revenue by product category
- Top-selling products
- Sales performance by city
- Sales performance by state
- Geographic market participation
- Product and category rankings
- Date, category and product filters
- Interactive sales performance analysis
The dashboard makes it easier to identify top-performing products, monitor sales trends, compare geographic markets and uncover opportunities to increase revenue.
Ideal for e-commerce businesses, online retailers, marketplaces, sales teams and companies looking to monitor commercial performance through Power BI.
Reviews
No reviews yet — be the first to review this template.
Other Templates
If you find this website helpful, share it with friends and colleagues to boost their Power BI skills and work efficiency!
Like this site? Share it