Sales Conversion – Multiple Agents Dashboard
1055 Downloads
Description
Key Insights
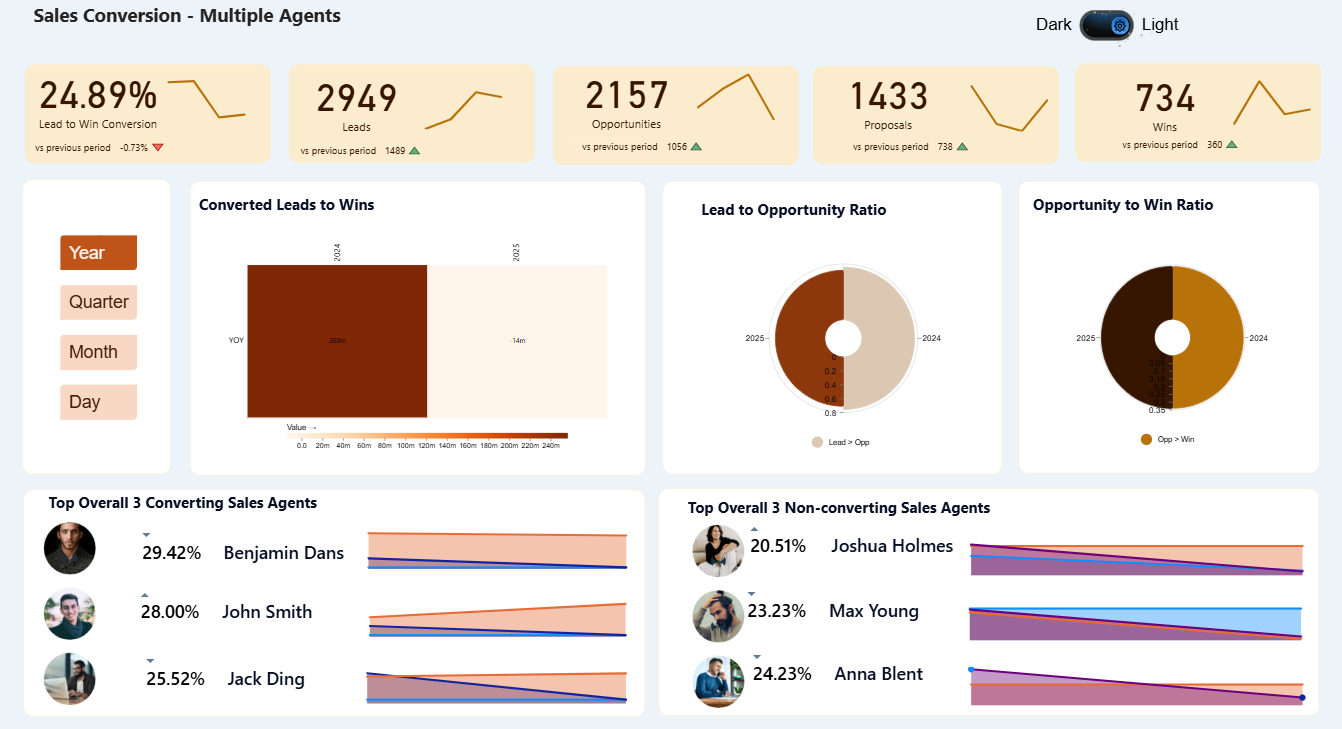
Overall Funnel Performance (vs previous period)
- Lead-to-Win Conversion Rate: 24.89% ↓ (down 0.73% vs previous period)
- Leads: 2949 ↑ (+1489)
- Opportunities: 2157 ↑ (+1056)
- Proposals: 1433 ↑ (+738)
- Wins: 734 ↑ (+360)
→ Significant volume growth across the entire funnel, but the overall conversion rate slightly declined, indicating more leads are entering the pipeline but not all are converting proportionally.
Top Converting Sales Agents (Overall)
- Benjamin Dans – 29.42% conversion
- John Smith – 28.00%
- Jack Ding – 25.52%
Lowest Converting Sales Agents (Overall)
- Joshua Holmes – 20.51%
- Max Young – 23.23%
- Anna Blent – 24.23%
Key Takeaways
- The sales team is generating significantly more leads and opportunities than the previous period.
- While absolute wins are up 96% (+360), the slight drop in overall conversion rate suggests diminishing returns on the additional volume (possible lead quality or capacity issues).
- Clear performance gap: Top 3 agents convert at 25–29%, while the bottom 3 are stuck below 25%.
- Opportunity-to-Win close rate remains solid at ~34%, showing the team is still effective once deals reach the proposal stage.
Recommended Actions
- Investigate lead quality and scoring for the newest influx of leads.
- Share best practices from Benjamin Dans, John Smith, and Jack Ding with underperforming reps.
- Consider targeted coaching or reallocation of high-quality leads to top performers to maximize conversion.
The dashboard is designed using Flexa Design, Flexa Tables, and Flexa Charts from Flexa Intel.
Other Templates
 Free Sales & Revenue
Sales & Revenue Dashboard – Key Insights (Full Year 2022)
1.1k
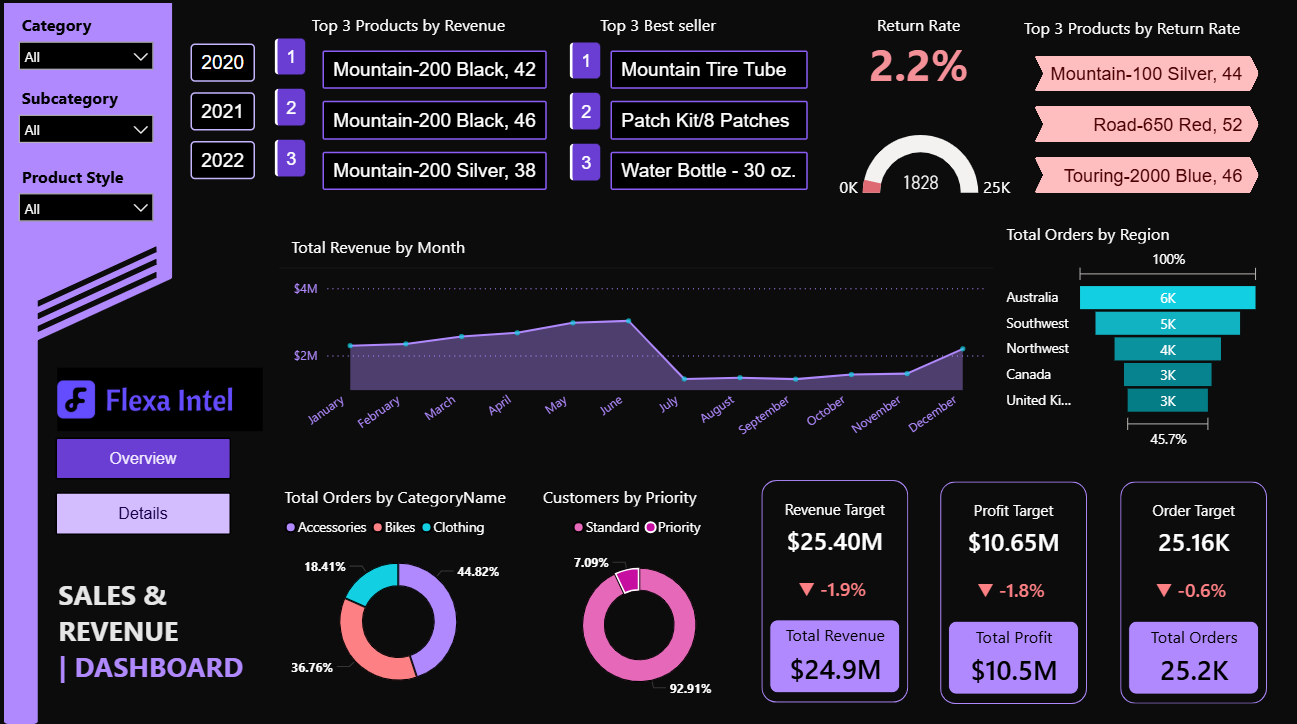
 Free Sales & Revenue
Power BI Sales Dashboard with Variance Analysis — Contoso BI Template (Free PBIX Download)
83
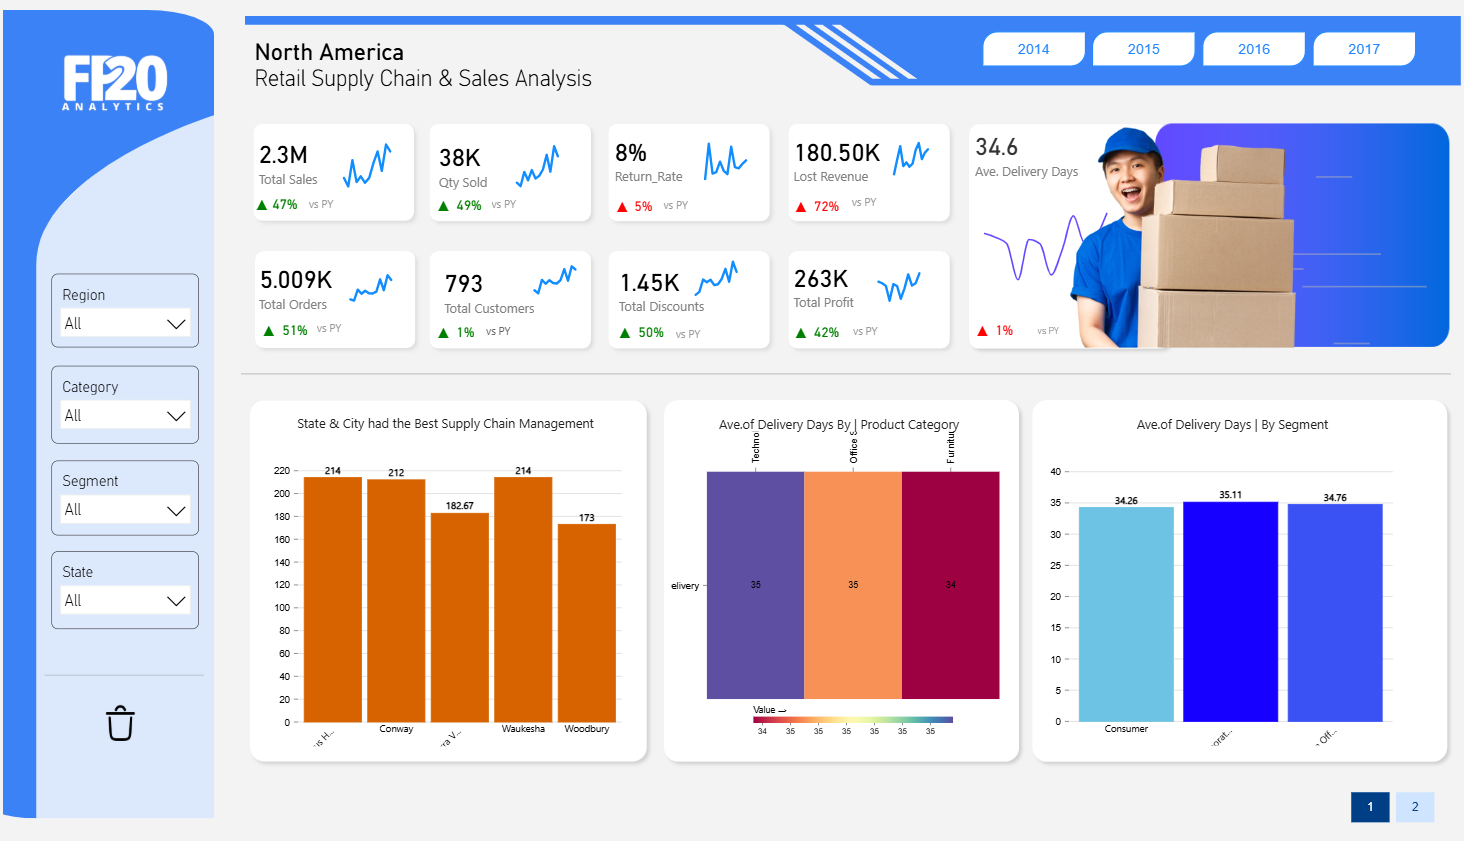 Free Sales & Revenue
Retail Supply Chain & Sales Analysis dashboard
1.4k
If you find this website helpful, share it with friends and colleagues to boost their Power BI skills and work efficiency!
Like this site? Share it