
Car Sales Dashboard – Key Insights (YTD 2023)
992 Downloads
Description
Overall Performance (YTD)
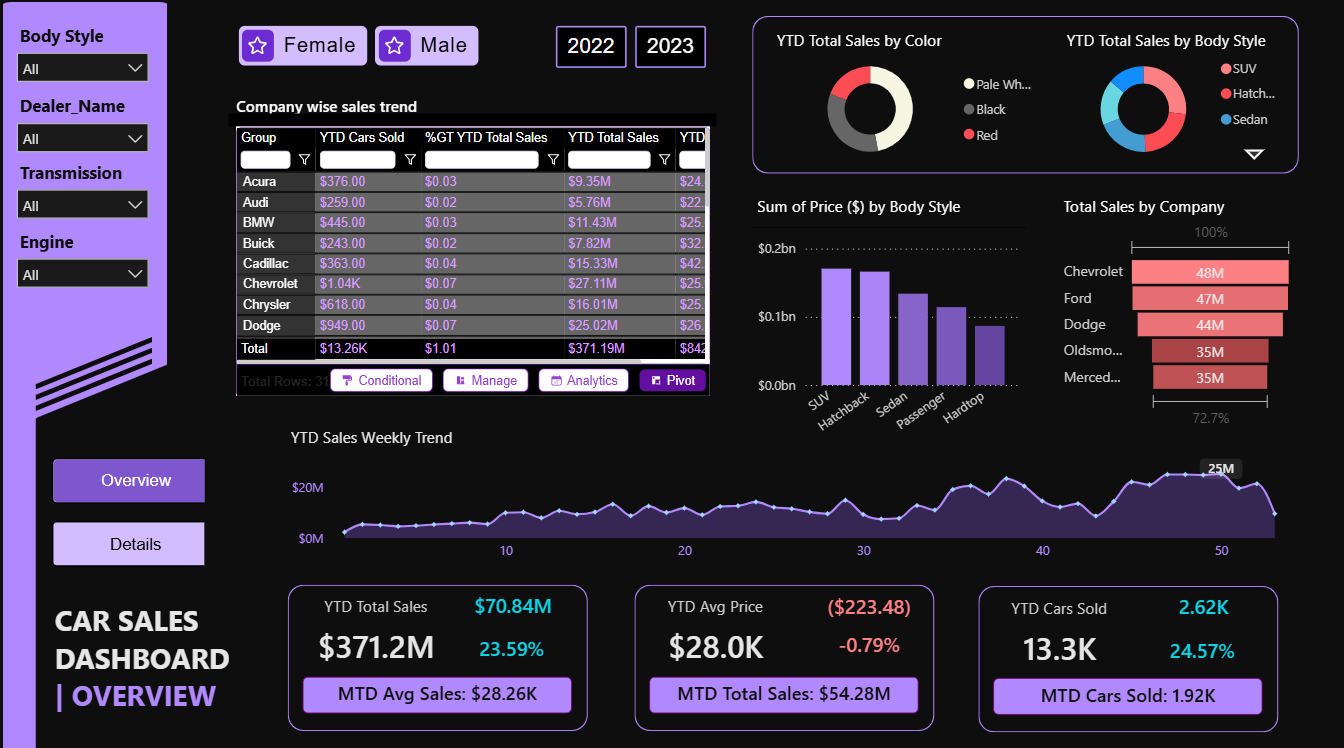
- Total Sales Revenue: $371.2M ↑ +23.59% YoY
- Total Cars Sold: 13.3K ↑ +24.57% YoY
- Average Selling Price: $28.0K ↓ –0.79% YoY (slight price erosion despite strong volume growth)
Top Performing Brands (by YTD Cars Sold & Revenue)
| Rank | Brand | Cars Sold | Avg Price | Revenue | % of Total Sales |
| 1 | Chevrolet | 1,043 | $26.0K | $48M | 7.30% |
| 2 | Dodge | 949 | $26.4K | $47M | 6.74% |
| 3 | Ford | 886 | $28.7K | $47M | 6.85% |
| 4 | Volkswagen | 718 | $25.4K | — | 4.91% |
| 5 | Mercedes-Benz | 714 | $26.7K | $35M | 5.13% |
Body Style & Color Preferences
- Dominant Body Style: SUV is by far the most popular, followed by Hatchback and Sedan.
- Top Colors Sold: Pale White, Black, and Red dominate the market.
Sales Trend
- Weekly YTD sales show strong, consistent growth from ~$5M/week to a peak of ~$25M in the final weeks — indicating heavy Q4 seasonality and successful year-end push.
Month-to-Date (MTD) Snapshot
- MTD Total Sales: $54.28M
- MTD Avg Price: $28.26K
- MTD Cars Sold: 1.92K
**Key Takeaways
- Very strong volume-driven growth (+24.6% units, +23.6% revenue) despite a marginal drop in average price.
- Chevrolet, Dodge, and Ford are clear market leaders in unit volume and revenue contribution.
- SUVs continue to dominate buyer preference.
- Heavy Q4 concentration suggests successful promotional/seasonal campaigns at year-end.
Recommendation
Maintain aggressive Q4 momentum, explore mild price increases on high-demand SUVs, and replicate Chevrolet/Dodge playbook across slower brands (Volkswagen, Toyota) to capture more share.
The dashboard is designed using Flexa Design, Flexa Tables, and Flexa Charts from Flexa Intel.
Reviews
No reviews yet — be the first to review this template.
Other Templates
Free Sales & Revenue
Free Sales & Revenue
If you find this website helpful, share it with friends and colleagues to boost their Power BI skills and work efficiency!
Like this site? Share it