Superstore US Sale Report
1131 Downloads
Description
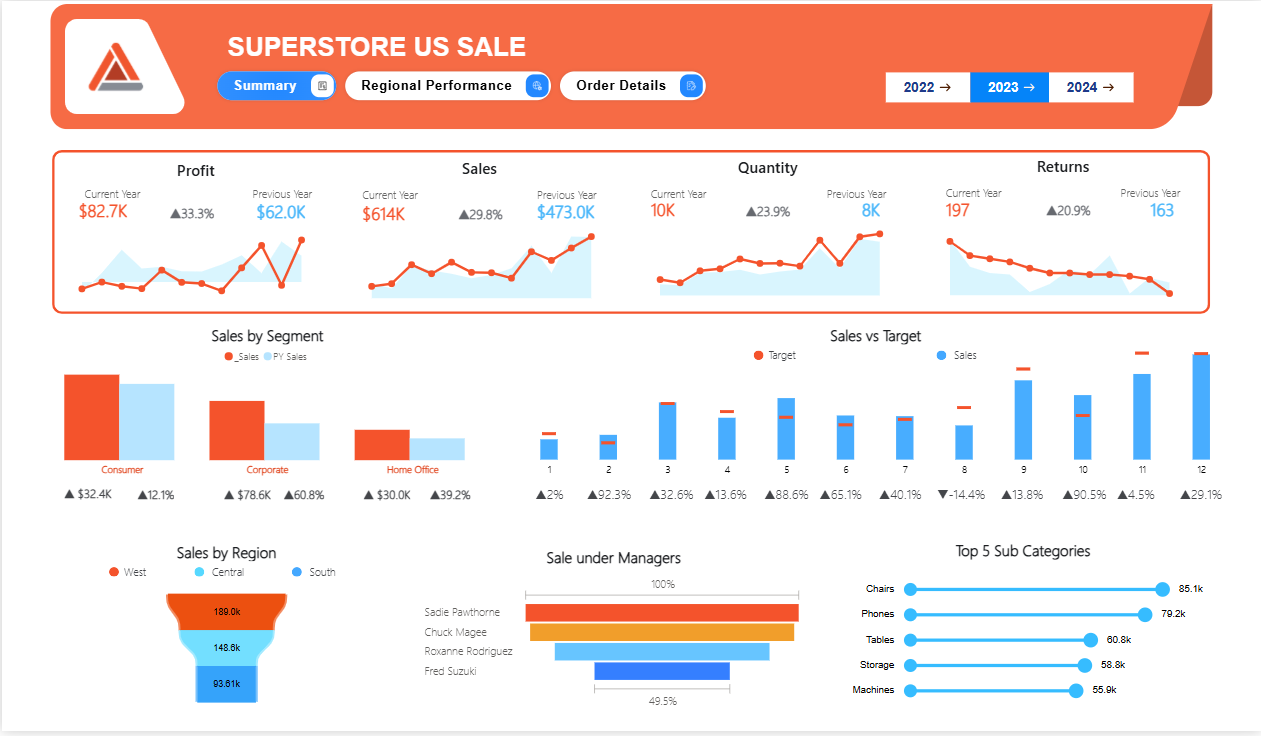
The Superstore US Sale Order Details dashboard for 2023 provides the following insights:
- Profit: $82.7K, up 33.3% from $62.0K last year.
- Sales: $614K, increased by 29.8% from $473.0K.
- Quantity: 10K units, up 23.9% from 8K.
- Returns: 197 units, a 20.9% rise from 163.
- Sales by Segment:
- Consumer: $32.4K (12.1% increase).
- Corporate: $78.6K (60.8% increase).
- Home Office: $30.0K (39.2% increase).
- Sales by Region:
- West: $189.0K.
- Central: $148.6K.
- South: $93.61K.
- Sales under Managers:
- Sadie Pawthorne: 100%.
- Chuck Magee: 96.71%.
- Roxanne Rodriguez: 78.64%.
- Fred Suzuki: 49.5%.
- Top 5 Sub Categories:
- Chairs: 23.4K.
- Phones: 19.9K.
- Tables: 17.5K.
- Storage: 15.1K.
- Machines: 13.9K.
- Sales vs Target: Sales exceeded targets in months 1, 3, 5, 6, 7, 9, 10,12 with the largest overachievement in month 10 (271%) and underachievement in month 2 (-55.9%).
The dashboard is designed using Flexa Design, Flexa Tables, and Flexa Charts from Flexa Intel.
Other Templates
 Free Sales & Revenue
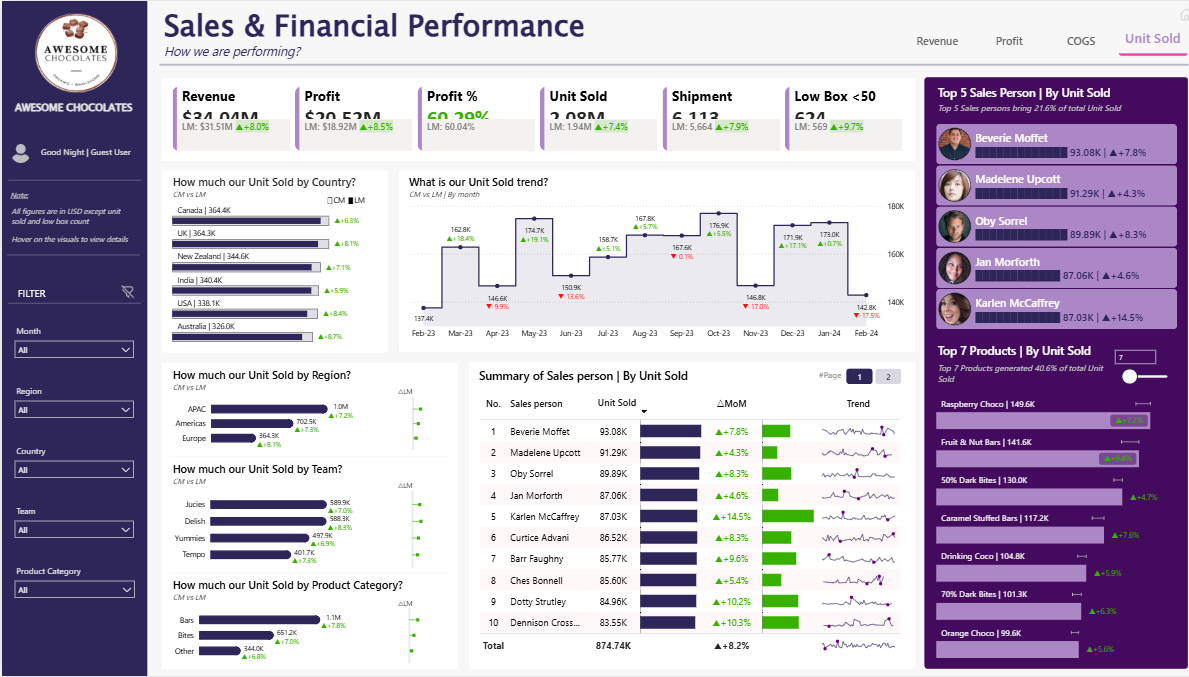
Power BI Sales & Financial Performance Dashboard Template — FMCG Retail Analytics (Free PBIX Download)
100
 Free Sales & Revenue
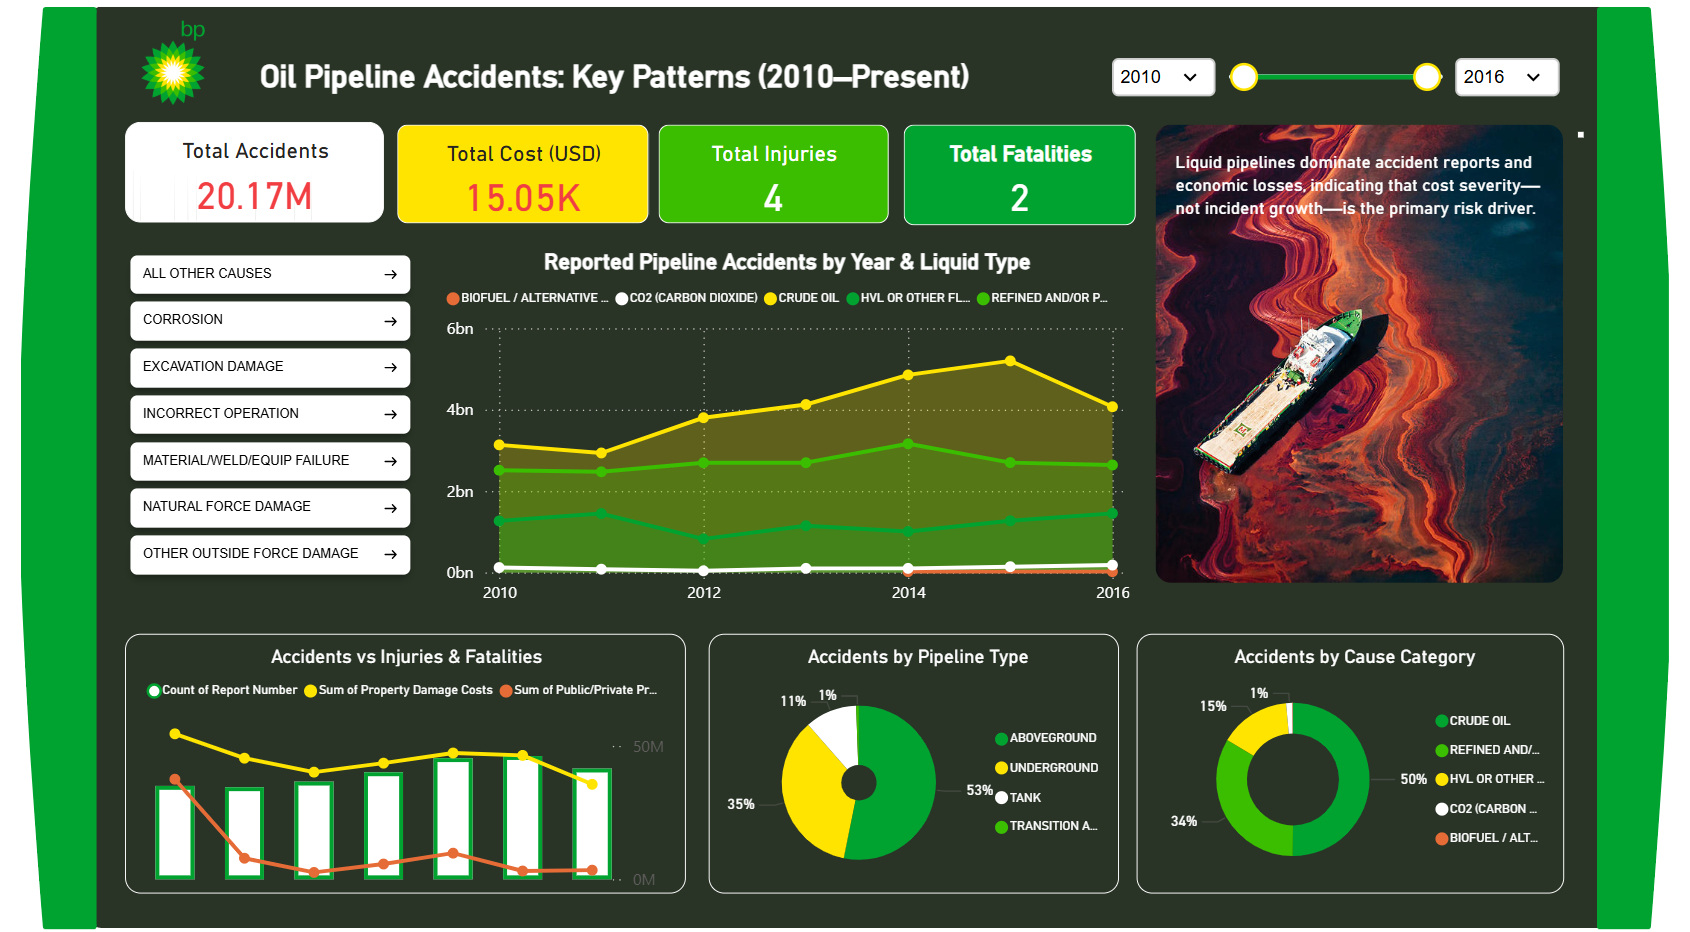
BP Oil Pipeline Accidents: Key Patterns (2010–Present) – Key Insights
866
 Free Sales & Revenue
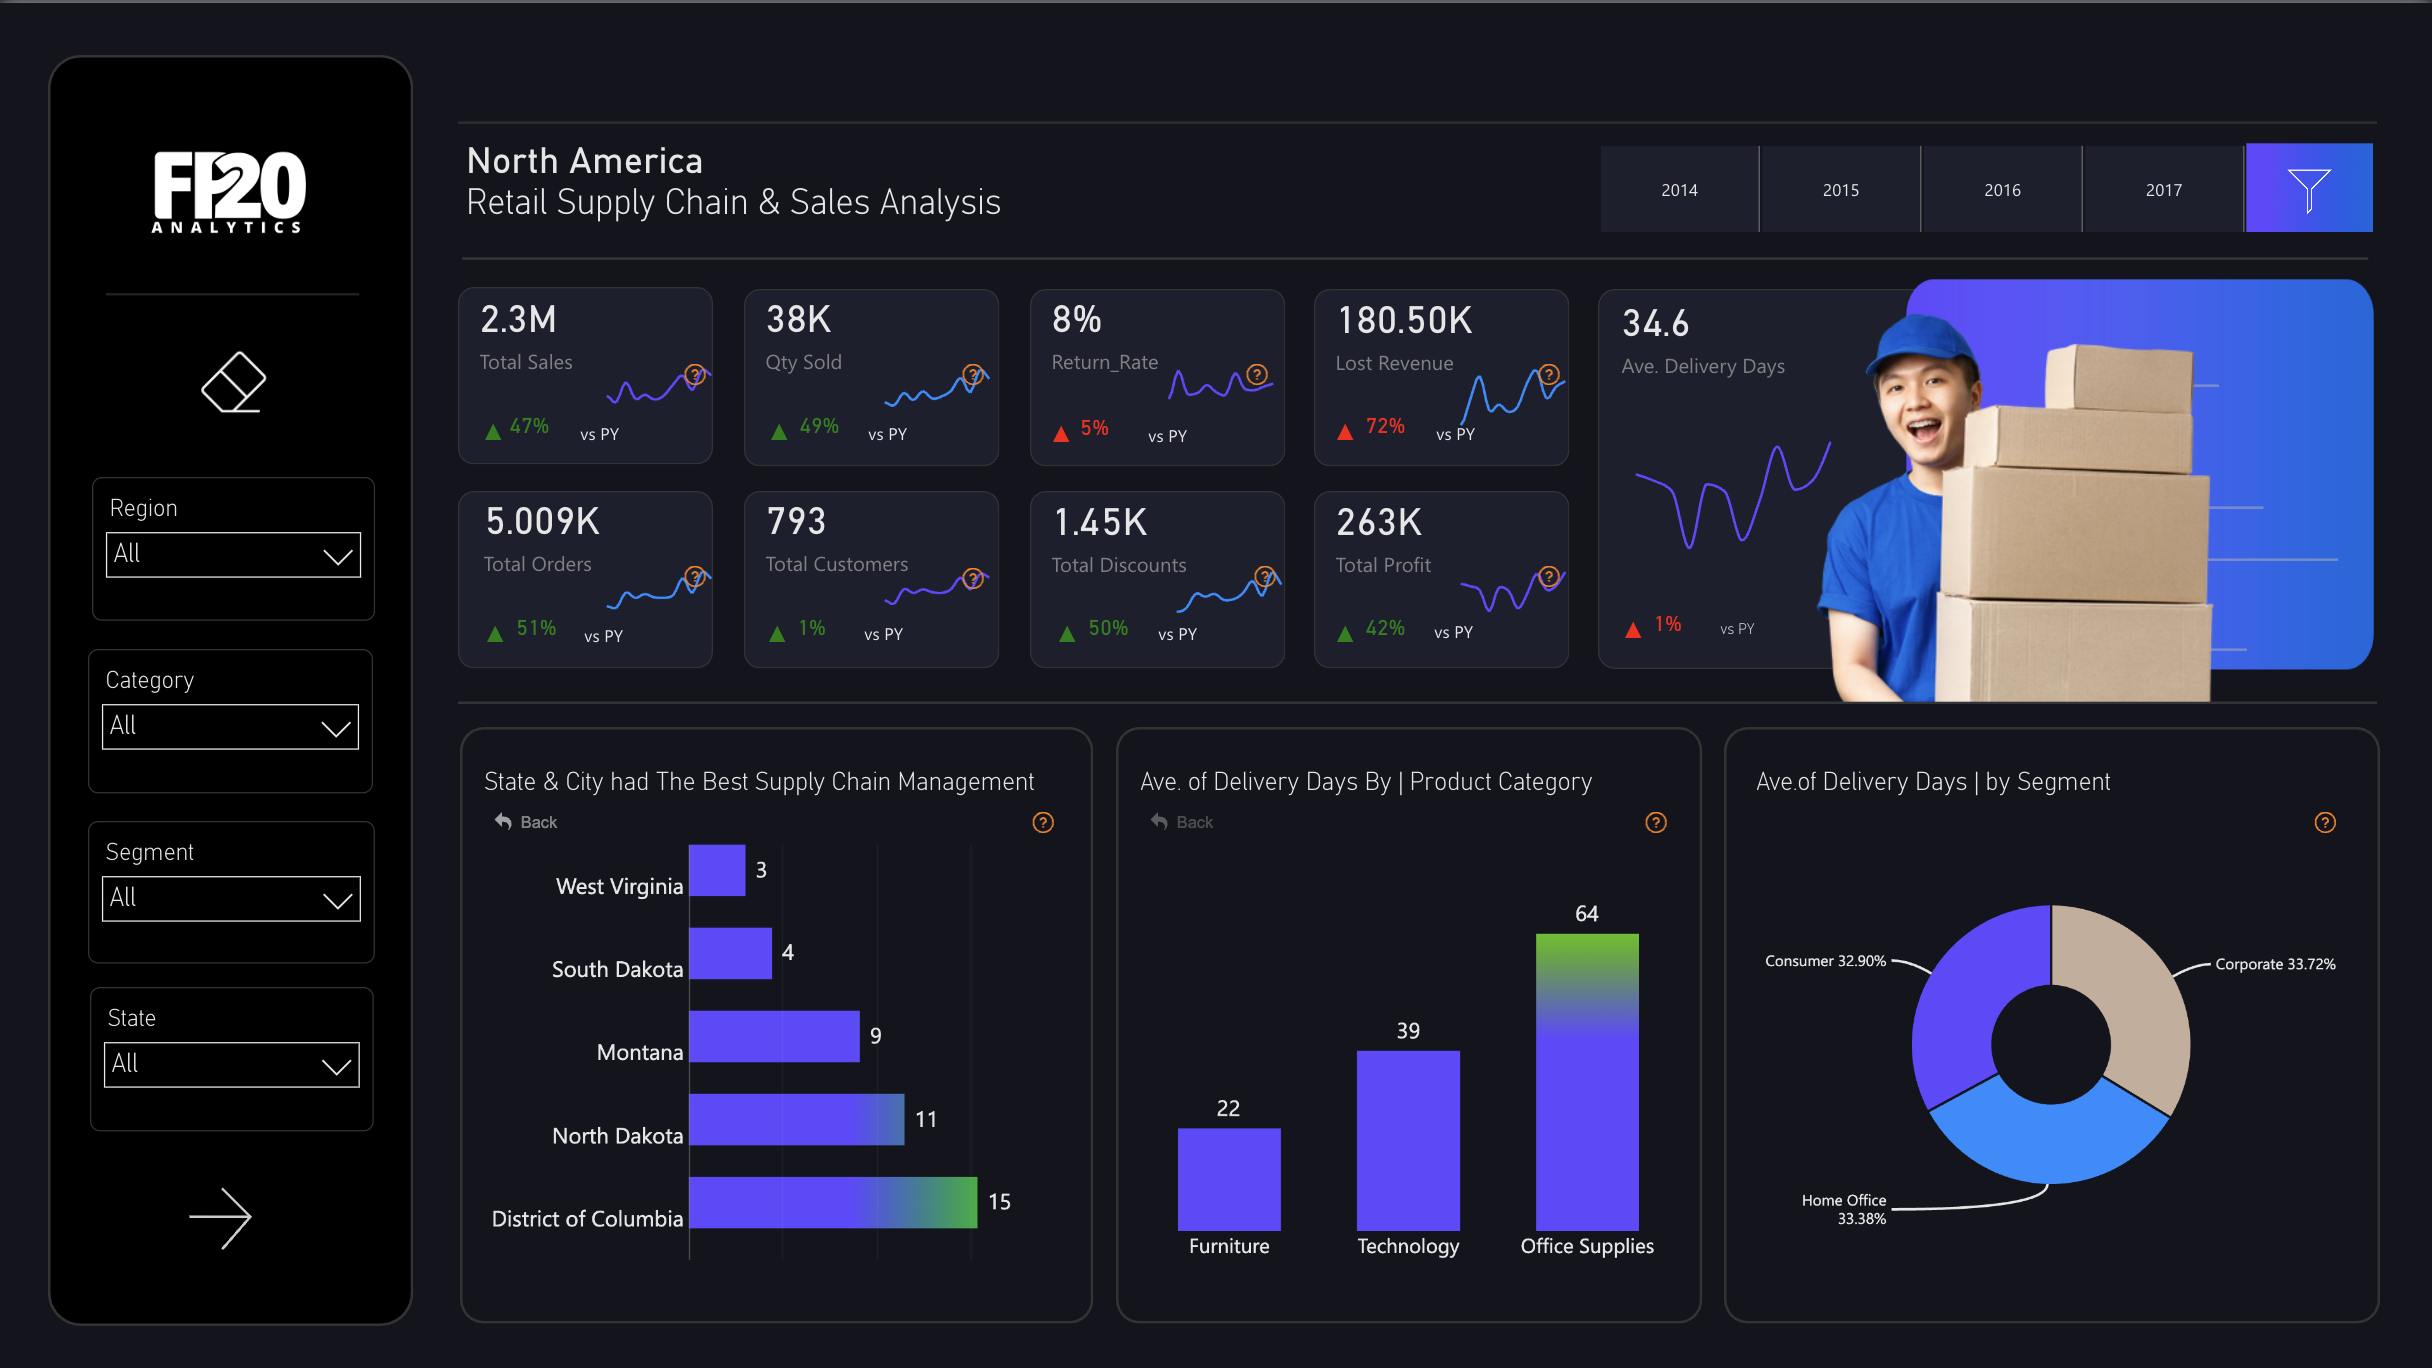
Power BI North America Retail Supply Chain & Sales Analysis Dashboard Template (Free PBIX Download)
81
If you find this website helpful, share it with friends and colleagues to boost their Power BI skills and work efficiency!
Like this site? Share it