AdventureWorks Global Sales & Customer Insights Dashboard
854 Downloads
Description
Key Insights
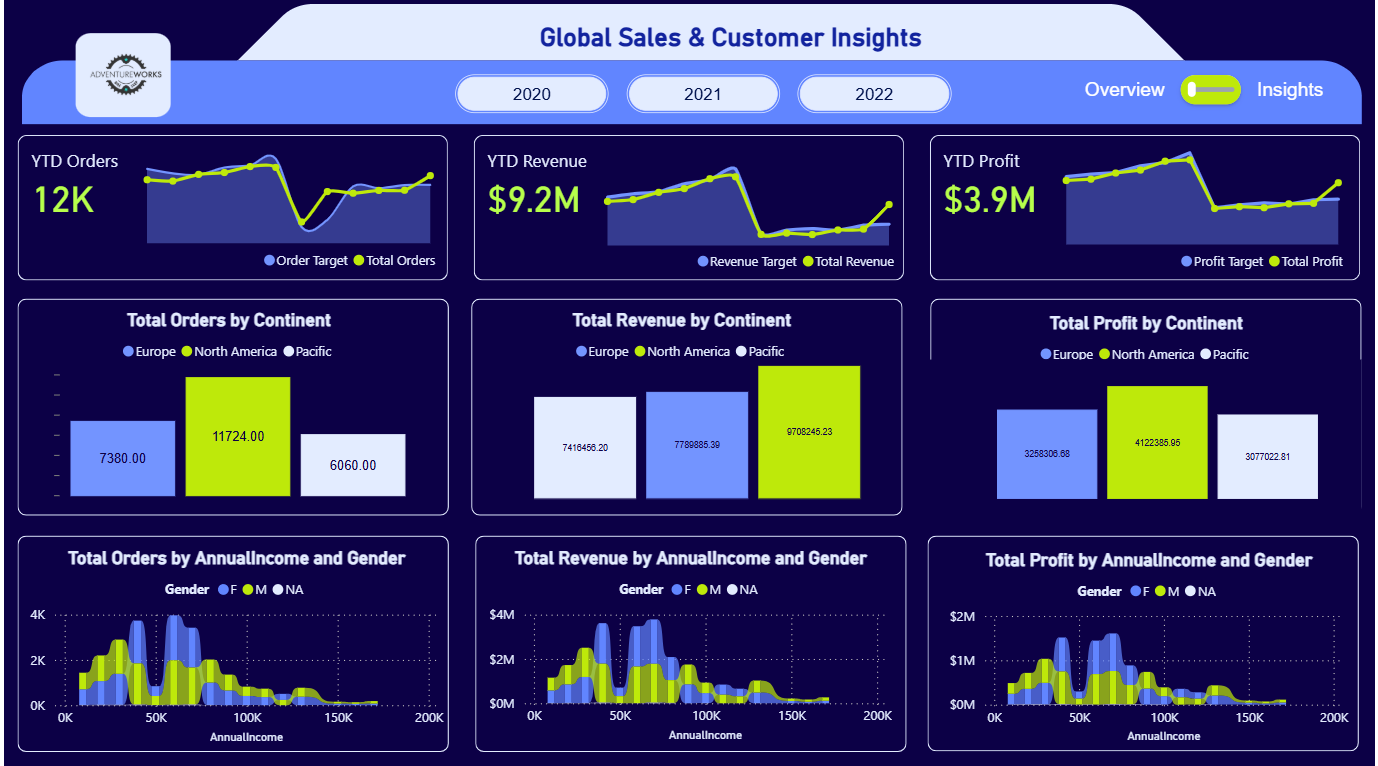
YTD Performance Summary (2022)
- Total Orders: 12K – slightly below target, showing a mid-year dip followed by recovery.
- Total Revenue: $9.2M – consistently below target throughout the year.
- Total Profit: $3.9M – missed target most months, with a sharp drop mid-year and partial recovery toward year-end.
Performance by Continent
| Continent | Orders | Revenue | Profit |
| North America | 11,724 | $7.79M | $4.12M |
| Europe | 7,380 | $7.42M | $3.26M |
| Pacific | 6,060 | $9.70M | $3.08M |
→ Pacific region delivers the highest revenue ($9.7M) despite lowest order volume → highest average order value.
→ North America leads in volume (11.7K orders) and profit ($4.12M).
→ Europe lags in both revenue and profit relative to its order count. Customer Segmentation: Orders, Revenue & Profit by Annual Income and Gender
- Peak purchasing activity (orders, revenue, and profit) occurs in the $30K–$80K annual income range across both genders.
- Male customers consistently outperform female customers in volume and value across almost all income brackets.
- Highest profit contribution comes from male customers earning $50K–$80K.
- Very low activity above $150K income and minimal contribution from “Not Available” gender/income segments.
Key Takeaways
- Overall performance in 2022 remained below target in revenue and profit, driven largely by a weak mid-year period.
- Pacific region is the most profitable per order – opportunity for pricing optimization or upselling.
- North America remains the volume and profit engine and should continue to receive strong marketing/sales focus.
- Core customer sweet spot is middle-income males ($30K–$80K) – tailor promotions, product bundles, and loyalty programs to this segment.
- Limited penetration in high-income segments (> $150K) – potential for premium product lines or targeted campaigns.
Recommended Actions
- Investigate and address the mid-year slump (supply chain, marketing, or seasonality issues).
- Replicate Pacific region’s high AOV strategies in North America and Europe.
- Increase focus on middle-income male segment with personalized offers.
- Explore premium offerings to capture untapped high-income customers.
The dashboard is designed using Flexa Design, Flexa Tables, and Flexa Charts from Flexa Intel.
Other Templates
 Free Sales & Revenue
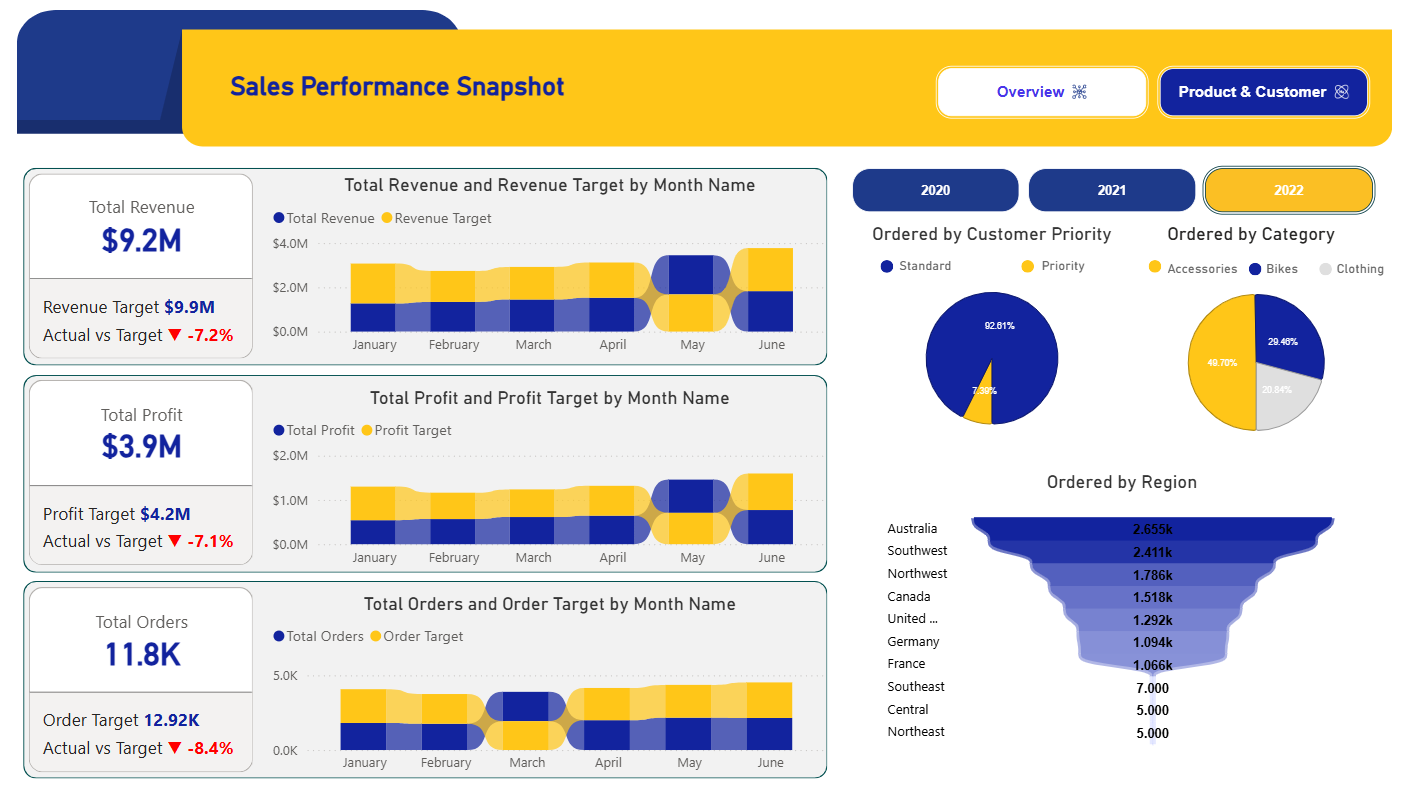
Sales Performance Snapshot dashboard
1.3k
 Free Sales & Revenue
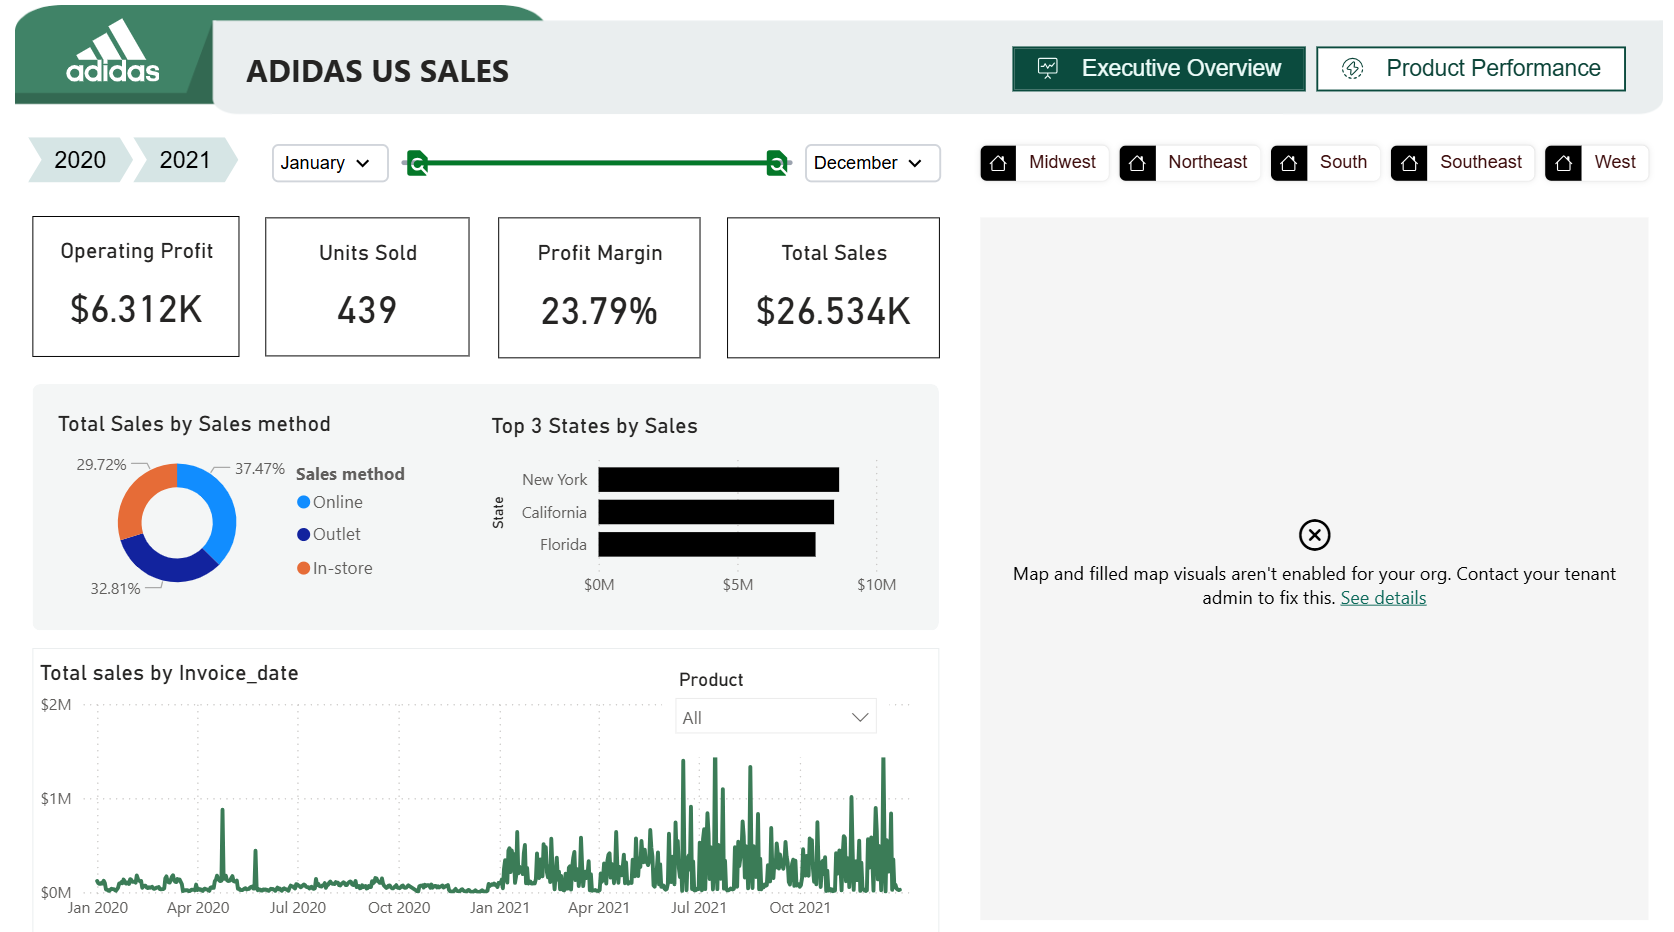
Adidas US Sales (2020–2021)
815
 Free Sales & Revenue
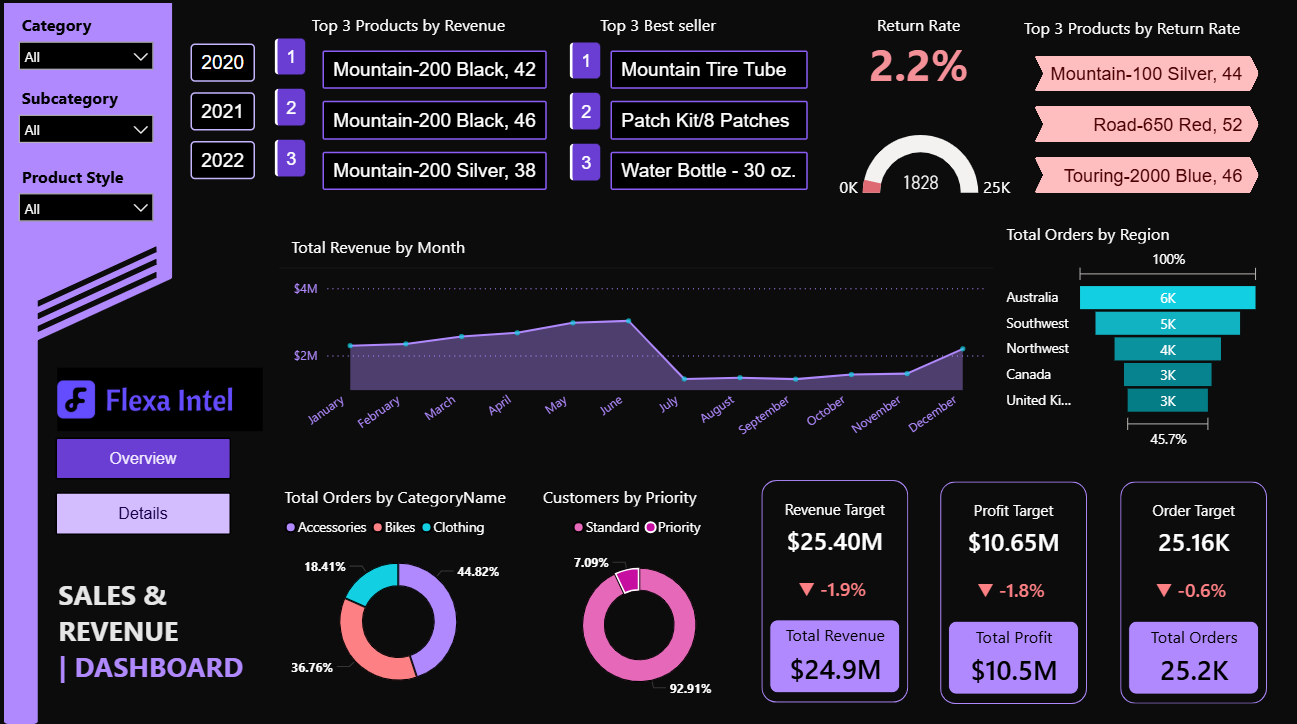
Sales & Revenue Dashboard – Key Insights (Full Year 2022)
1.1k
If you find this website helpful, share it with friends and colleagues to boost their Power BI skills and work efficiency!
Like this site? Share it