
Trading Strategy
Resample a real trade history to see the full range of outcomes — and the chance of ruin
A simulation that takes your historical per-trade profit and loss and replays it thousands of times in different random orders. One backtest shows a single path; this shows the whole distribution of paths the same edge could have produced — including the bad ones that a lucky sequence hid.
Answer the question: "My backtest returned 40% — but what is the realistic range of outcomes, how deep a drawdown should I expect, and what are the odds this strategy blows up the account?"
Data — What data do you need
| Field | Power BI field / example | Description |
|---|---|---|
| Trade Date | TradeDate | Close date of each trade. Orders the history and sets the period the forecast runs from. |
| Profit / Loss | Sum of PnL | Result of a single closed trade in account currency — negative for losers (e.g. -55.74, 152.55). |
Use Case — Position Sizing for a Systematic Strategy
Scenario: A trader has 190 closed trades from a systematic strategy with a 58% win rate. The backtest looks strong, but it is one ordering of those trades. Before committing more capital the trader wants to know how the same edge behaves across thousands of re-orderings, and whether 2% risk per trade survives a bad run.
Configuration:
- ▸Problem Type: Trading Strategy
- ▸Date: TradeDate
- ▸Values: Sum of PnL — one row per closed trade
- ▸Initial balance: $10,000
- ▸Risk per trade: 2%
- ▸Forecast horizon: 12 months
Sample output — outcome range across 10,000 resampled paths:
| Percentile | Ending Balance | Return | Max Drawdown | Longest Losing Run |
|---|---|---|---|---|
| P5 (bad run) | $8,400 | −16% | −31% | 9 trades |
| P25 | $11,900 | +19% | −22% | 7 trades |
| P50 (median) | $14,600 | +46% | −17% | 6 trades |
| P75 | $17,800 | +78% | −13% | 5 trades |
| P95 (good run) | $22,300 | +123% | −9% | 4 trades |
| P(ruin) | 1.8% of paths | — | — | — |
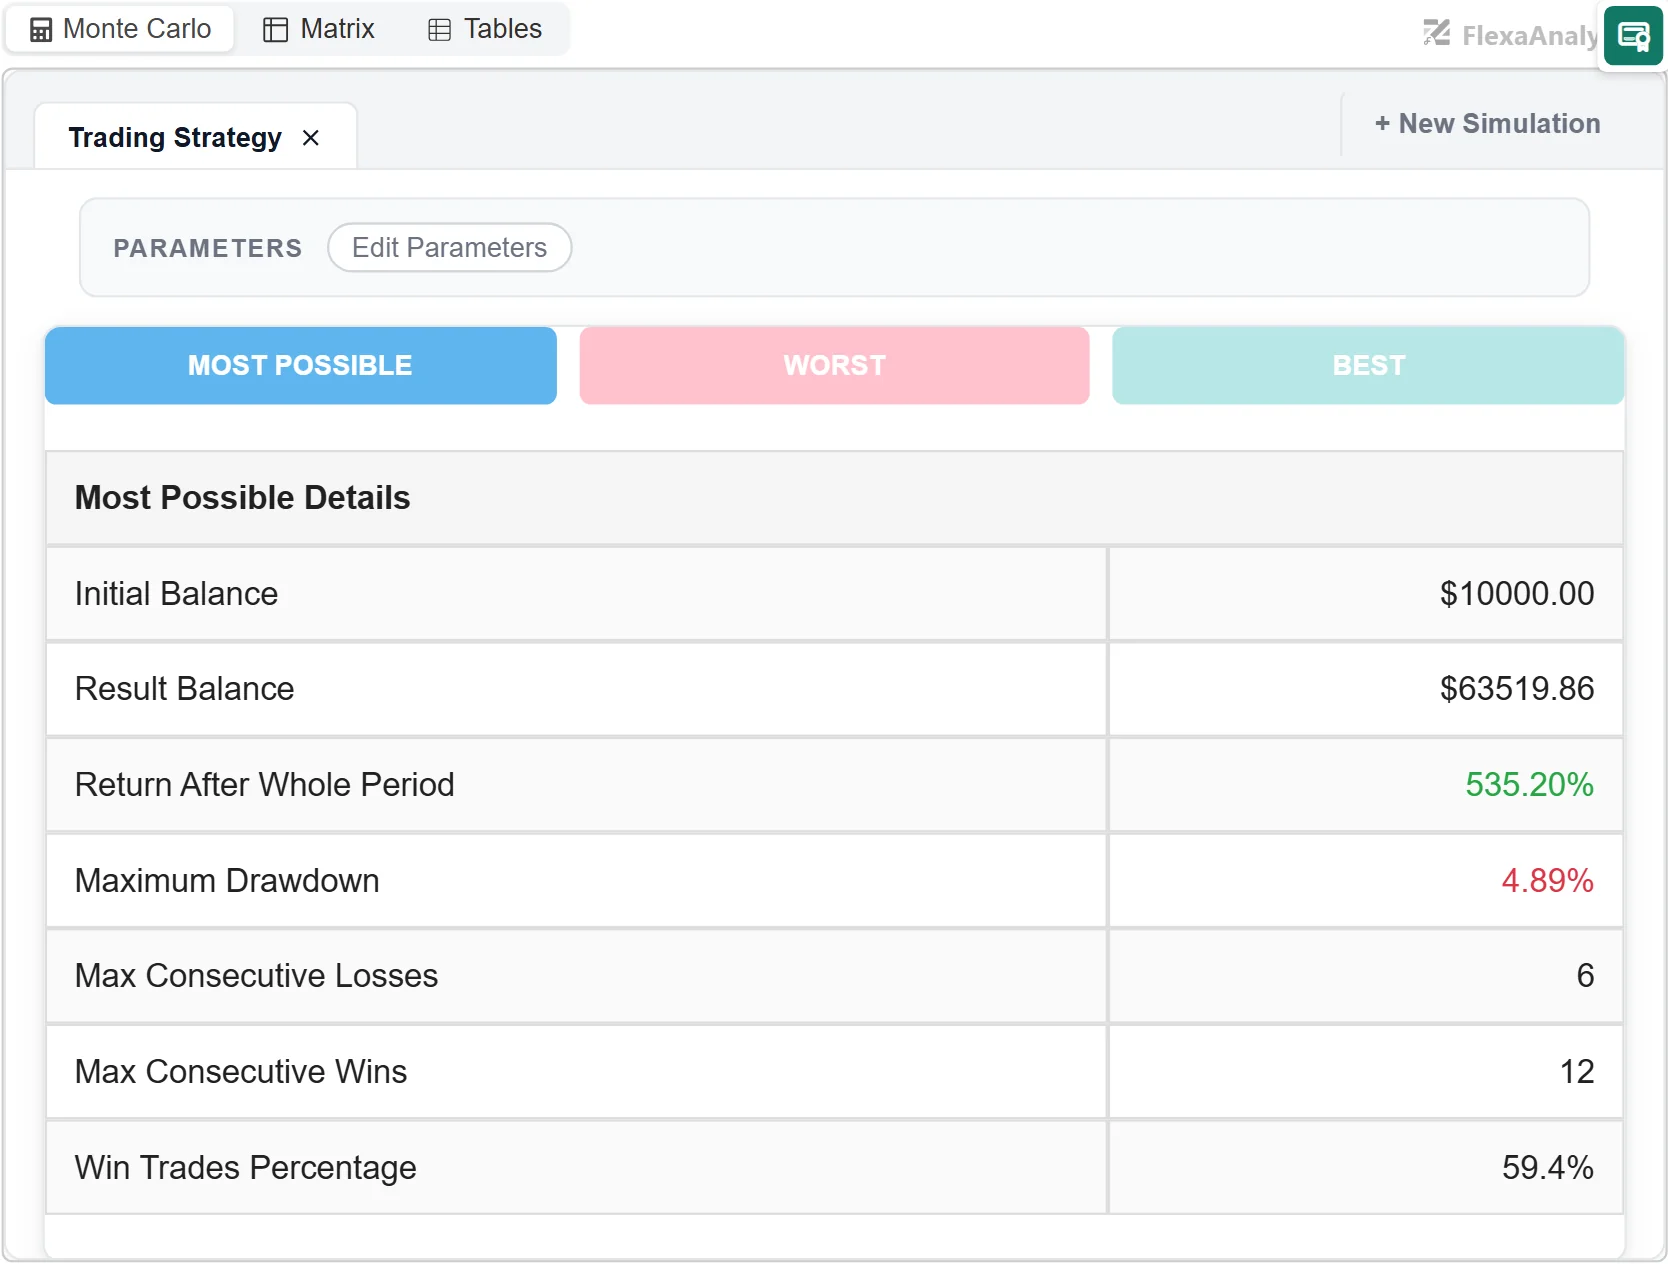
The visual reports three scenarios side by side — Most Possible, Worst and Best — so the downside is never one click away.