Project Management
Estimate project completion dates across 10,000 schedule scenarios
A simulation that estimates total project duration by running 10,000 schedule scenarios across all tasks. Each task has three time estimates and the model uses these — plus task dependencies and delay probabilities — to calculate realistic completion times.
Answer the question: "Given our task estimates and known risks, when will this project most likely finish — and what's the probability it gets delayed?"
Data — What data do you need
| Field | Power BI field / example | Description |
|---|---|---|
| Project | Project Alpha, Project Beta | Project name or ID — used to group tasks and output per project. |
| Task | Task name within each project | Individual task names — one row per task. |
| Optimistic duration | Best-case duration estimate | Shortest realistic time to complete the task (best case). |
| Most Likely duration | Expected duration under normal conditions | The expected time under normal conditions. |
| Pessimistic duration | Longest realistic time if things go wrong | The longest realistic time when things go wrong. |
| Dependency | Sum of Dependency (Task IDs) | Which tasks must finish before this one can start. Entered as task IDs. |
| Probability of Delay (%) | Sum of DelayProb | How likely this task is to be delayed. Values between 0 and 1 (e.g. 0.20 = 20% chance of delay). |
| Risk Level | RiskLevel | Low / Medium / High or a numeric percentage indicating overall task risk. |
Use Case — Estimating Completion Date for 4 Concurrent Projects
Scenario: A PMO director manages four concurrent software projects. Each project has 5–8 tasks with known dependencies. Some tasks have a high delay probability due to vendor dependencies. The director wants a probability-weighted completion date for each project — not just a single Gantt milestone.
Configuration:
- ▸Problem Type: Project Management
- ▸Project: ProjectName
- ▸Task: TaskName
- ▸Optimistic / Most Likely / Pessimistic: duration columns in weeks
- ▸Dependency: Sum of Dependency (Task IDs)
- ▸Probability of Delay: Sum of DelayProb (0–1 decimal)
Sample output — P10/P50/P90 completion duration per project (in weeks):
| Project | P10 (Optimistic) | P50 (Most Likely) | P90 (Pessimistic) | Delay Prob |
|---|---|---|---|---|
| Project Alpha | 14 wks | 18 wks | 24 wks | 22% |
| Project Beta | 8 wks | 11 wks | 16 wks | 12% |
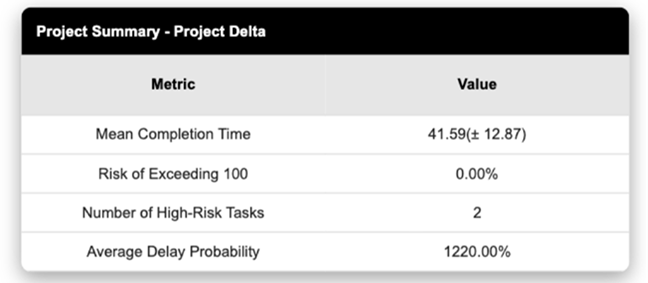
| Project Delta | 20 wks | 26 wks | 35 wks | 38% |
| Project Gamma | 6 wks | 8 wks | 12 wks | 8% |