
Operational Risk
Turn an incident log into next year's downtime cost — and the buffer to hold against it
A simulation that reads a history of equipment failures and projects the cost of the ones that have not happened yet. How often failures arrive is modelled as a Poisson process; how long each takes to repair is drawn from a lognormal fitted to your repair times — the shape that matches maintenance data, where most repairs are quick and a few run very long.
Answer the question: "Unplanned downtime cost us $95K last year. What should we budget for next year — and how much more than the average do we need set aside for a bad year?"
Data — What data do you need
| Field | Power BI field / example | Description |
|---|---|---|
| Incident Date | IncidentDate | Date of each failure. The span between first and last incident sets the observation window the failure rate is derived from. |
| Repair Hours | Sum of RepairHours | Downtime caused by that incident, in hours (e.g. 7.3, 9.6). Fitted to a lognormal. |
| Equipment ID | EquipmentID | Optional. Splits the forecast per asset so one bad pump does not hide behind the fleet average. |
Use Case — Maintenance Budget for a Production Line
Scenario: A plant manager has three years of pump failures — 48 incidents with repair times logged in hours. Finance wants a downtime figure for next year's budget, and the manager needs to justify a contingency line on top of it rather than budgeting to the average and overspending in half of all years.
Configuration:
- ▸Problem Type: Operational Risk
- ▸Date: IncidentDate
- ▸Values: Sum of RepairHours
- ▸Entity (optional): EquipmentID
- ▸Downtime cost: $1,000 per hour
- ▸Time horizon: 1 year · Distribution: Lognormal · Iterations: 10,000
Sample output — annual downtime cost across 10,000 simulated years:
| Measure | Value | What it is for |
|---|---|---|
| Failure rate (λ) | 18.3 per year | Derived from incident count over the logged period |
| Repair time | 7.45 h mean, 3.83 h σ | Lognormal fitted to the repair hours column |
| Average annual cost | $136,213 | The budget line |
| 95th percentile (VaR₉₅) | $197,622 | Exceeded in 1 year out of 20 |
| Expected shortfall (CVaR₉₅) | $215,757 | Average cost of the years that do exceed it |
| Min / max simulated | $22,912 / $302,620 | Full range across 10,000 years |
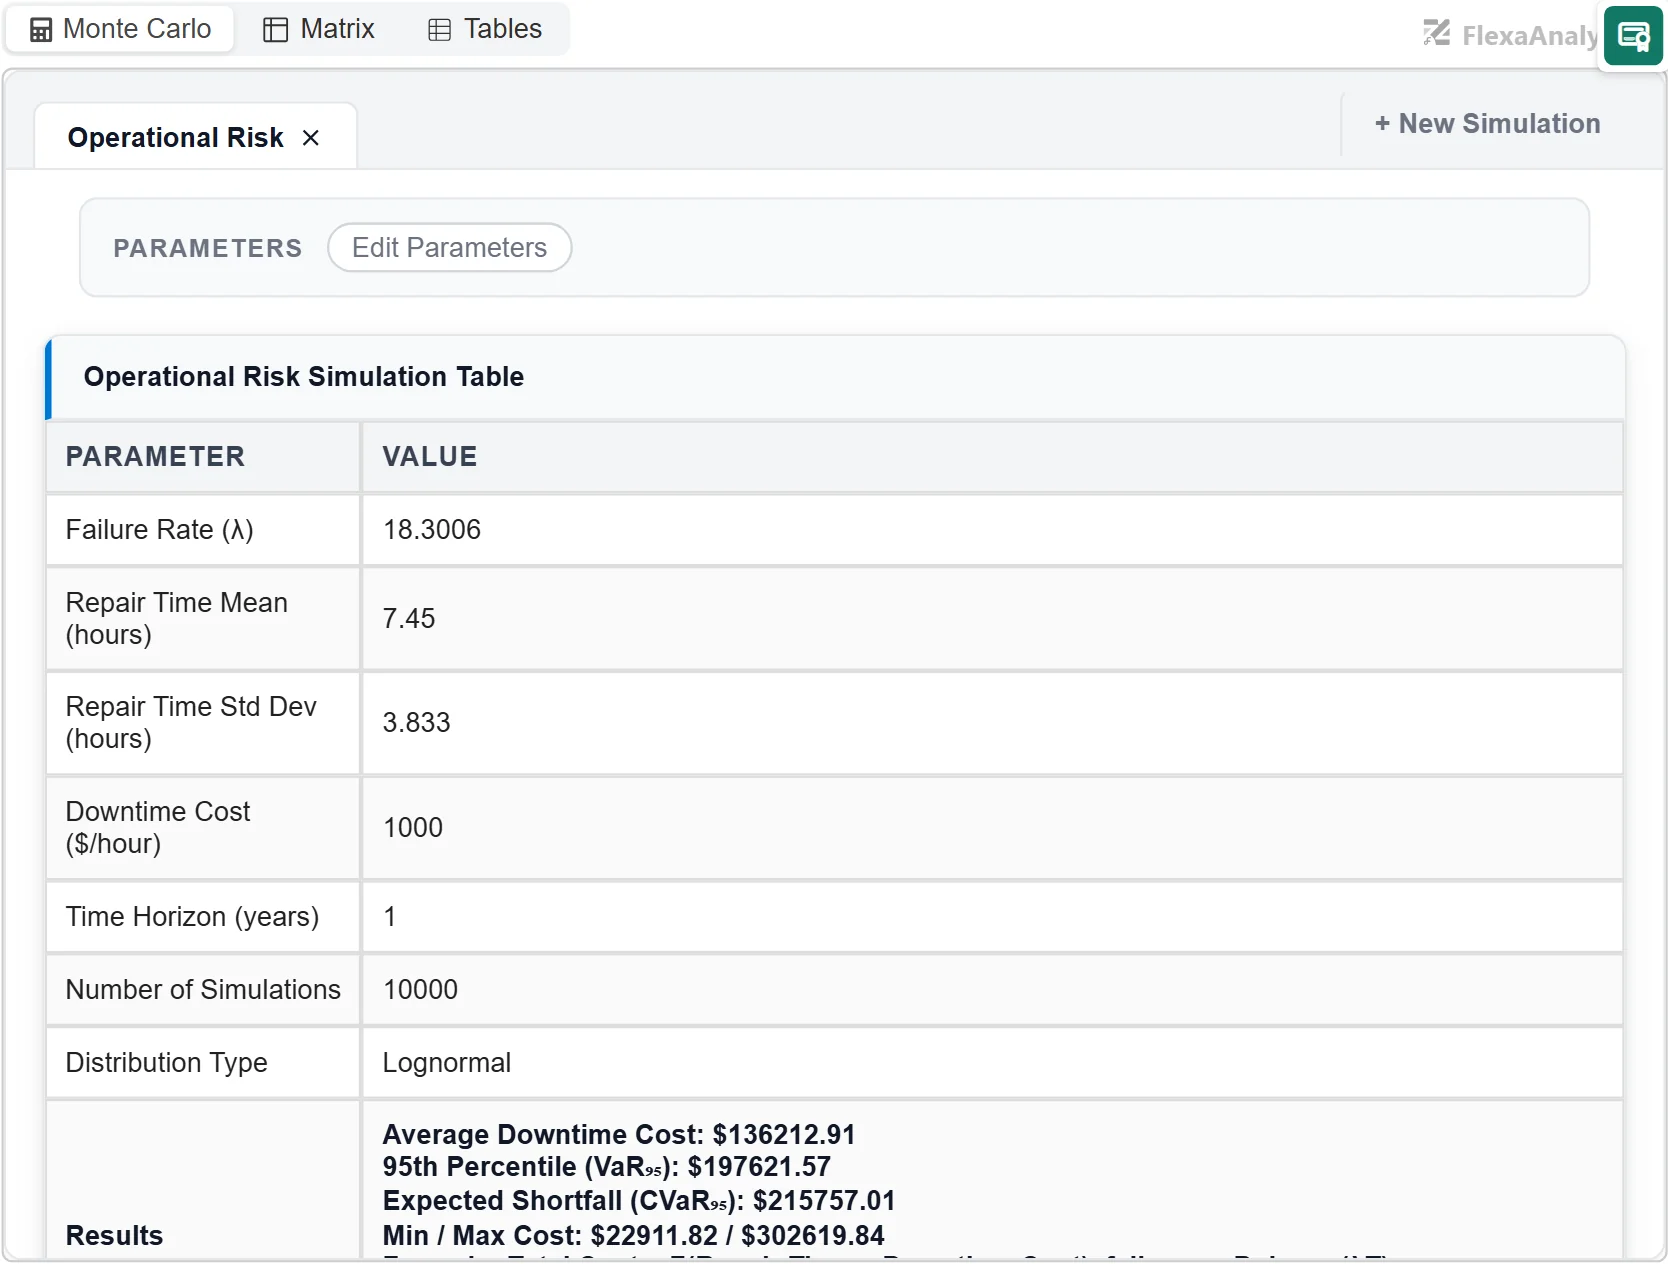
Fitted inputs on the left, distribution of annual cost on the right — every parameter the model used is shown, not hidden behind the result.